Typical Appearance In Vertical Cross Sections
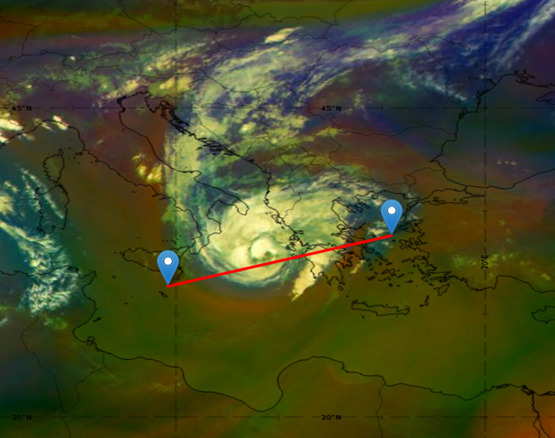
Figure 1: Airmass RGB, 17.9.2020. 15 UTC (Medicane Ianos).
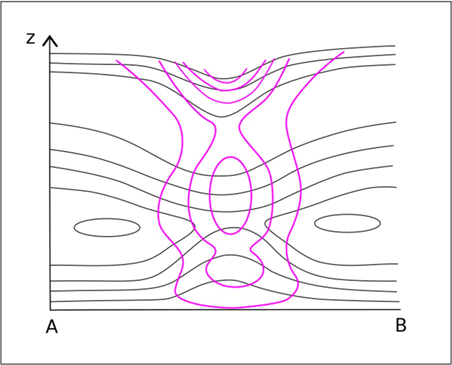
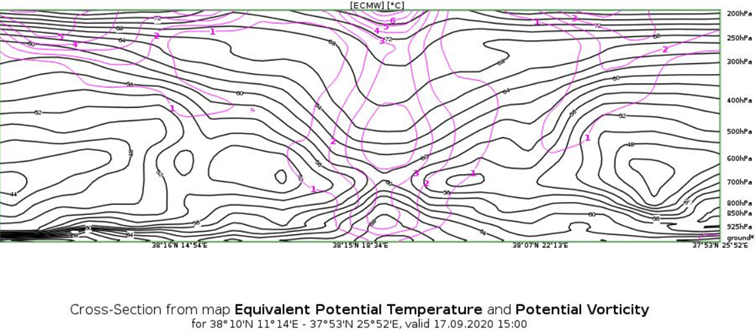
Figure 2: A schematic of the vertical cross section (above) and an actual vertical cross section (below) showing the equivalent potential temperature (black lines) and the PVA (pink lines) from ECMWF model data.
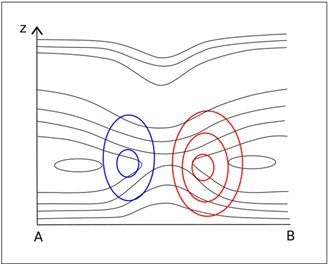
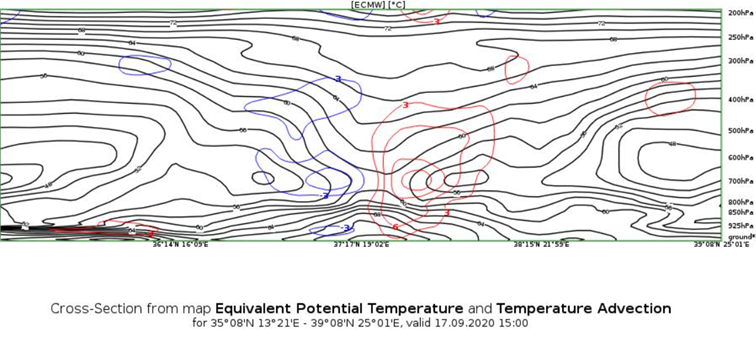
Figure 3: A schematic of the vertical cross section (above) and an actual vertical cross section (below) showing the equivalent potential temperature (black lines) and the temperature advection (red and blue lines) from ECMWF model data.
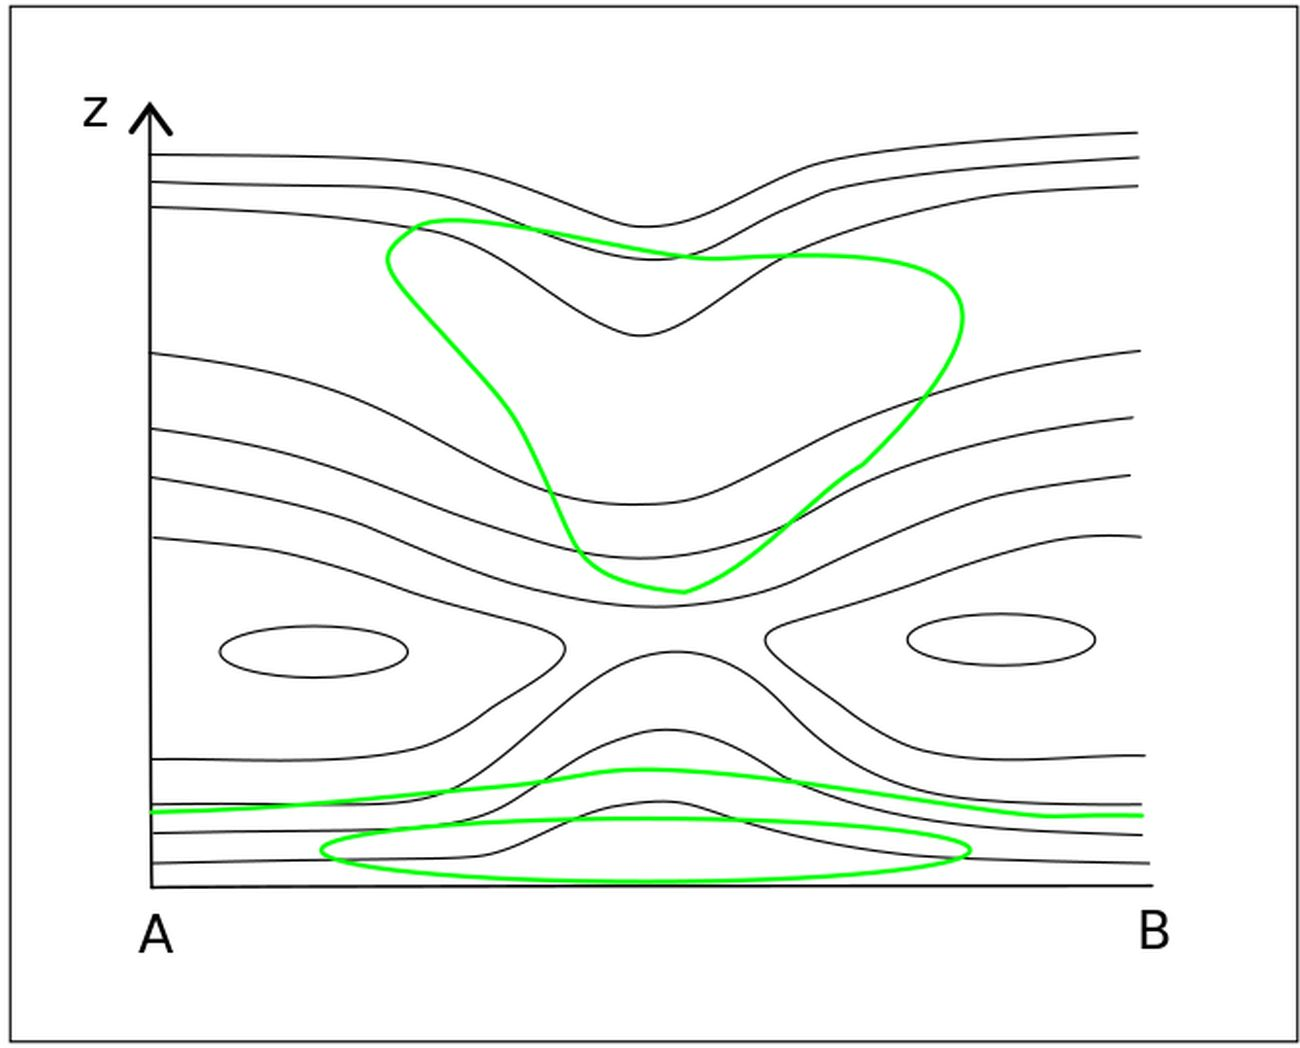
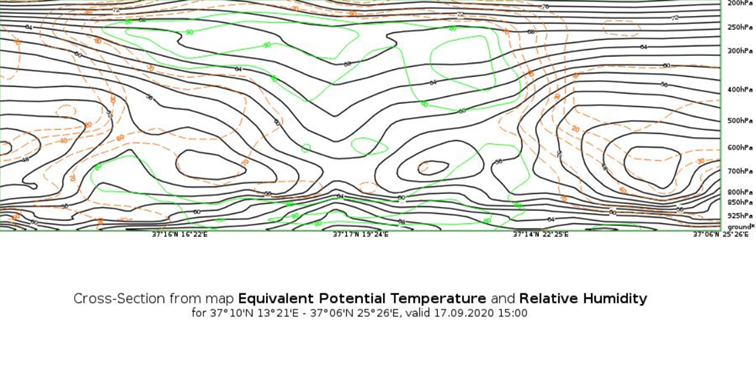
Figure 4: A schematic of the vertical cross section (above) and an actual vertical cross section (below) showing the equivalent potential temperature (black lines) and the relative humidity (green lines) from ECMWF model data.
At 1500 UTC on 17 September, Ianos was already a medicane and the PV structure has the characteristic alignment throughout the troposphere, with the creation of a PV 'tower' in the center of the medicane.
There is a more prominent vertical gradient of equivalent potential temperature in the eyewall region and the isentropes slope radially outwards with height. The pattern of the isentropes reflects the rise of air parcels in the eyewall from the lower layer to the upper level outflow. The inward radial gradient is present due to the increase in the moisture flux from the sea because of the rapid increase of wind speed with decreasing radius as the eyewall is approached.