Cloud Structure In Satellite Images
Deformation is a feature of a varying wind field, which affects cloud formations and humid areas influenced by the wind field.
In satellite images, a Deformation Band is a cloud line that:
- elongates, becoming narrower and longer, usually keeping its orientation
- thins out in the middle, eventually breaking
- can be straight or slightly arched
Deformation zones are generated by opposing flows, where two synoptic or meso-scale cloud systems are brought closer to each other. A deformation zone needs a cyclonic and an anticyclonic circulation to form. As anticyclonic circulations tend to be rather dry, characteristic patterns for deformation zones can be best seen in water vapour image loops. After the deformation stage the cloud dissipates or merges with other cloudiness.
The deforming band elongates in the direction of the upper level flow. Often there is sinking motion on the poleward side of the cloud band. This sinking air can be seen spreading in both directions with the upper level wind field.
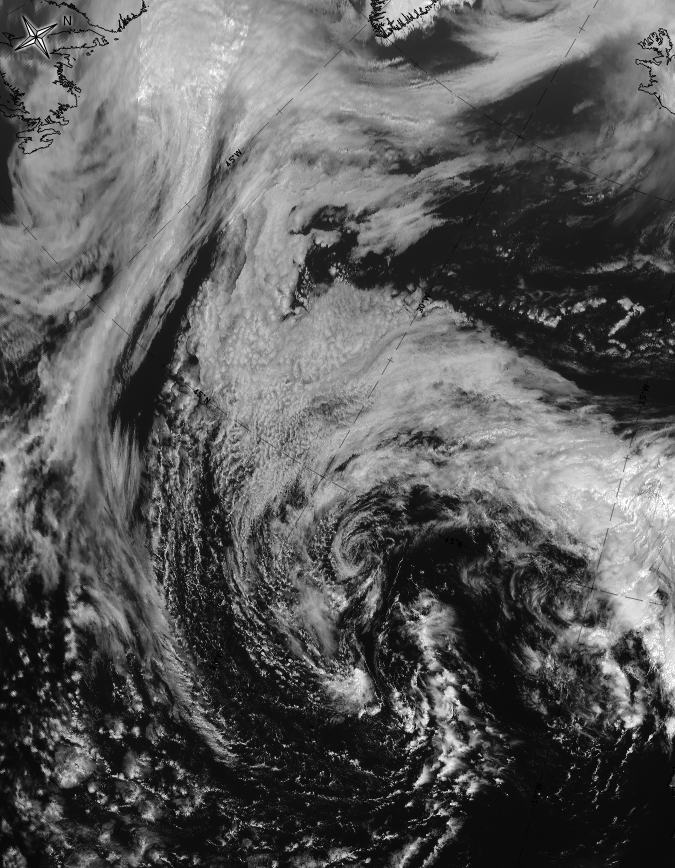
Appearance in the basic channels
- In VIS images grey, partly translucent fibres with well confined, even sharp, edges
- In IR images, a grey or white, narrow, fibrous cloud band with well confined edges
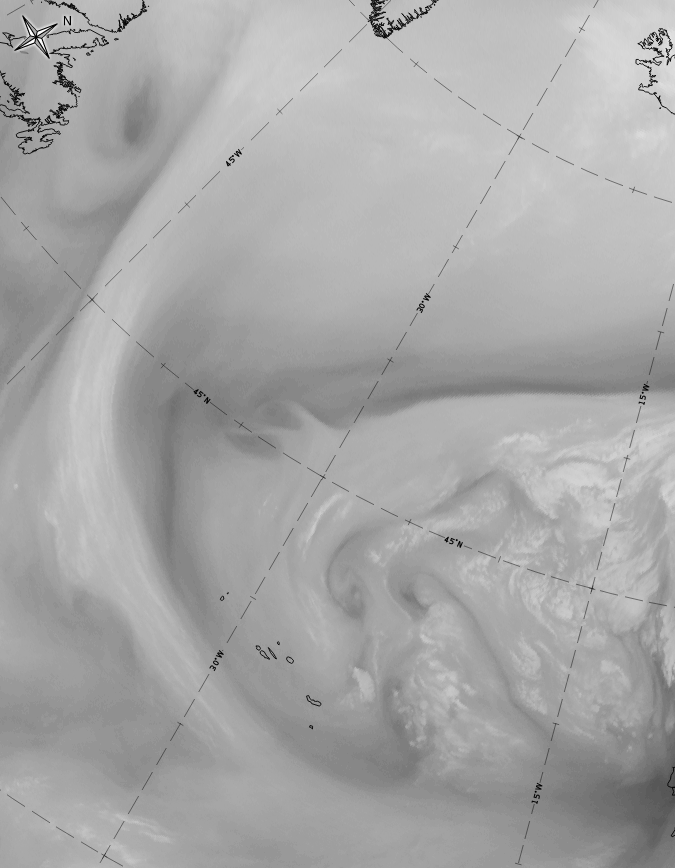
- In WV images, a grey or white band, often with a dark area on the poleward side
Appearance in the basic RGBs
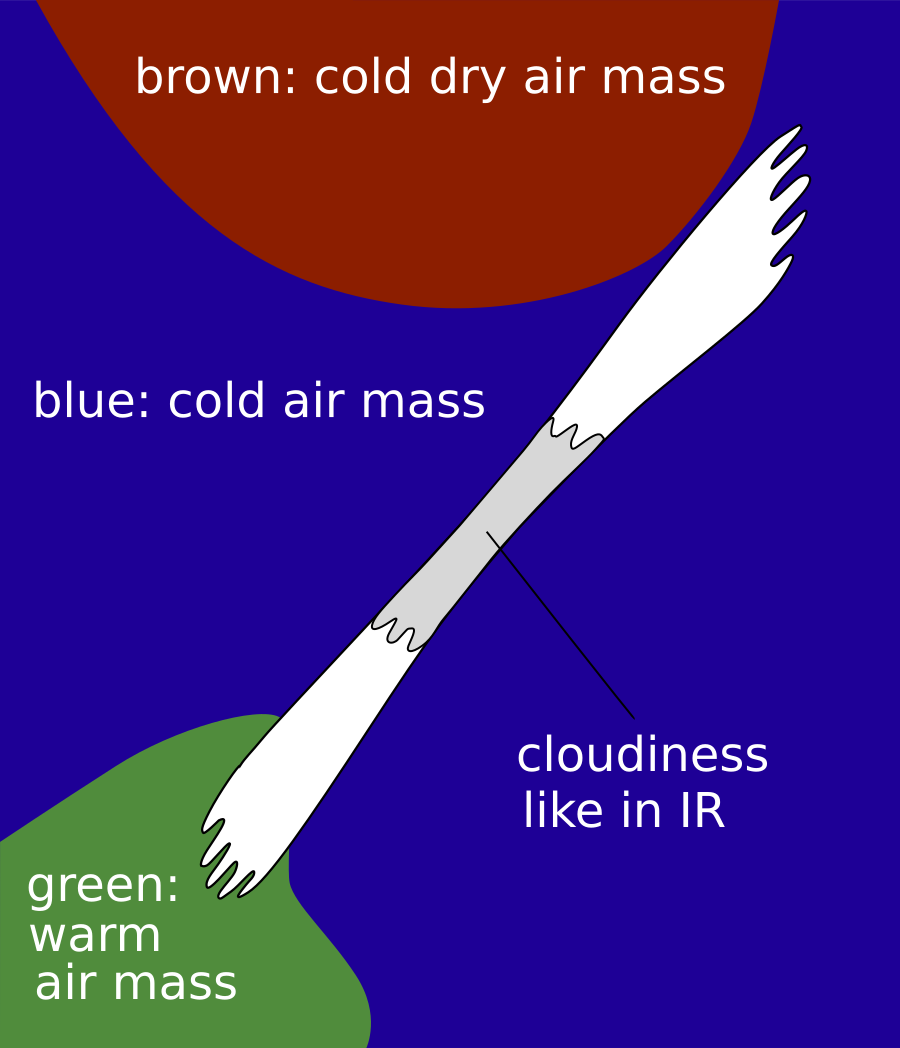
Airmass RGB
As the deformation band cloudiness expands into two low centres travelling in opposite directions, the cold and dry air masses at the rear side of these low centres appear on different sides of the band. In the southern part of a deformation cloud band, warm air masses with greenish colours tend to occur.
The deformation cloud band appears very similar to that in the IR image.
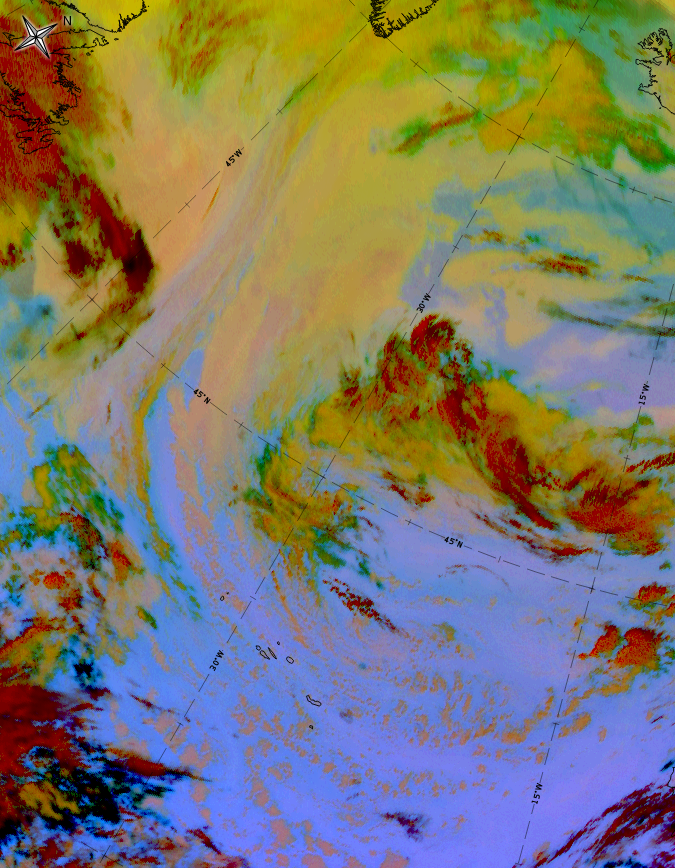
Dust RGB
Around the deformation cloud band there are blue or pinkish blue colours where there is no cloud beneath, but it is mostly it is filled with low level cloud patches and cells in ochre colours.
In the most advanced stage of development, the deformation cloud band consists of dark red stripes and fibres indicating rather thick ice cloud. During the decay process, the stripes and fibres become thinner and therefore change to black colours. Low level cloud patches also appear below.
 |
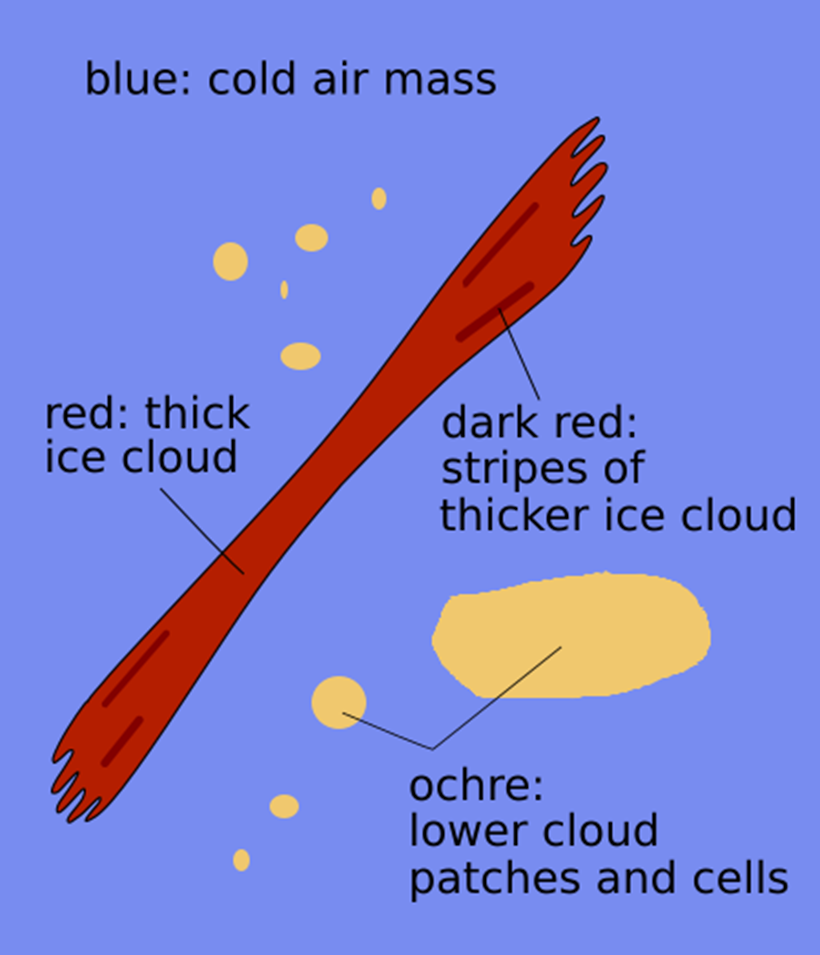 |
Basic RGB schematics. Left: Airmass RGB; right: Dust RGB.
This case from 4 May 2020 at 12UTC shows a deformation band at its most advanced stage of development.
|
|
|
|
|
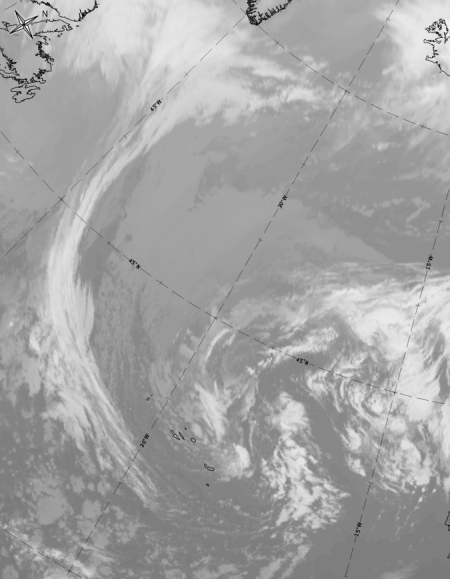
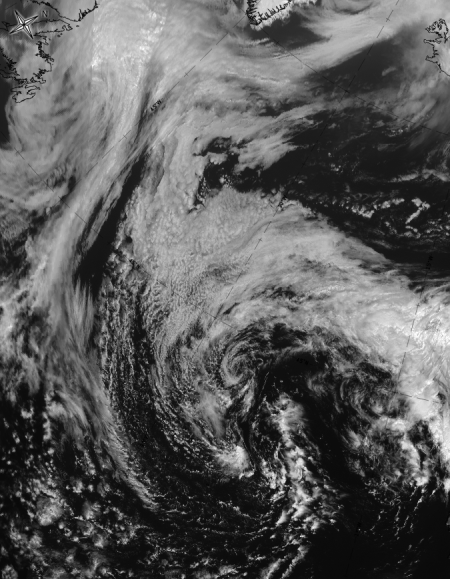


| IR | White to light grey; fibrous appearance. |
| HRV | Some white parts, mostly grey. |
| WV | Light grey band of high humidity. |
| Airmass RGB | Cloud band similar to IR; embedded within blue to brown areas. The brown areas representing cold and dry air belong to the two cyclonic systems. |
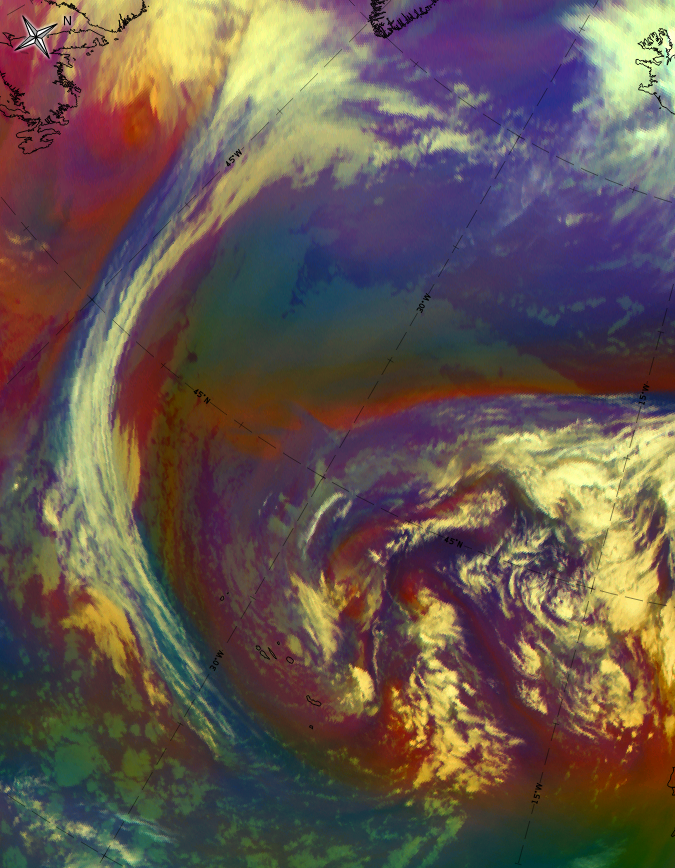
| Dust RGB | Dark red stripes above ochre to greenish colours. |
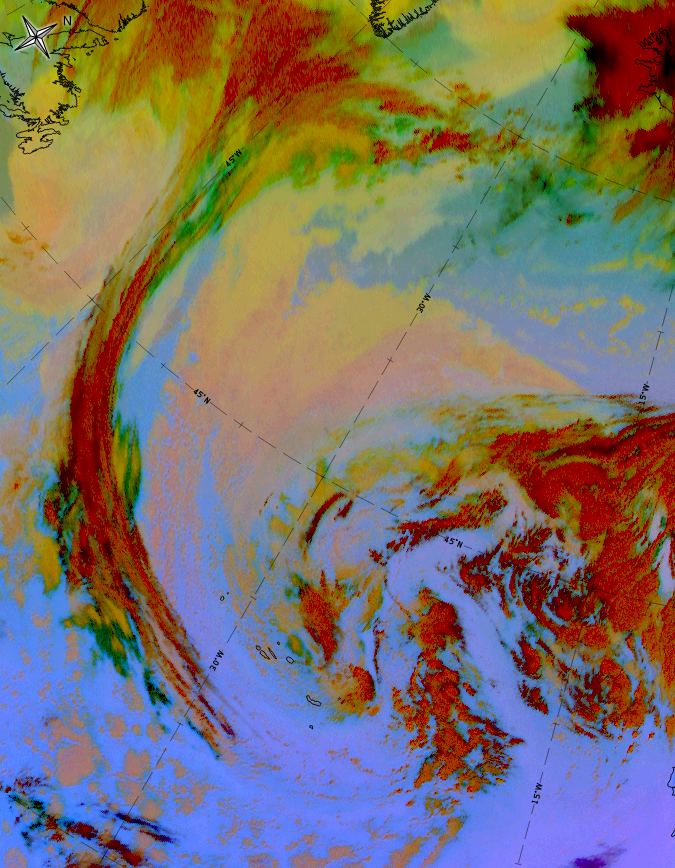
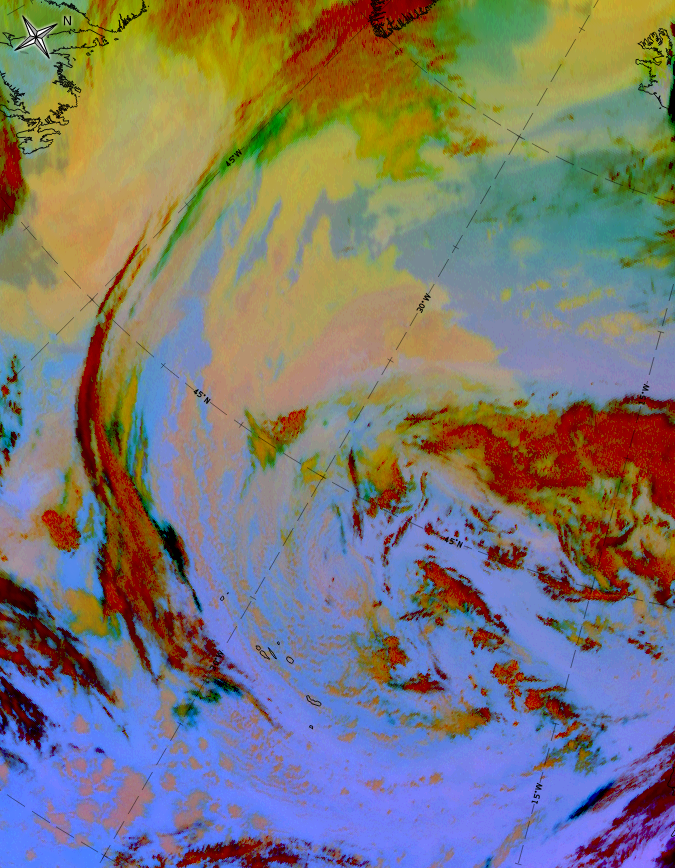
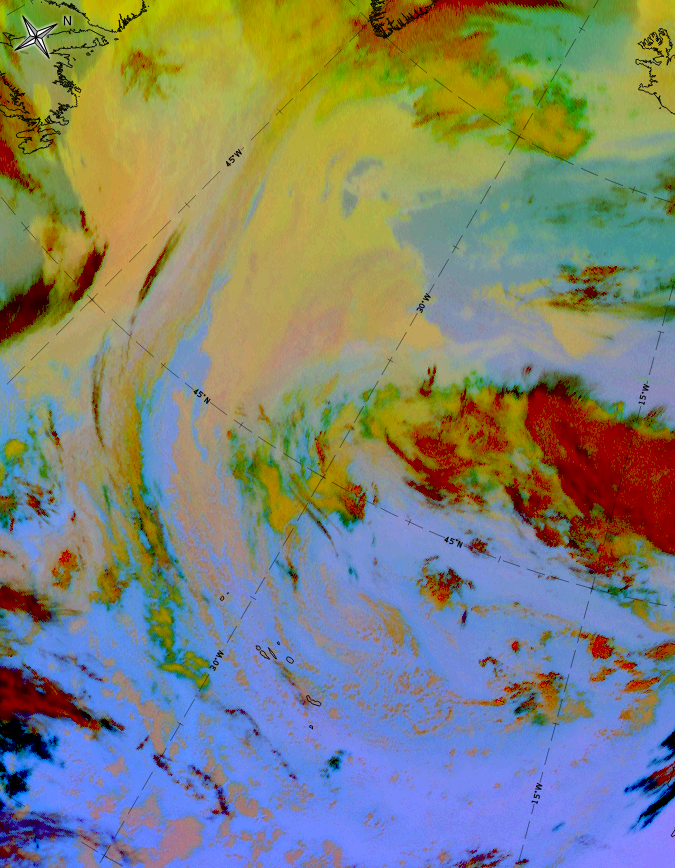
This 6-hourly image sequence from 4 May, 12 UTC to 5 May, 06 UTC demonstrates the decay of the deformation cloud band. The dark red stripes dissolve and/or change to black translucent stripes that also dissolve, leaving small ochre cloud bands typical of mid-level cloud. Green areas represent thin low to mid-level cloud.
 |
 |
 |
 |
4 May 2020, 12 UTC to 5 May 2020, 06 UTC: Dust RGB;
u.l.: 4 May 12UTC , u.r.: 4 May 18 UTC l.l.: 5 May 00 UTC, l.r.: 5 May 06 UTC.
Note: click on any Dust RGB image to access image gallery (navigate using arrows on keyboard)
The development of the Deformation Band can best be seen in an animation:
18 February 2009/00.00 UTC - Meteosat 8 IR 10.8 image;
In this loop a Deformation Band stretching from Poland to White Sea gradually narrows and elongates while being stationary. Loop shows WV 6.2 images 18 February 2009 hourly from 00.00 UTC to 07.00 UTC.