Table of Contents
Cloud Structure In Satellite Images
According to the schematic below, Convergence Cloud can be seen during the far developed occlusion stage as a separate, curved cloud band which spirals approximately parallel to the occlusion spiral, from the Northeast to the end of the occlusion spiral. With a short inspection it could be classified as the remnants of a warm front cloud band but when taking into account the development process it becomes clearly different. It develops not together with the occlusion but develops later instead. This is discussed in the chapter: "Meteorological-physical background".
There are two scenarios which can be differentiated in the two schematics below.
 |
 |
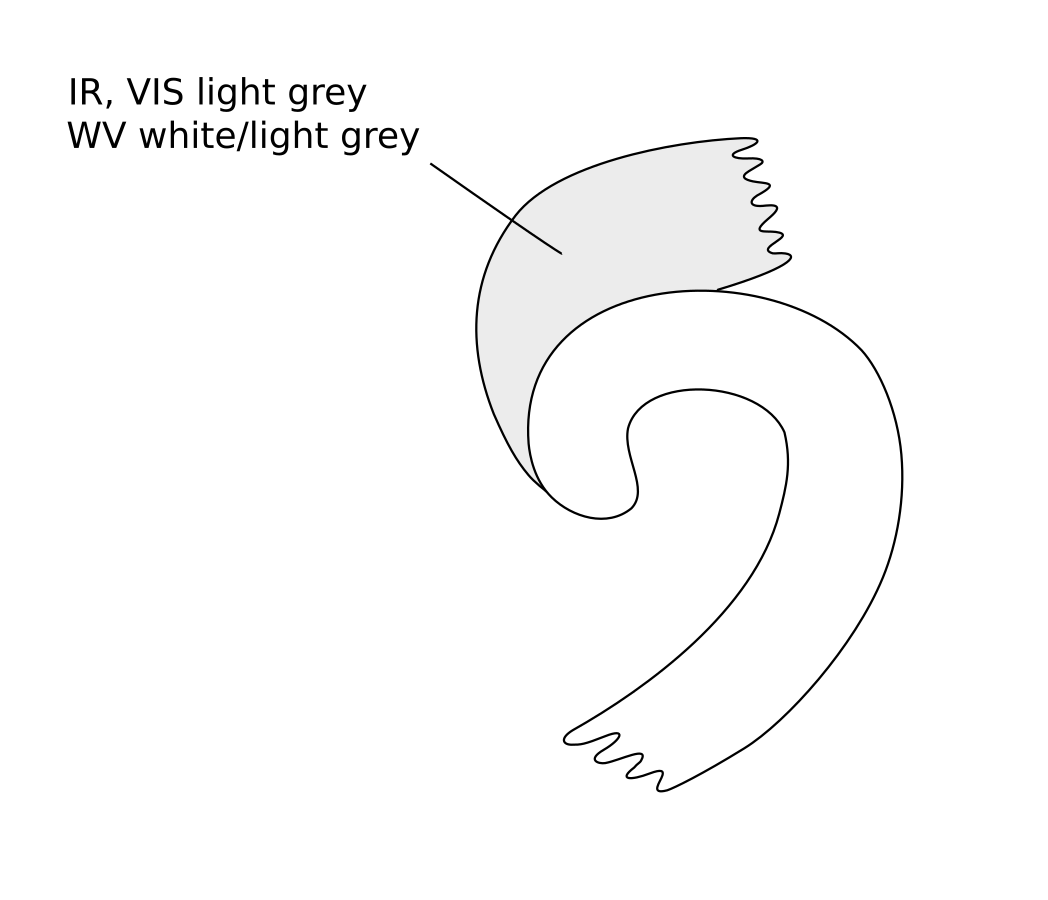
Appearance in the basic channels:
For both types:
- IR10.8: often a little bit warmer cloud-top temperatures than those associated with the occlusion cloud, therefore they appear light grey in the IR image, and are sometimes fibrous and broken
- VIS0.8: light grey
- WV6.2: varying from very bright to light grey
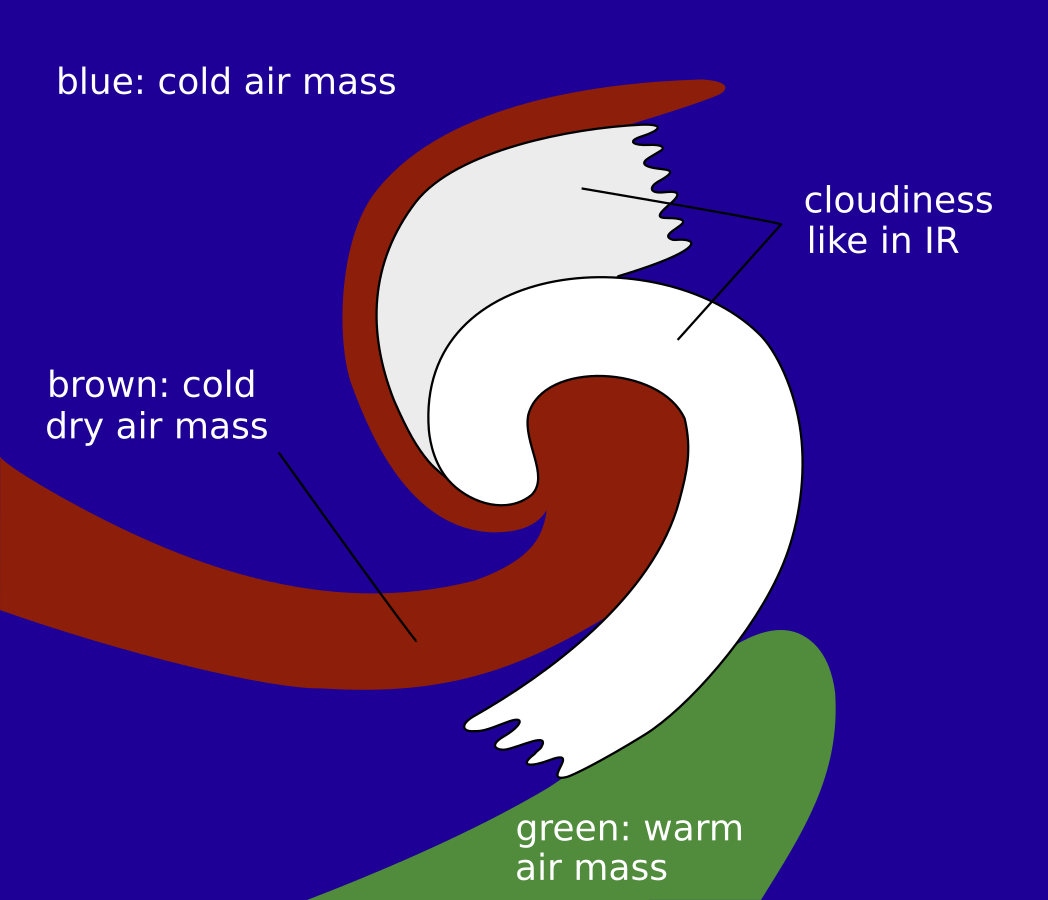
Appearance in the basic RGBs:
For both types:
Airmass RGB
The Convergence Cloud develops within the cold airmass and is therefore surrounded by blue colours, however in most cases there is a dark brown stripe at its northern boundary which merges with the relevant dark brown area stretching into the centre of the occlusion.
The cloud structure of the Convergence Cloud is similar to that in the IR image.
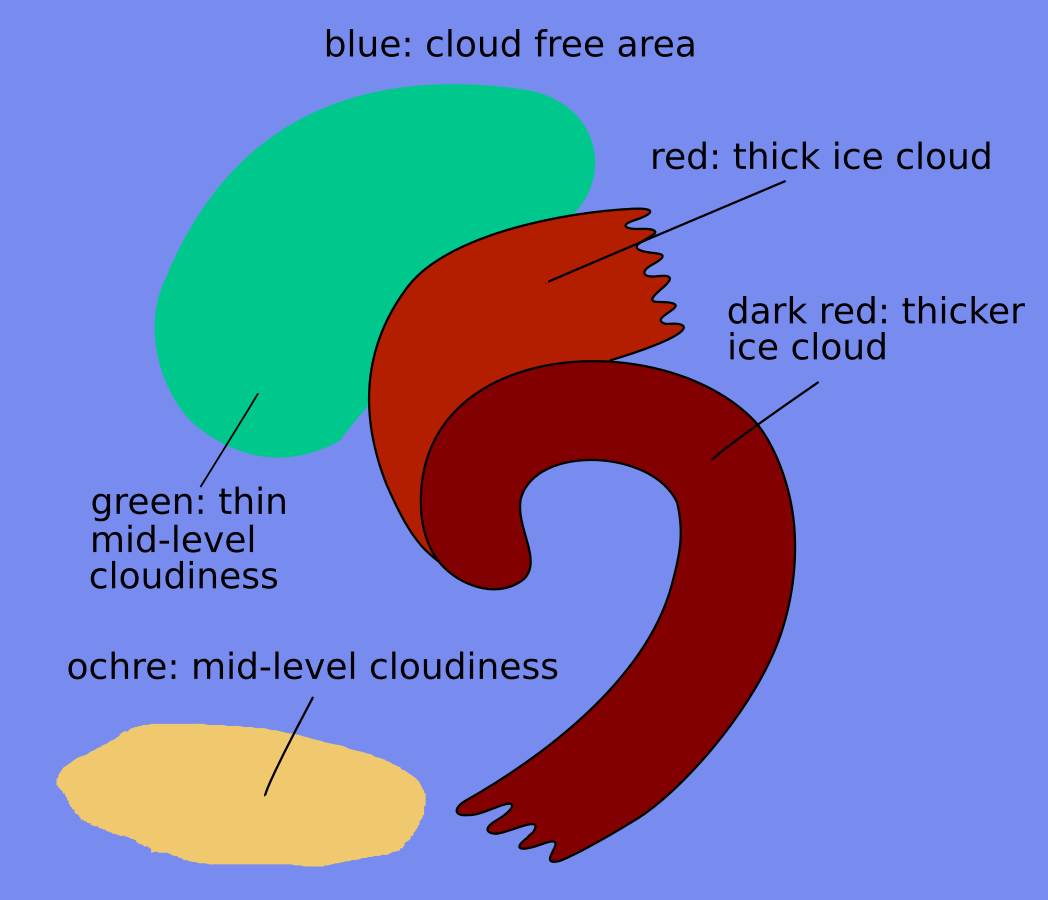
Dust RGB
The surroundings of the Convergence Cloud are light blue where there is a cloud free surface. As the development of the Convergence Cloud very often takes place in northern regions, large parts around the feature can be green, representing transparent mid-level cloudiness.
Convergence Cloud are either as a whole or at least in large parts made up of fibres of dark-red colour, representing thick ice cloud. If recognisable, there are ochre colours at the borders or between the thicker cloud fibres, representing thick mid-level clouds.
 |
 |
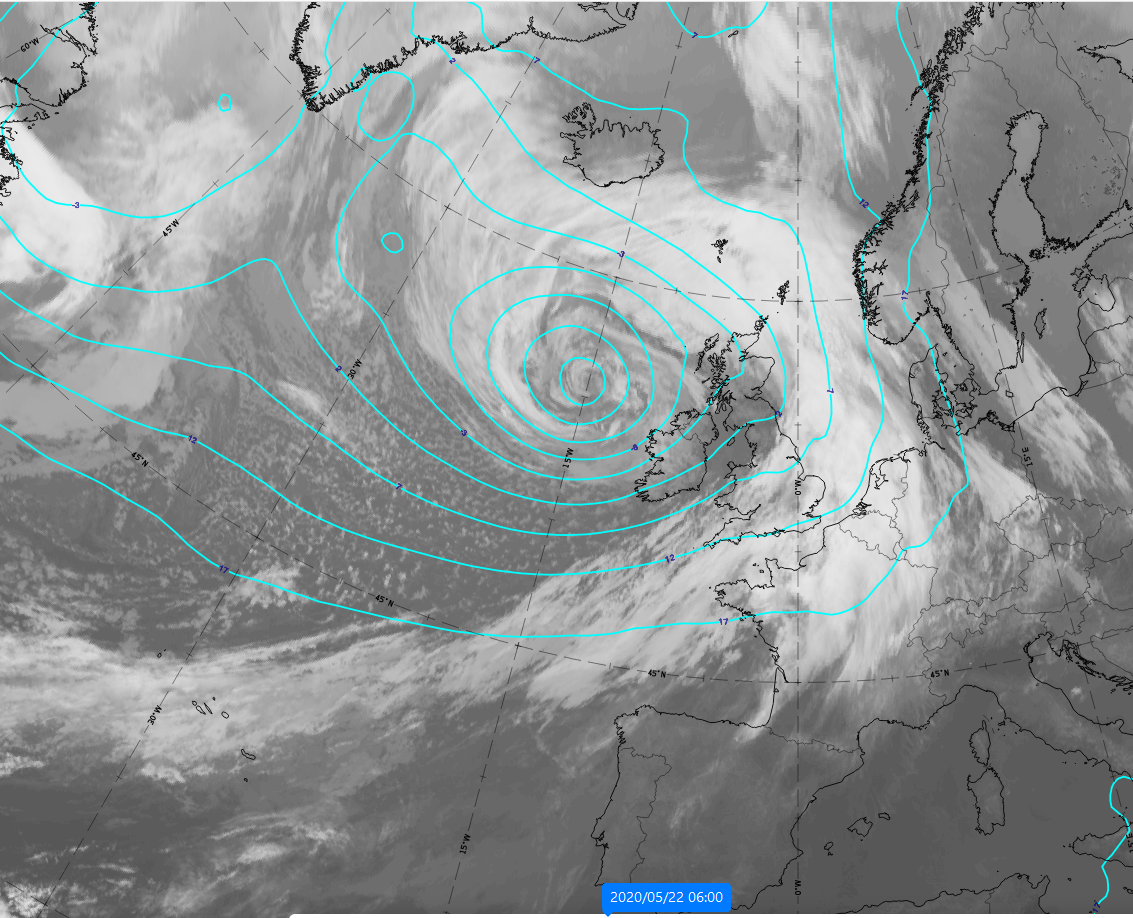
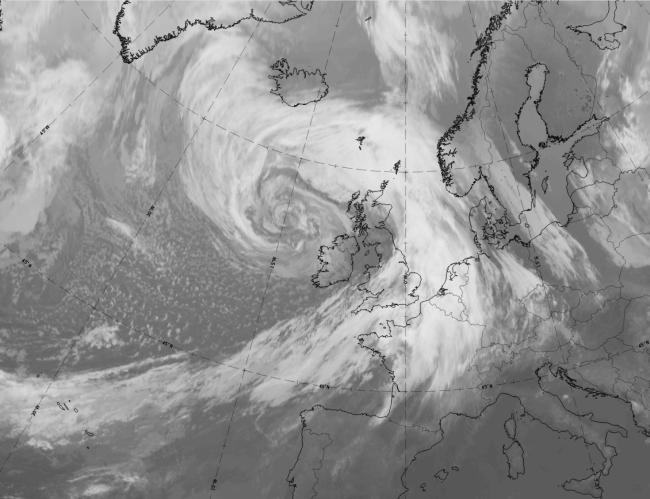
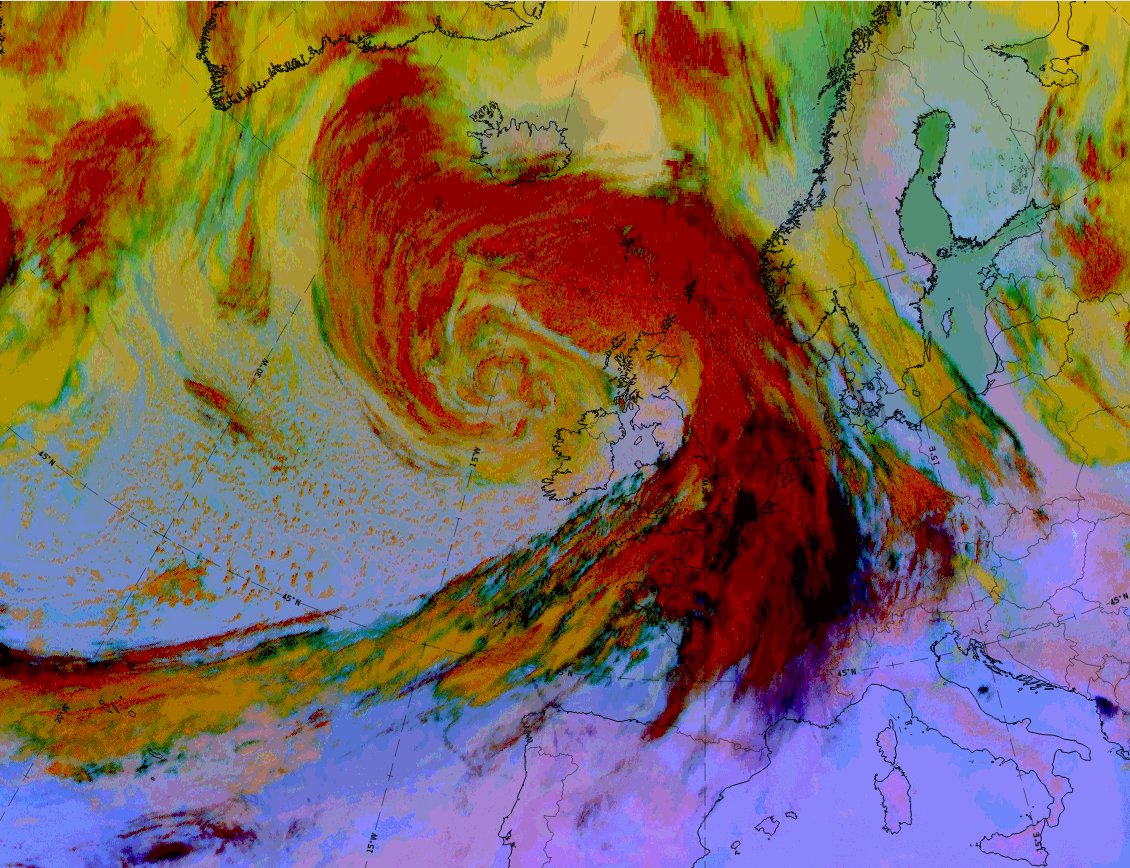
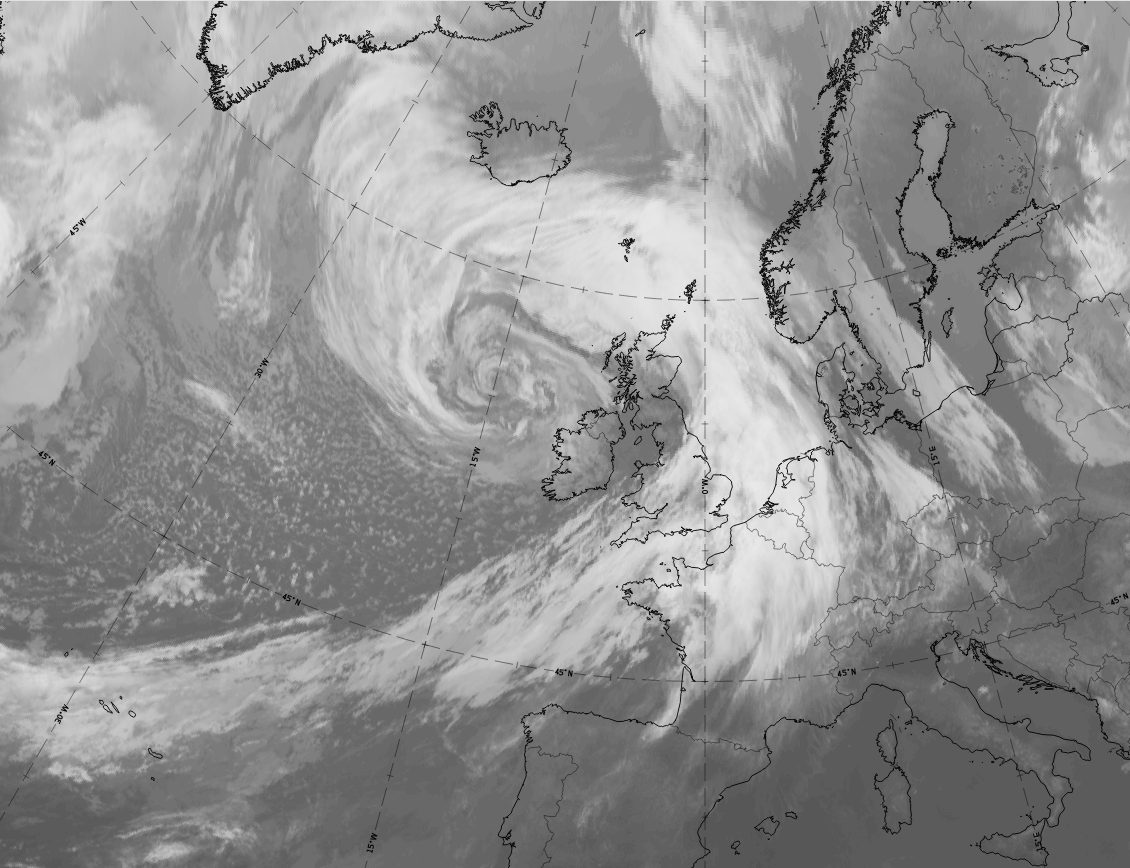
The case of 22 May 2020 shows at 06 UTC Convergence Clouds of type 1 (see the figure above). There is a highly developed low pressure centre to the west of Ireland with a corresponding occlusion spiral which extends from the Norwegian Sea between Iceland and Scotland, around the low. Parallel to this occlusion spiral extends the Convergence Clouds from the Atlantic between Greenland and Iceland southward, where it merges with the occlusion cloud band.
 |
 |
 |
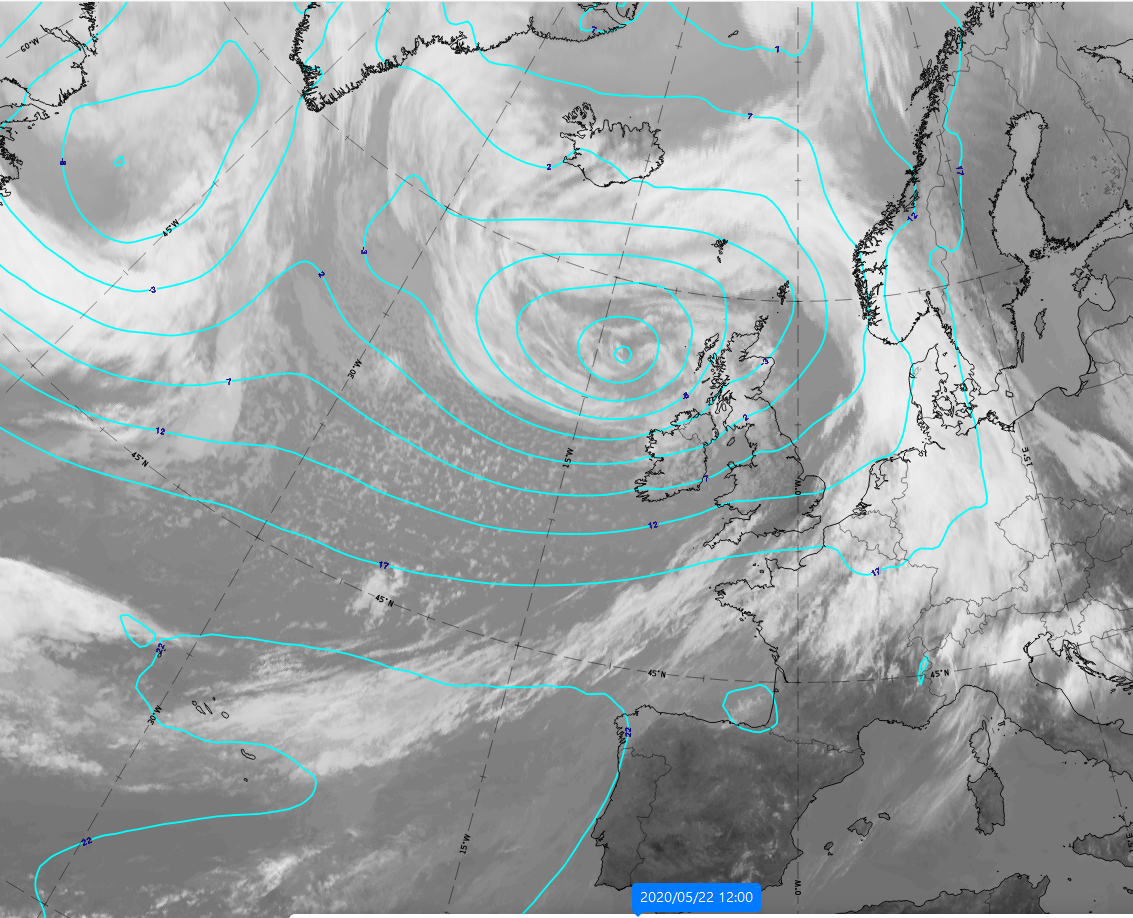 |
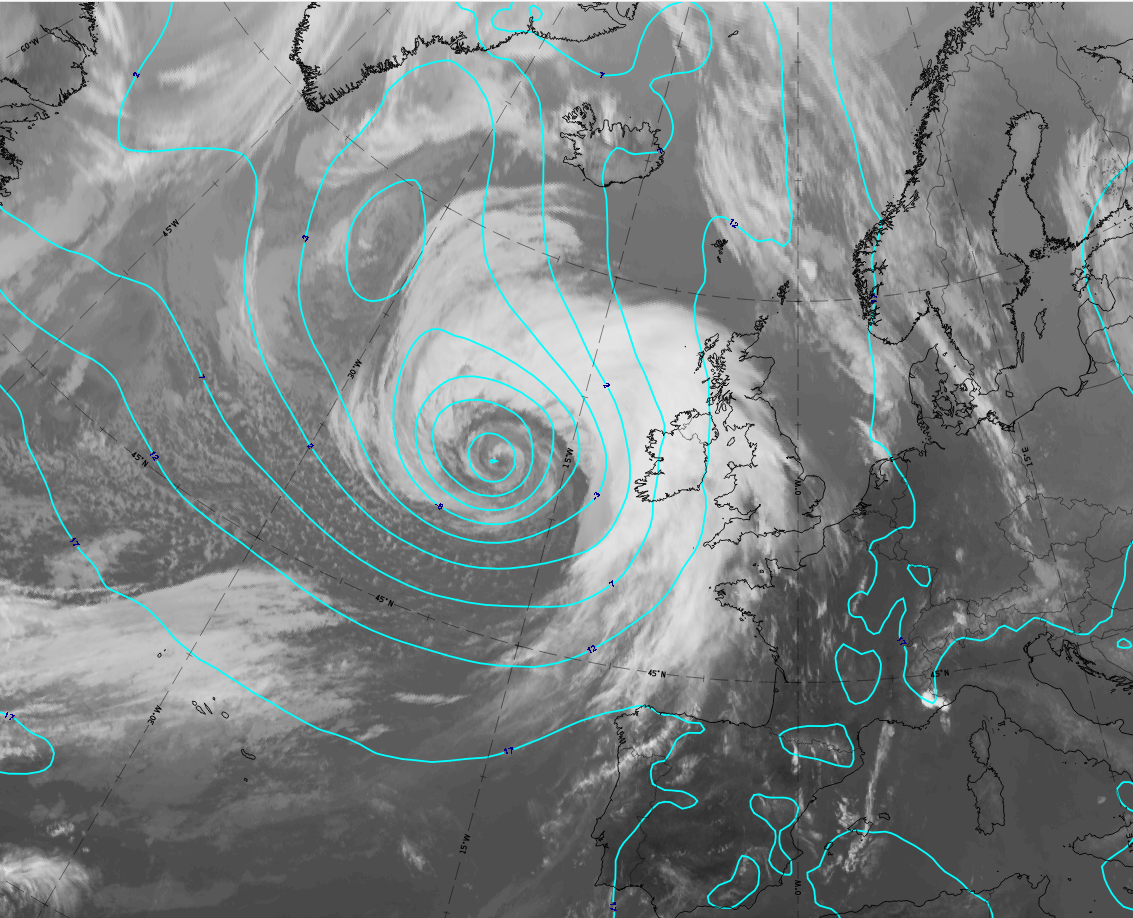
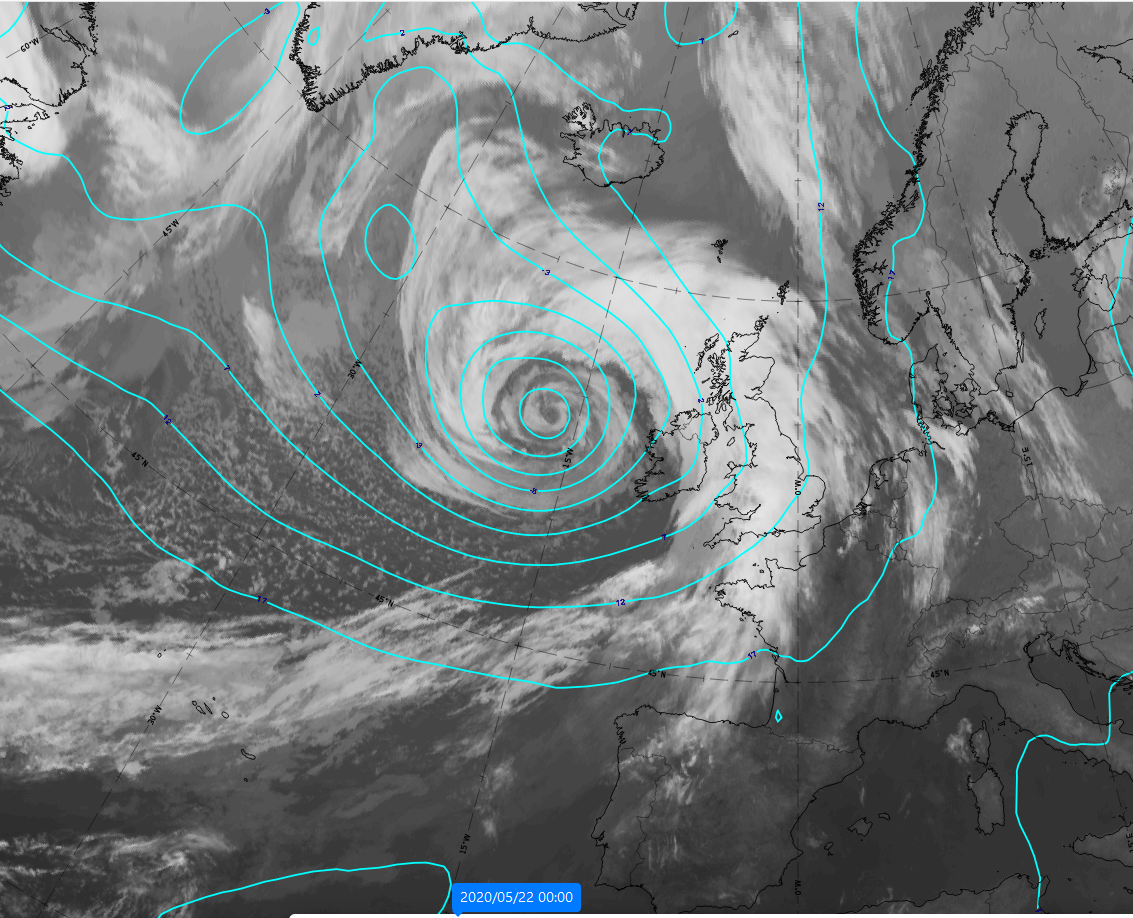
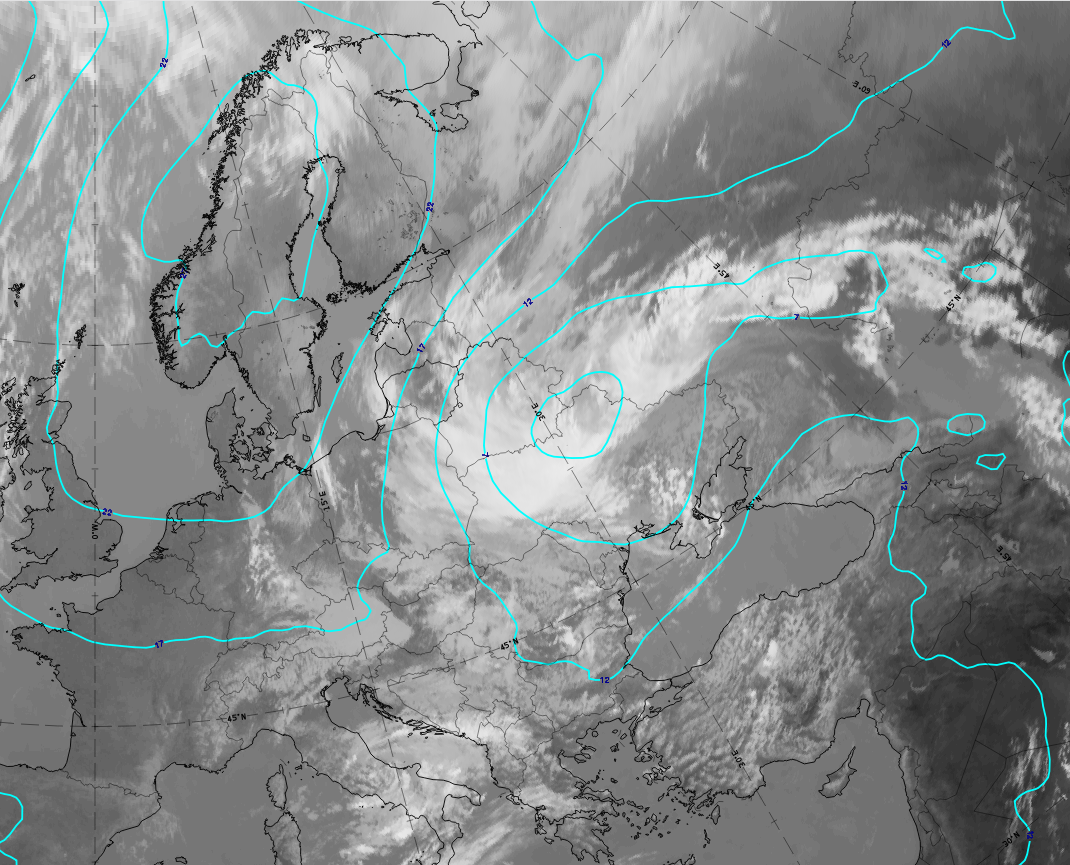
21-22 May 2020: 6- hourly sequence of Convergence Clouds. Type 1. IR. Cyan: Height contours 1000 hPa
u.l: 21 May at 18 UTC; u.r.: 22 May at 00 UTC; l.l: 22 May at 06 UTC; l.r.: 22 May at 12 UTC.*Note: click on the image to access the image gallery (navigate using arrows on keyboard)
The development of the Convergence Clouds is shown by an increase in the cloud fraction with a north-westward movement from the south of Ireland to southern tip of Greenland. In the first two images Convergence Clouds are clearly darker than the clouds of the occlusion spiral, indicating that warmer cloud tops exist there.
|
|
|
|
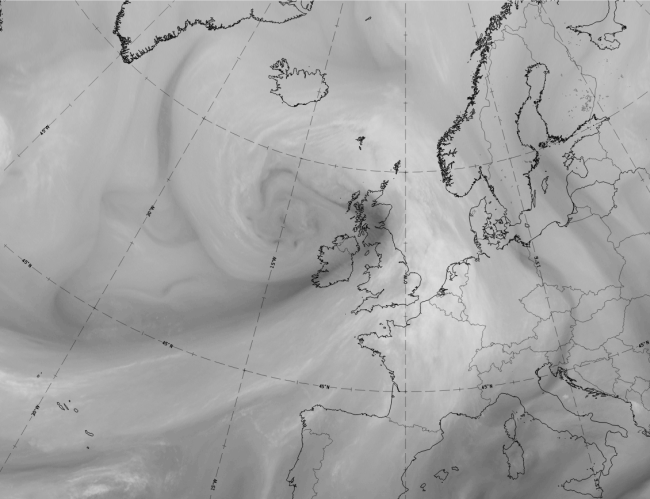
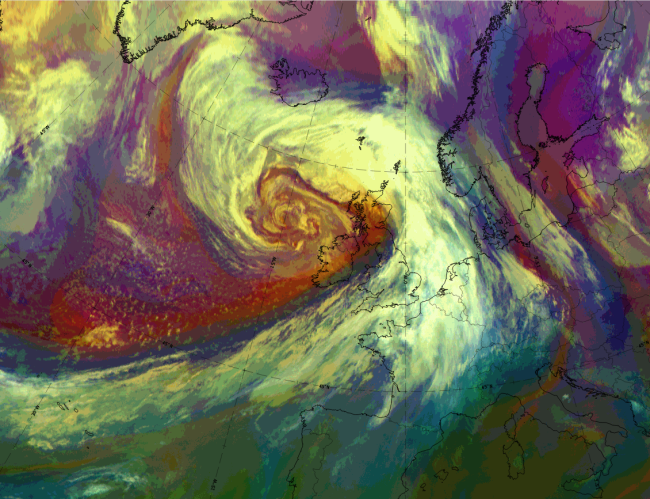
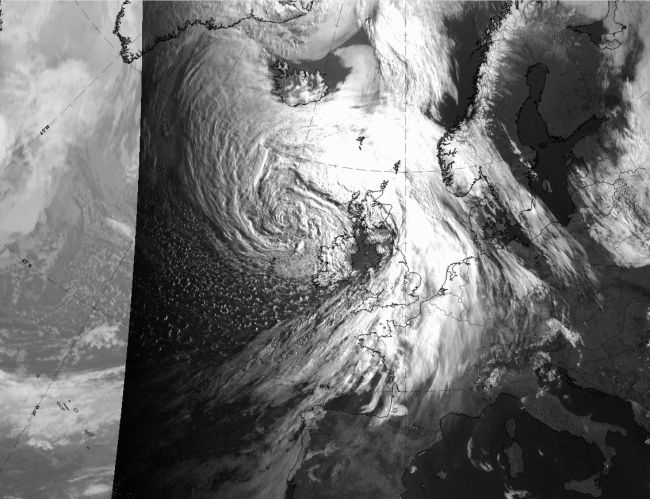
22 May 2020 at 06UTC: 1st row: IR (above) + HRV (below); 2nd row: WV (above) + Airmass RGB (below); 3rd row: Dust RGB + image gallery.
*Note: click on the image to access the image gallery (navigate using arrows on keyboard).
| OR | Mostly light grey and fibrous, representing cold cloud tops, however in many parts have lower values than in the occlusion spiral. |
| HRV | Light grey; because of the sun illumination angle at this time of the day, a comparison with the occlusion spiral is not useful. |
| WV | Light grey. |
| Airmass RGB | Mainly within the blue to dark-brown colours, representing cold and dry airmasses. The most important feature is the dark brown stripe at the rear (western side) of the Convergence Clouds merging with the dark brown area which reaches from the SW into the low centre. |
| Dust RGB | Dark red colours indicate thick ice clouds which do not differentiate much from the occlusion cloud spiral. In the southern latitudes, blue colours indicate the cloud free surface while in the more northern latitudes, ochre colours represent thin mid-level clouds surrounding the convergence and occlusion cloud bands. |
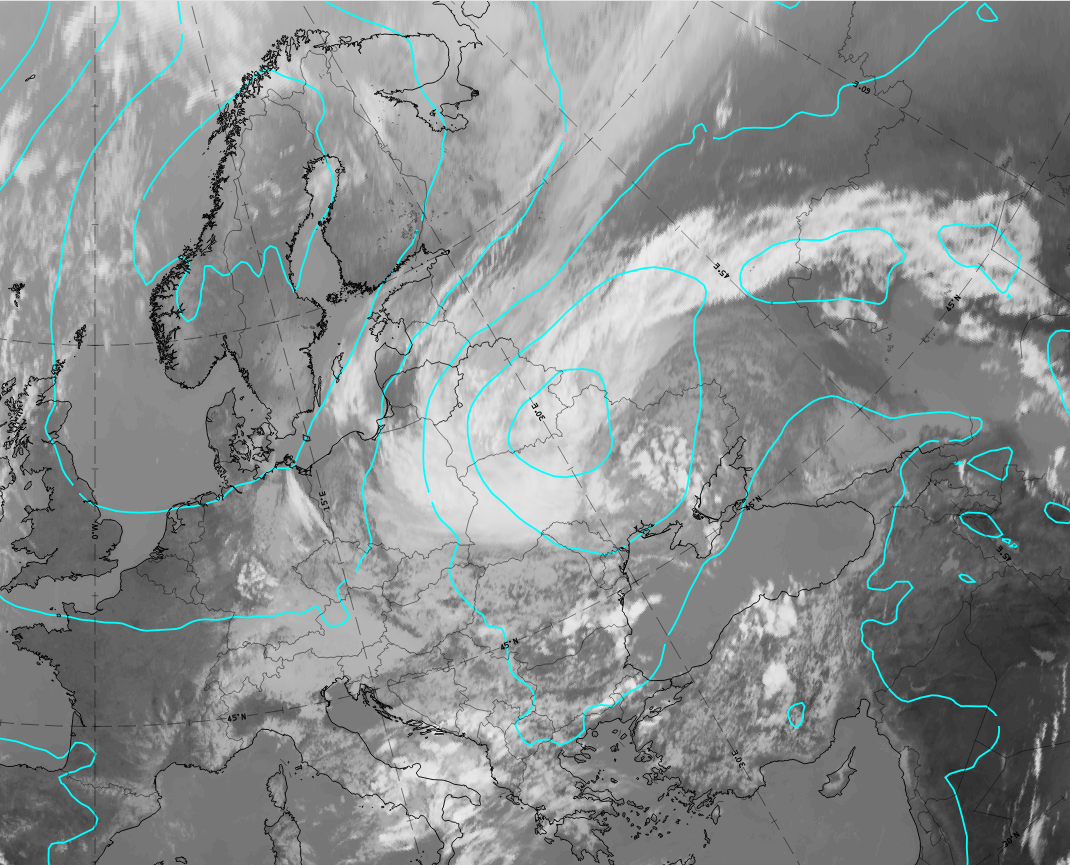
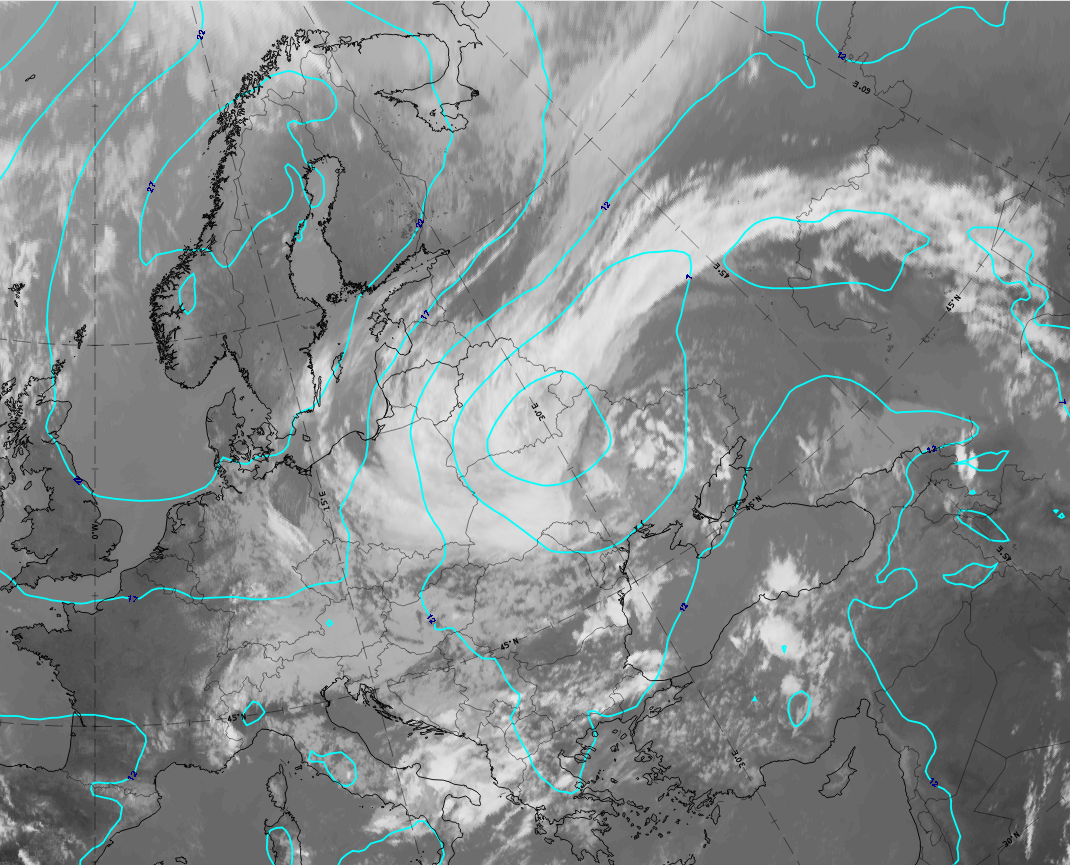
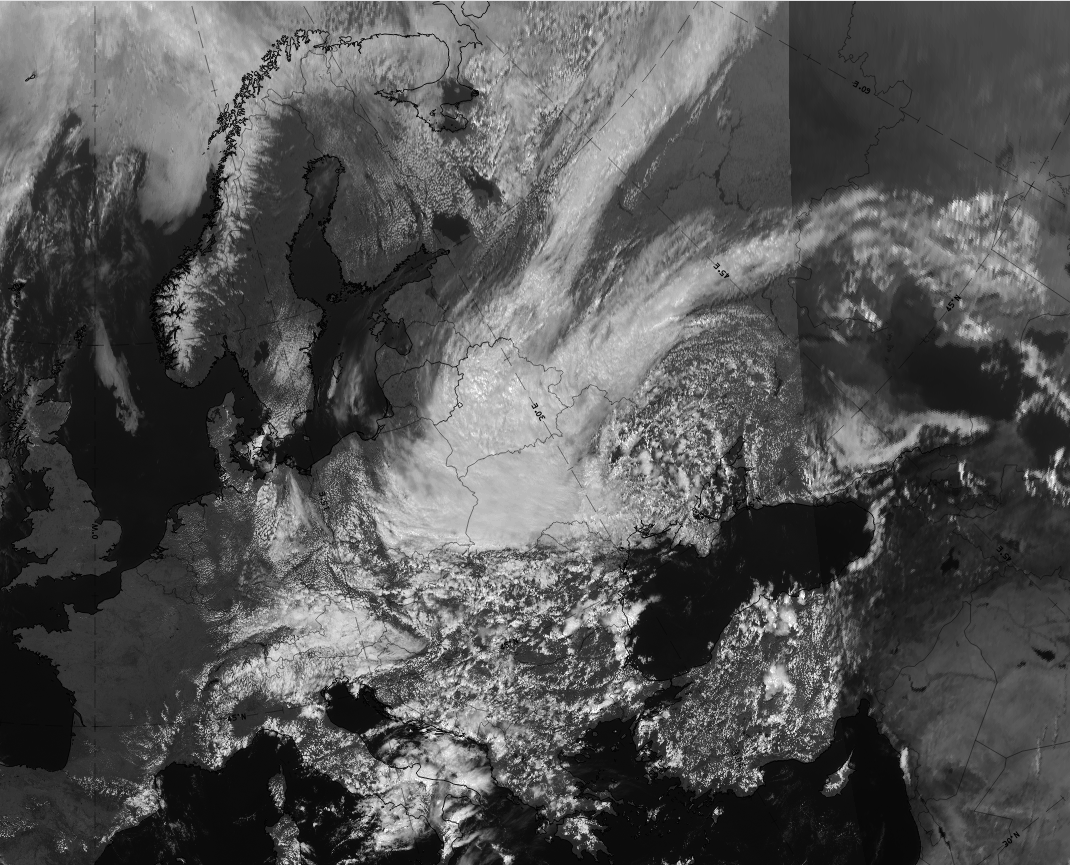
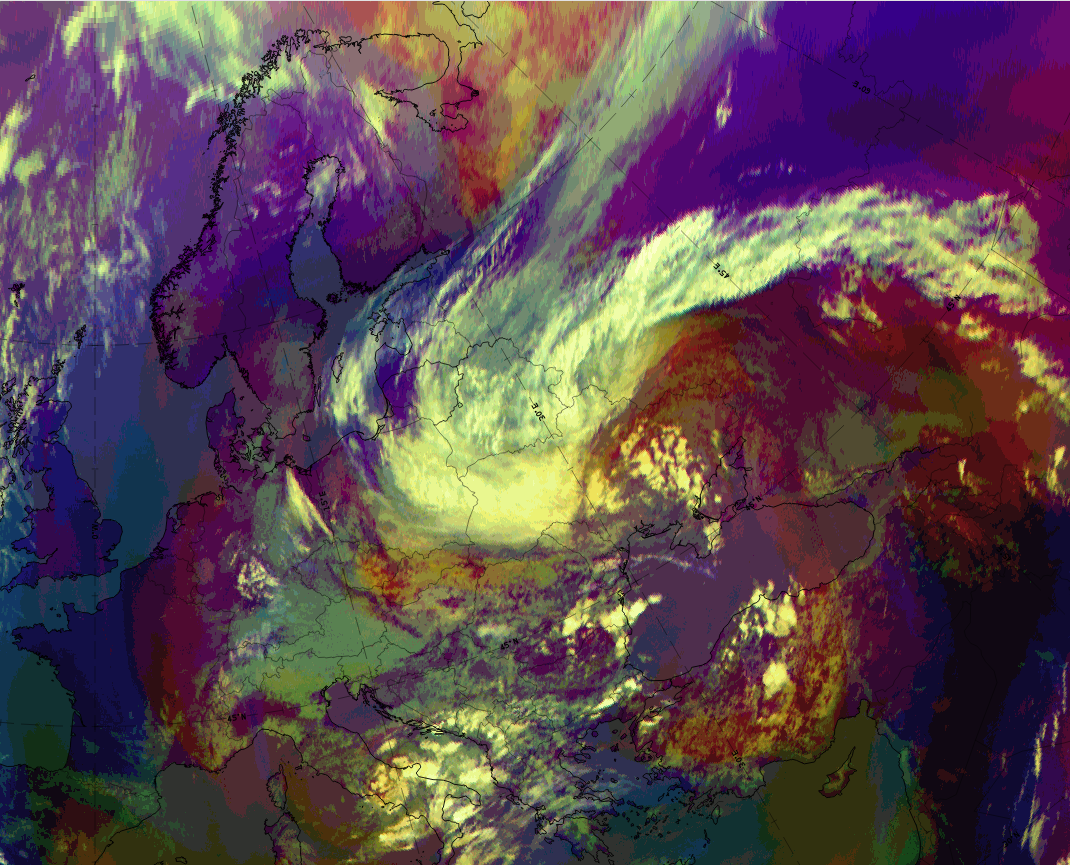
The case of 30 May 2020 at 12 UTC is an example of Convergence Clouds of type 2. On the one hand there is an occlusion spiral extending around a far developed low over North Ukraine and Belarus. On the other hand, there is a cold front cloud band extending from north Russia southward to Lithuania and Belarus. The Convergence Clouds develop in the transition area of both systems in the western part of the low pressure area.
 |
 |
 |
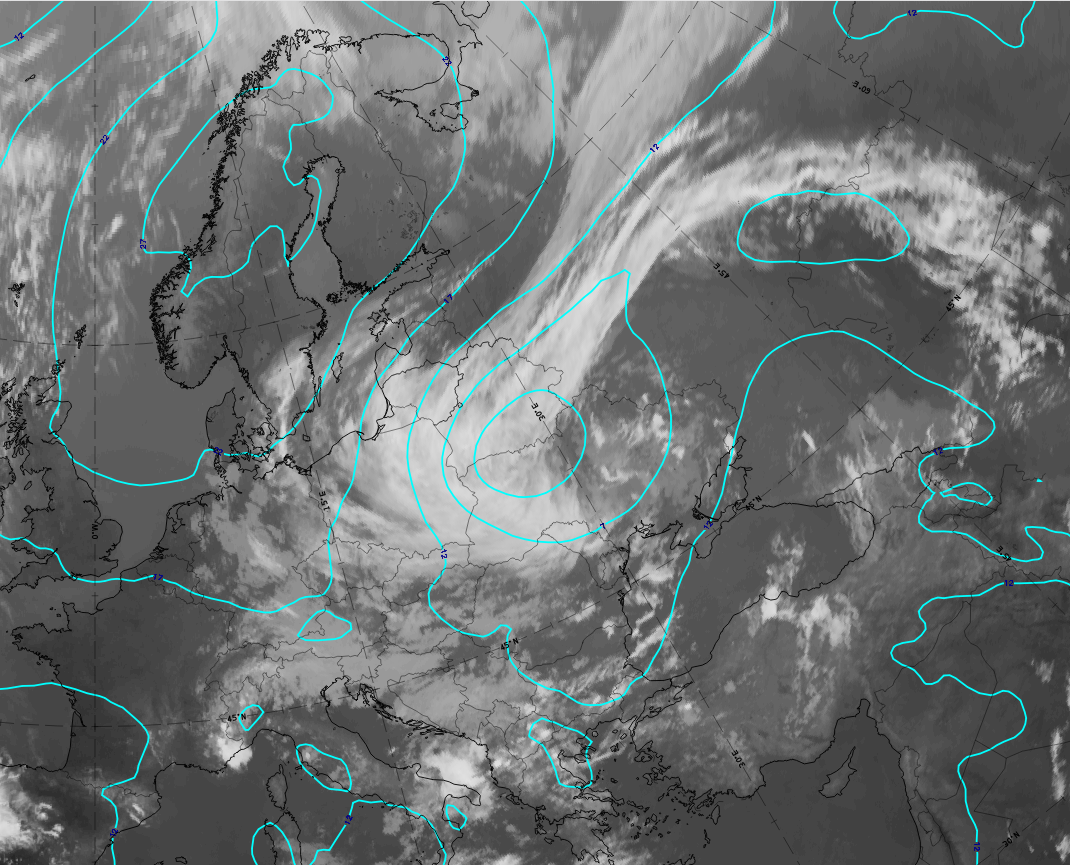 |
30 May 2020: 3- hourly sequence of Convergence Clouds Type 2. IR. Cyan: Height contours 1000 hPa
u.l: 30 May at 9 UTC; u.r.: 30 May at 12 UTC; l.l: 30 May at 15 UTC; l.r.: 30 May at 18 UTC.*Note: click on the image to access the image gallery (navigate using arrows on keyboard)
The Convergence Clouds develop at the western part of the merging area of both cloud bands, and extends south- and south-eastward. In this case, the Convergence Clouds appear as bright in the IR channel as the occlusion does, but it appears brighter than the cold front cloud band.
|
|

|
|
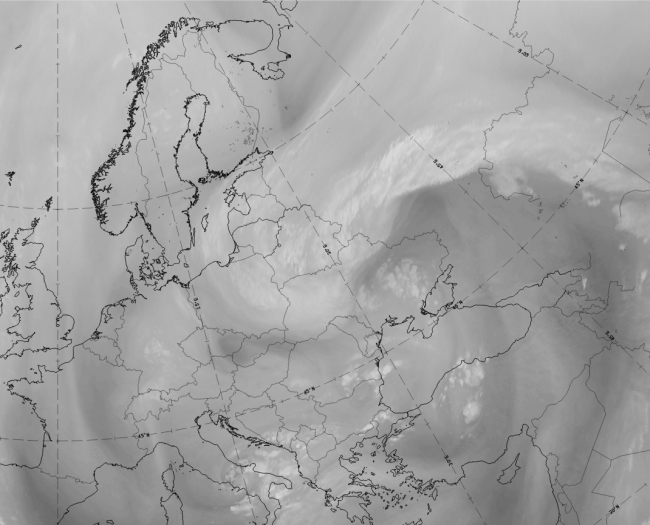

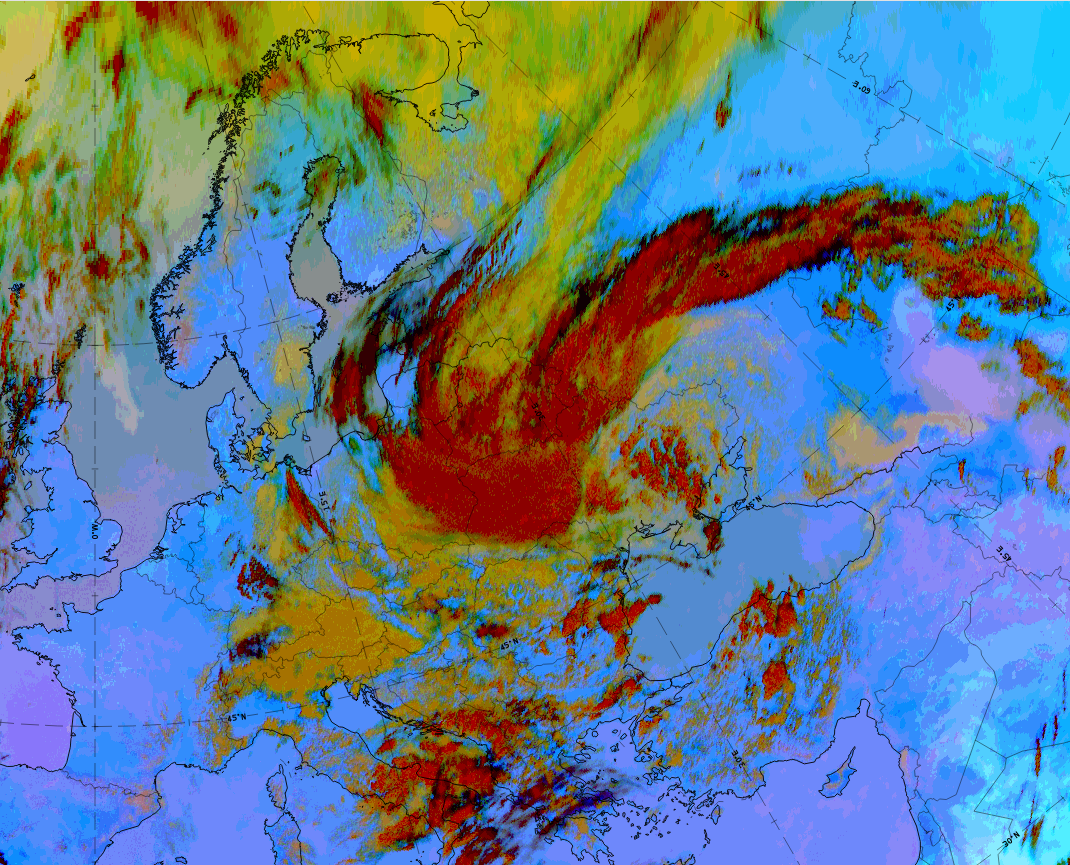
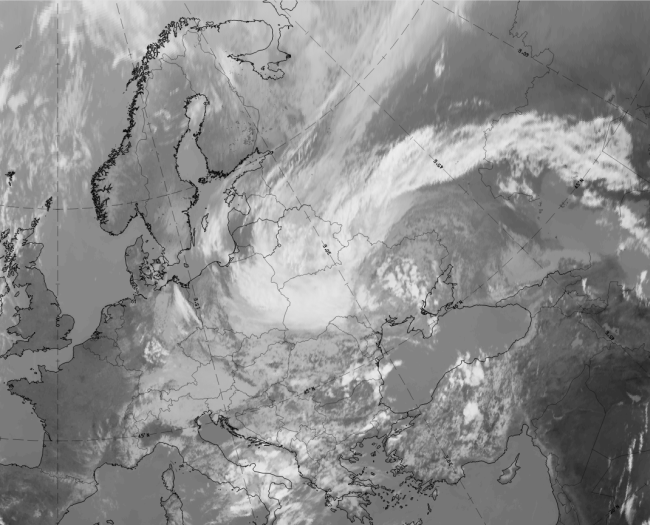
30 May 2020 at 12UTC: 1st row: IR (above) + HRV (below); 2nd row: WV (above) + Airmass RGB (below); 3rd row: Dust RGB + image gallery.
*Note: click on the image to access the image gallery (navigate using arrows on keyboard)
| IR | White and mainly dense. Representing the very cold cloud tops. |
| HRV | Light grey to white. Partly dense. Representing the thick clouds. |
| WV | White to light grey. Representing the clouds and the high water vapour content. |
| Airmass RGB | Located within the blue colours and partly surrounded by a dark brown stripe behind the cold front cloud band and at the southern border of the Convergence Clouds reaching into the low centre. |
| Dust RGB | Dark-red colours indicate thick ice cloud. |
| In the majority of cases, Convergence Clouds are less cold and more broken than the connected occlusion cloud band. In this case this scenario is not realised; on the contrary, the Convergence Clouds have equal or greater intensity than the occlusion cloud band. | |
Meteorological Physical Background
Different types of formation could be observed:
- North of an Occlusion another frontal system is passing by and a zone of confluence is developing
- Associated with Rapid Cyclogenesis (or Cold Conveyor Belt Occlusion): double structure at cloud spiral becoming detached
First Type
|
|
|
12 December 2003/00.00 UTC - Meteosat IR image
|
15 January 2009/00.00 UTC - Meteosat 9 IR 10.8 image and surface wind vectors
|
|
|
When looking at wind fields, both confluence and convergence where studied. Confluence is seen directly from the wind vectors when the direction of two neighbouring vectors are orientated towards each other, e.g. two air flows are coming together. On the other side convergence as a numerical parameter takes wind direction (confluence) as well as wind speed into account (see Basic chapter - Divergence for more details). In some cases where confluence can be observed, no convergence is found. In this study the contribution of confluence seems to be very important.
The Convergence Cloud develops in area of confluence of a stream from the north and a stream from the south where the confluence can seen best near the surface. The southerly flow is caused by the rotation of the Occlusion round the surface depression whereas the northerly results from the other system passing by. As a result of these two wind regimes interaction convergence is seen near the surface. A secondary convergence maximum is situated at higher levels, varying from case to case, both in level and in intensity. The relationship of cloud top height with convergence was investigated. It was found that Convergence Cloudiness shows as higher cloudiness if there is a thick layer of upper tropospheric convergence OR if the convergence in low levels is very distinct. Both convergence maxima conribute to the development of cloudiness.
Second Type
|
|
|
|
20 December 2008/06.00 UTC - Meteosat 9 IR10.8 image
|
20 December 2008/18.00 UTC - Meteosat 9 IR10.8 image
|
|
|
The Convergence Cloudiness develops in an area of confluence of the stream from the north and the stream from the south. Deformation, as well as vorticity associated with Occlusion, can clearly be seen. Convergence is found from the surface up to 700 hPa.
|
20 December 2008/18.00 UTC - Meteosat 9 IR10.8 image; magenta: wind (blue) and isotachs (red) 1000 hPa
|
20 December 2008/18.00 UTC - Meteosat 9 IR10.8 image; cyan: wind 850 hPa
|
|
|
|
|
|
20 December 2008/18.00 UTC - Meteosat 9 IR10.8 image; magenta: wind 500 hPa
|
|
For a different case the relative streams were investigated. It was found that the area of Convergence Cloudiness shows a significantly slower system velocity than the whole Occlusion. This can be interpreted as an indication that the convergence cloudiness can be regarded as a separate system in calculating relative streams. If only the convergence cloudiness is taken into account, the relative streams show following pattern in the majority of cases:
- The Convergence Cloud has a different velocity which is an indication that it should be treated as a separate CM. In most cases the displacement is less than that of the whole cloud spiral
- In the majority of cases an isolated cyclonic circulation could be found
- This circulation is more pronounced at upper levels
- The convergence cloudiness lies within (slight) upward motion
|
|
19 March 2004/12.00 UTC - Meteosat IR image; magenta: relative streams 298K, yellow: isobars 298K
|
|
|
|
|
|
06 February 2004/12.00 UTC - Meteosat IR image; magenta: relative streams 294K, yellow: isobars 294K
|
06 February 2004/06.00 UTC - Meteosat IR image; magenta: relative streams 298K, yellow: isobars 298K
|
Some cases do not show this pattern - then the convergence cloudiness lies within the upward (cyclonic) motion of the Occlusion stream lines.
|
10 February 2004/12.00 UTC - Meteosat IR image; magenta: relative streams 284K, yellow: isobars 284K
|
10 February 2004/12.00 UTC - Meteosat IR image; magenta: relative streams 288K, yellow: isobars 288K
|
|
|
The above mentioned findings are valid if the Convergence Cloudiness is treated separately. If the Occlusion cloud spiral or even the whole frontal system is used to calculate relative streams, this pattern vanishes. Upward motion can still be seen but there is no separate circulation.
Is Convergence Cloudiness a special type of Warm Front?
Indeed, there are many common features between Warm Fronts and this type of Convergence Cloudiness, as seen in numerical parameter fields and satellite imagery. The main difference is the formation: According to the polar front theory a baroclinic zone at the transition between warmer and colder air masses forms a Wave which then leads to cyclogenesis. The Occlusion develops after the Warm Front. In the case of the Convergence Cloudiness the Occlusion cloud spiral is already well developed and then the convergence shield forms.
Open questions
It is not possible to forecast whether Convergence Cloudiness will develop at the end of an Occlusion spiral or not. There are some indications that it occurs when another system passes nearby, but the processes are not yet fully understood.
Key Parameters
- Convergence, especially in low levels
- Confluent wind vectors, confluence more pronounced than convergence
- Wind vectors: in lower and middle levels different wind regime between Occlusion and Convergence Cloudiness; at higher levels, no noticeable difference
- Often within weak WA
- TFP shows small, but positive values
- Cloud bands connected to the Occlusion tend to be located within a thickness ridge which is less pronounced than with standard Occlusions
|
|
20 December 2008/18.00 UTC - Meteosat 9 IR10.8 image; red: temperature advection 700 hPa, blue: TFP, green: equivalent thickness
|

|

|
|
|
20 December 2008/18.00 UTC - Meteosat 9 IR10.8 image; red: divergence 850 hPa, blue: divergence 700 hPa
|

|

|
Typical Appearance In Vertical Cross Sections
- Isentropes are inclined, but less pronounced than for fronts; sometimes there is a double structure (frontal character at the surface and above)
- Often within weak WA
- Convergence in lower levels, sometimes in upper levels, but there are big differences from case to case
- Isotachs show a low level minimum at the transition between the Occlusion and Convergence Cloudiness
|
|
20 December 2008/18.00 UTC - Vertical cross section; black: isentropes (ThetaE), red thick: temperature advection - WA, red thin:
temperature advection - CA, orange thin: IR pixel values, orange thick: WV pixel values
|
|
|
|
|
20 December 2008/18.00 UTC - Vertical cross section; black: isentropes (ThetaE), magenta thick: convergence, magenta thin:
divergence, orange thin: IR pixel values, orange thick: WV pixel values
|
|
|
Weather Events
The Convergence Cloudiness CM represents a quasi-frontal situation, in effect, attached to the end of an occlusion. Therefore weather events are frontal in character.
| Parameter | Description |
| Precipitation |
|
| Temperature |
|
| Wind (incl. gusts) |
|
| Other relevant information | None |
As the first case of 22 May 2020 represents type1, but unfortunately it exists completely over the ocean. The second case of 30 May 2020 represents type 2 and is chosen for demonstrating the weather typically associated with Convergence Clouds features.
|
|
Legend:
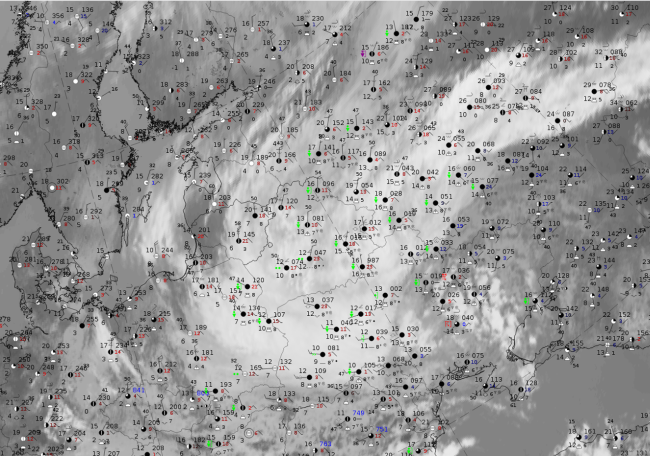
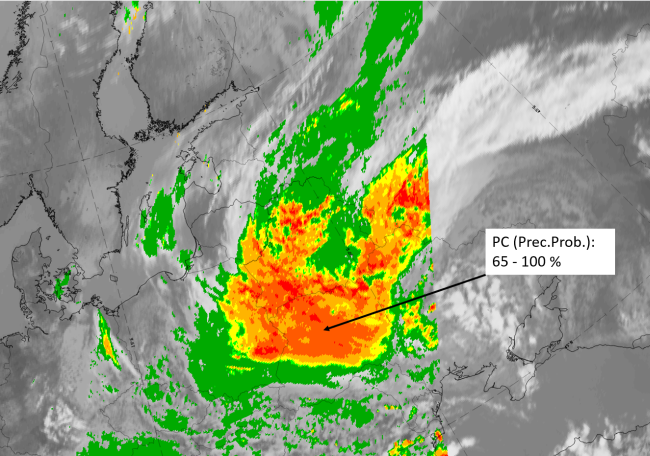
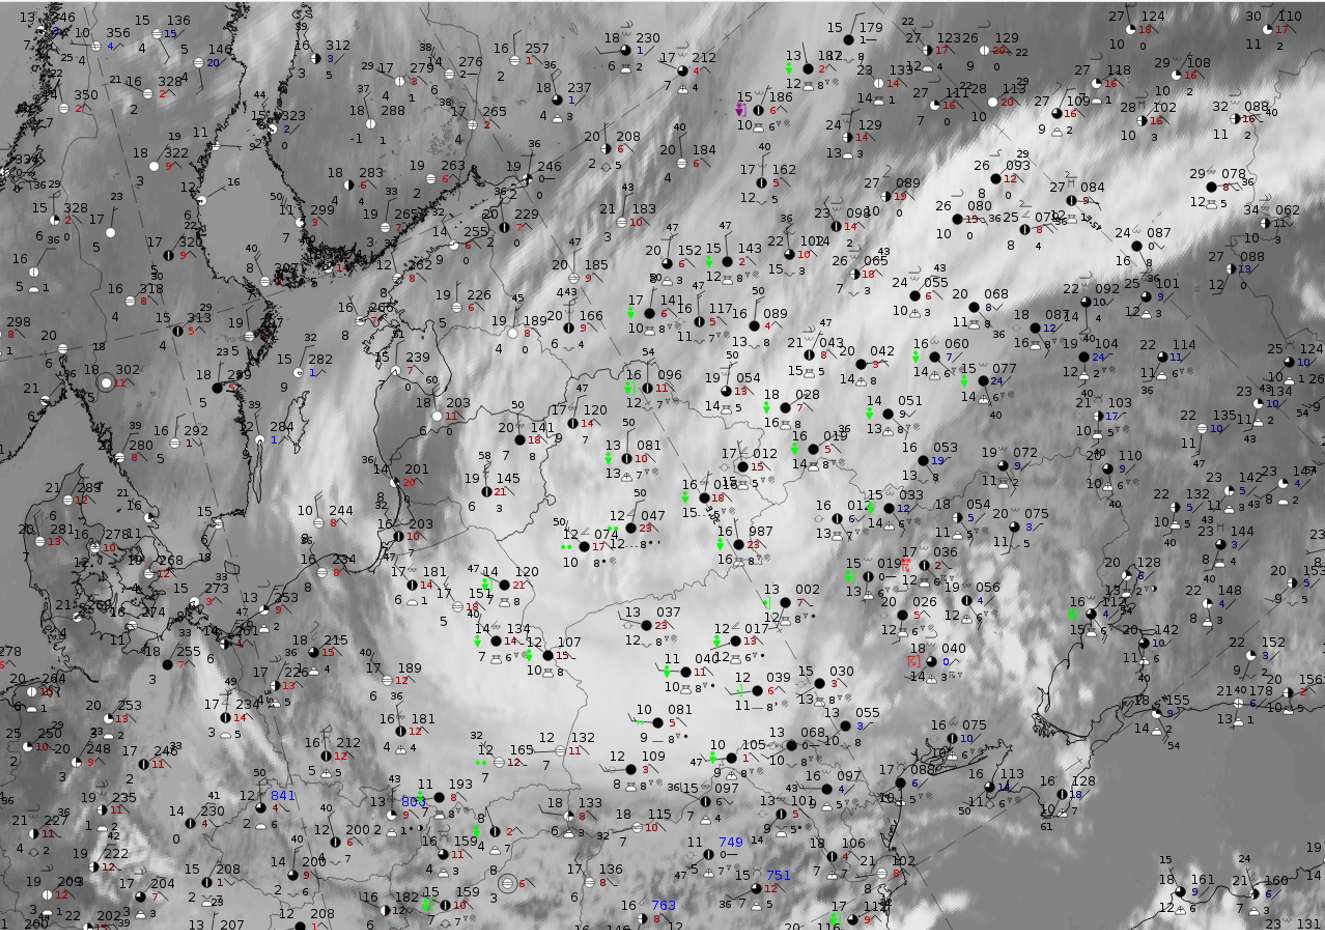
30 May 2020 at 12UTC: IR + synoptic measurements (above) + probability of moderate rain (Precipitting clouds PC - NWCSAF).
Note: for a larger SYNOP image click this link.
In all three cloud systems there are wide spread precipitation reports and most of them are in shower form. This is in agreement with the observation that Convergence Clouds are active in respect to precipitation, but contradicts the statement that convective observations are rather unlikely. These observations are further supported by the high probabilities in the NWCSAF PC parameter (precipitating clouds) which indicates that precipitation not in shower form. The region of convergence clouds shows up clearly with very high (up to 100%) probabilities of rain.
|
|
|
|
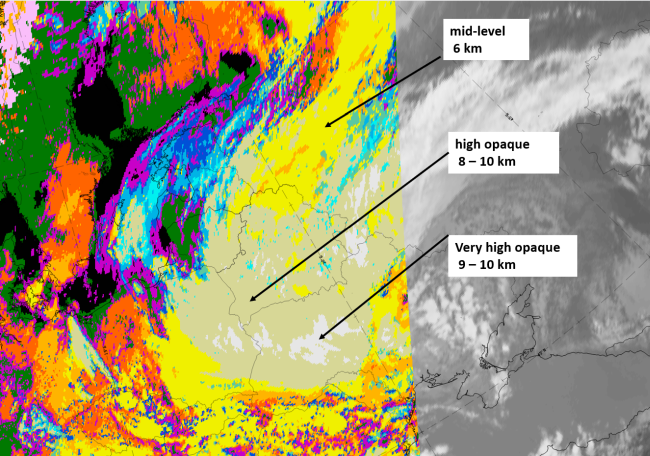
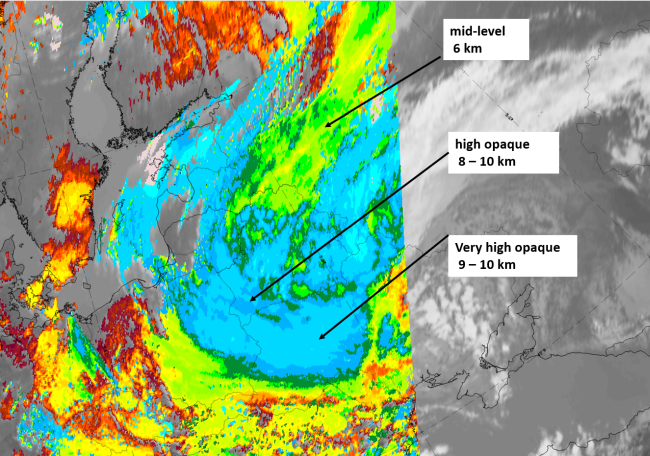
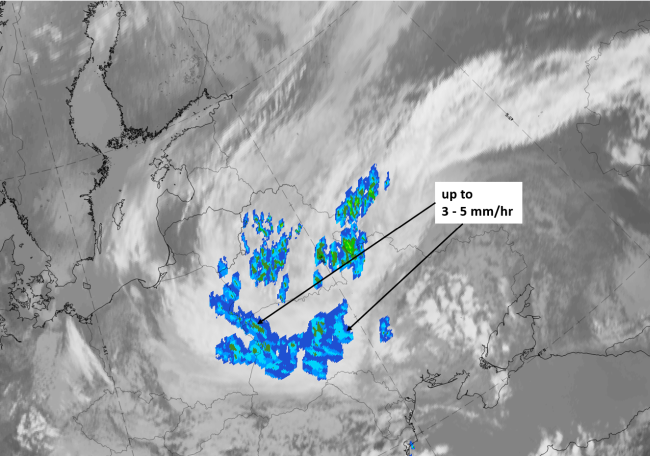
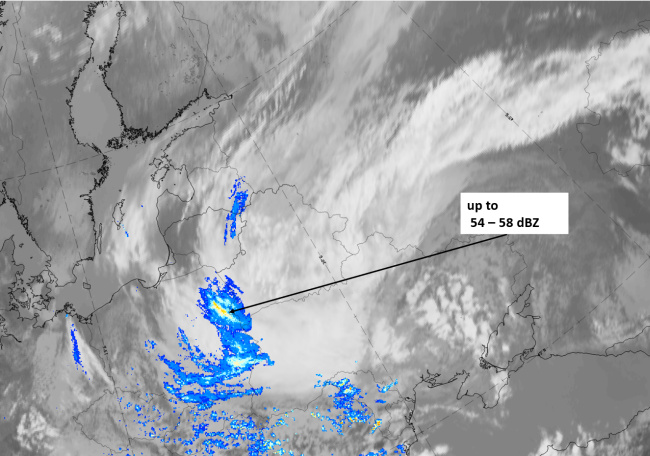
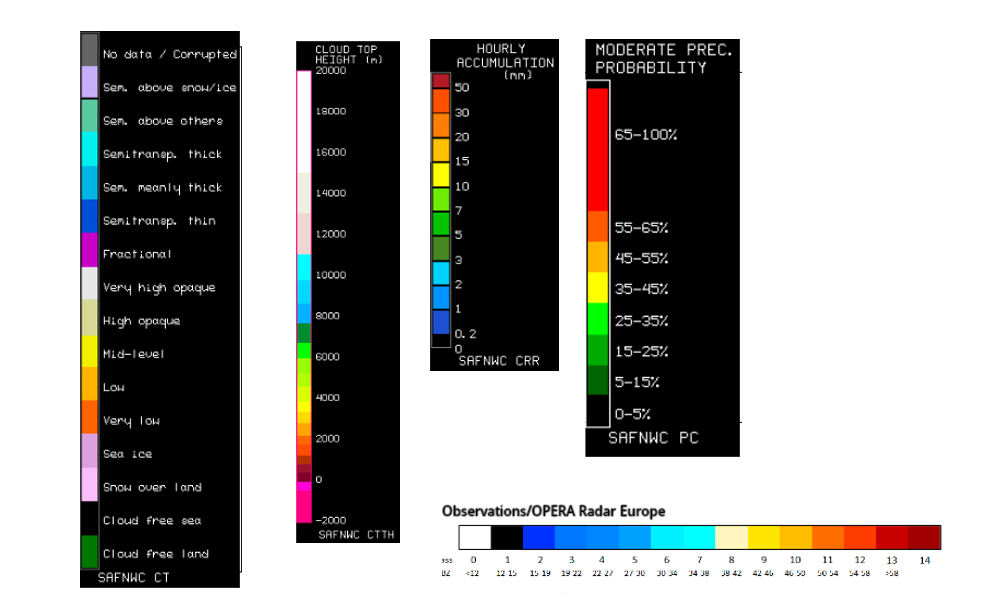
Legend:
30 May 2020 at 12 UTC, IR; with the following fields superimposed:
1st row: Cloud Type (CT NWCSAF) (above) + Cloud Top Height (CTTH - NWCSAF) (below); 2nd row: Convective Rainfall Rate (CRR NWCSAF) (above) + Radar intensities from Opera radar system (below).
For identifying values for Cloud type (CT), Cloud type height (CTTH), precipitating clouds (PC), and Opera radar for any pixel in the images look into the legends. (link)