Cloud Structure In Satellite Images
According to the schematic below, Convergence Cloud can be seen during the far developed occlusion stage as a separate, curved cloud band which spirals approximately parallel to the occlusion spiral, from the Northeast to the end of the occlusion spiral. With a short inspection it could be classified as the remnants of a warm front cloud band but when taking into account the development process it becomes clearly different. It develops not together with the occlusion but develops later instead. This is discussed in the chapter: "Meteorological-physical background".
There are two scenarios which can be differentiated in the two schematics below.
 |
 |
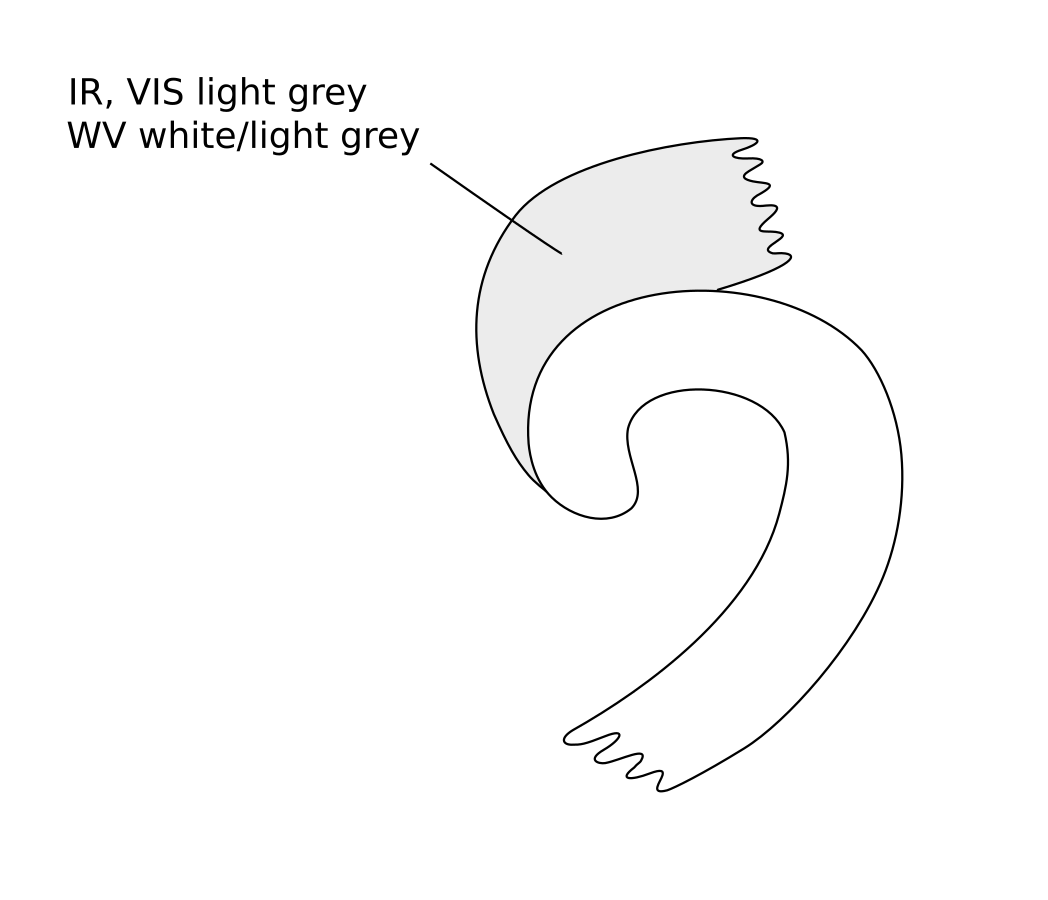
Appearance in the basic channels:
For both types:
- IR10.8: often a little bit warmer cloud-top temperatures than those associated with the occlusion cloud, therefore they appear light grey in the IR image, and are sometimes fibrous and broken
- VIS0.8: light grey
- WV6.2: varying from very bright to light grey
Appearance in the basic RGBs:
For both types:
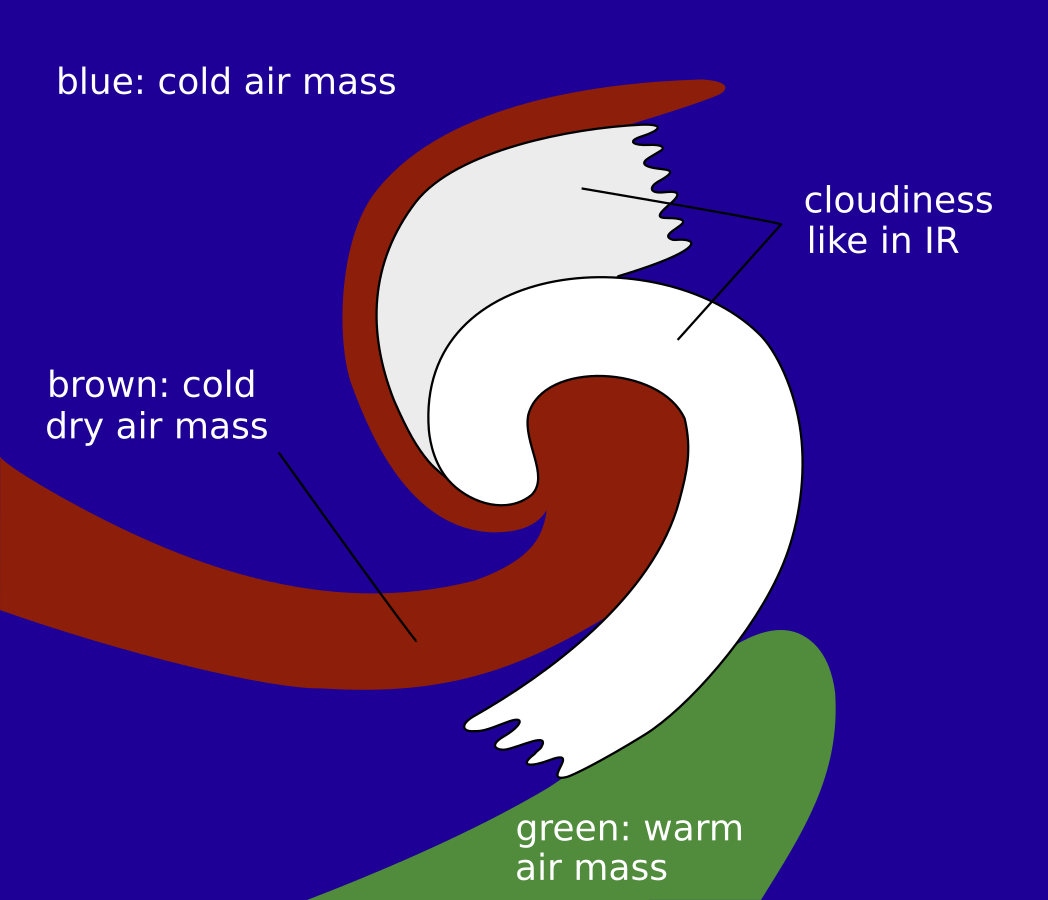
Airmass RGB
The Convergence Cloud develops within the cold airmass and is therefore surrounded by blue colours, however in most cases there is a dark brown stripe at its northern boundary which merges with the relevant dark brown area stretching into the centre of the occlusion.
The cloud structure of the Convergence Cloud is similar to that in the IR image.
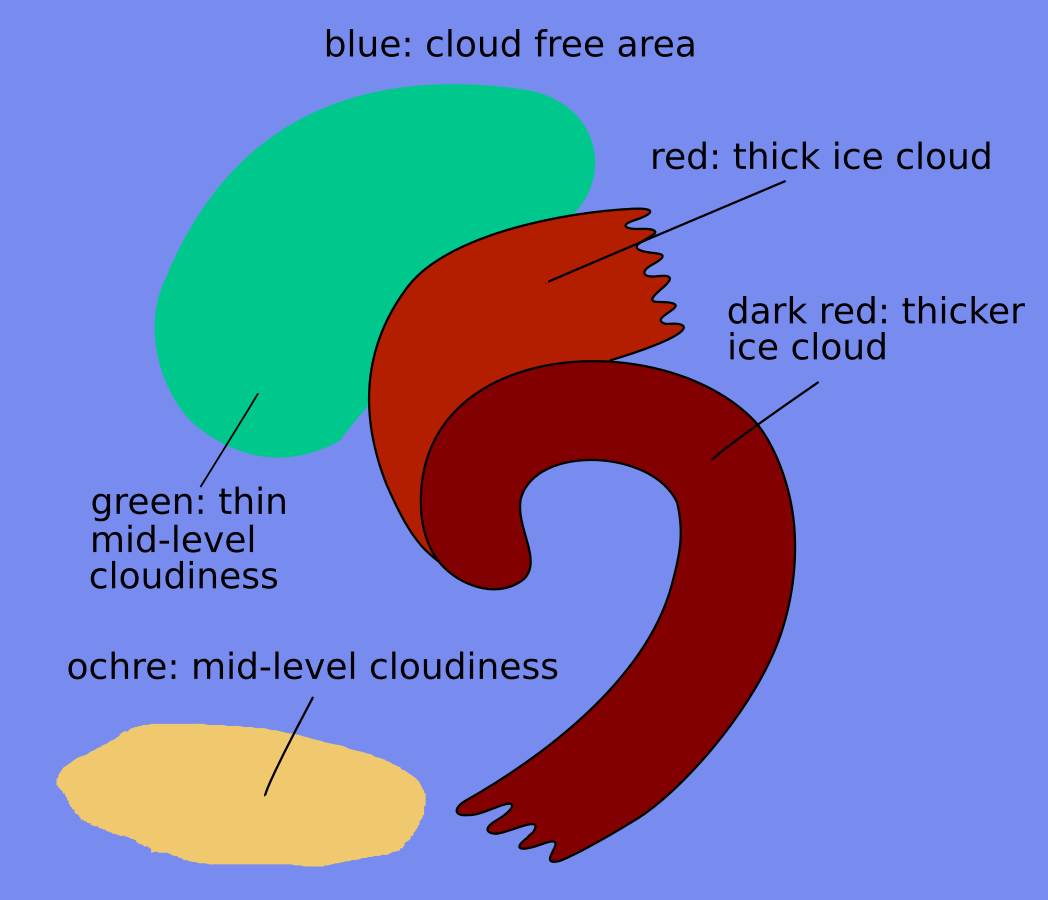
Dust RGB
The surroundings of the Convergence Cloud are light blue where there is a cloud free surface. As the development of the Convergence Cloud very often takes place in northern regions, large parts around the feature can be green, representing transparent mid-level cloudiness.
Convergence Cloud are either as a whole or at least in large parts made up of fibres of dark-red colour, representing thick ice cloud. If recognisable, there are ochre colours at the borders or between the thicker cloud fibres, representing thick mid-level clouds.
 |
 |
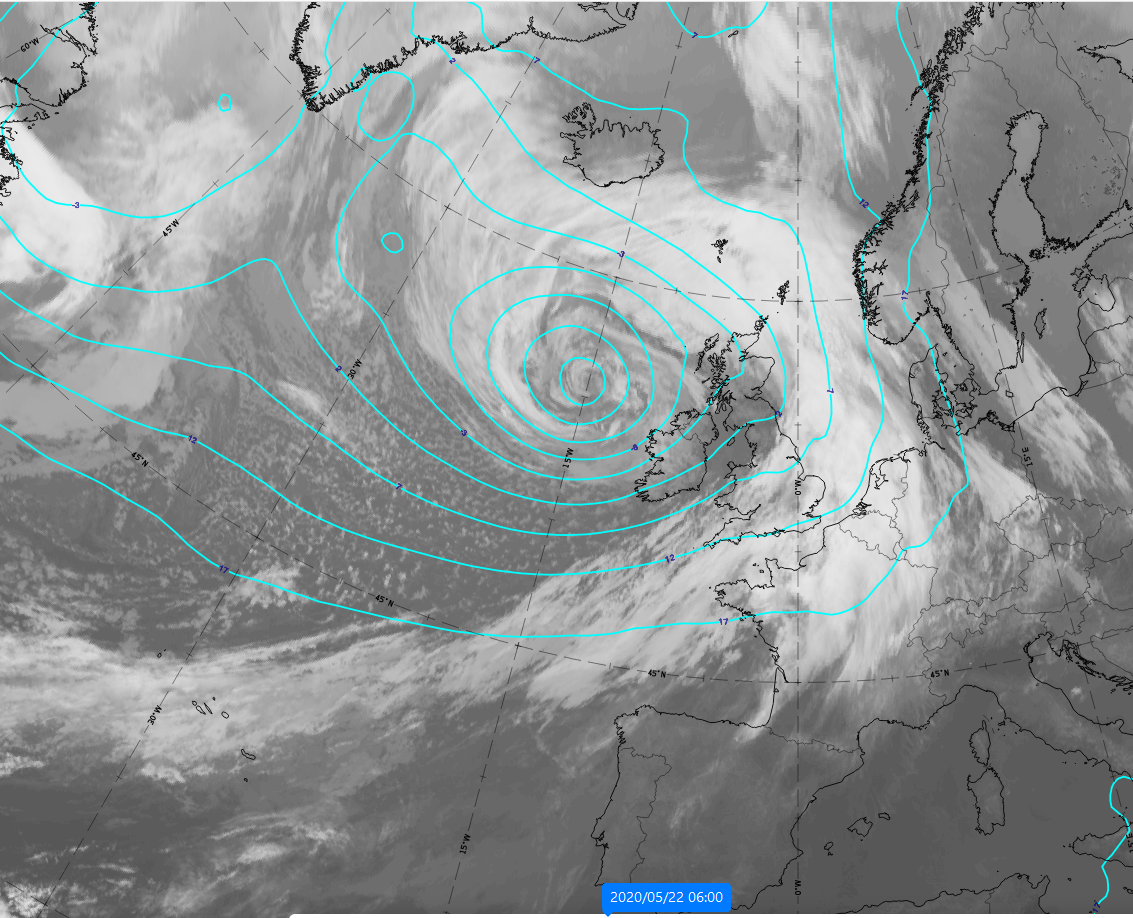
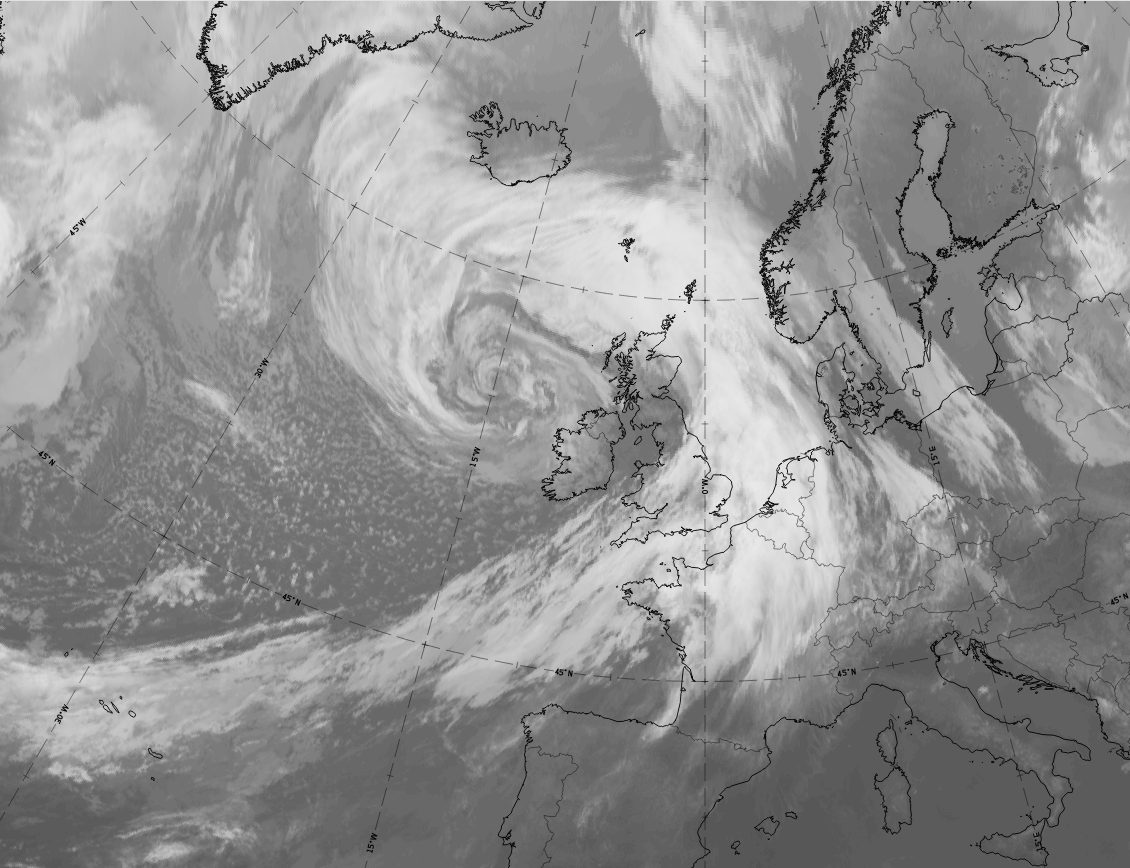
The case of 22 May 2020 shows at 06 UTC Convergence Clouds of type 1 (see the figure above). There is a highly developed low pressure centre to the west of Ireland with a corresponding occlusion spiral which extends from the Norwegian Sea between Iceland and Scotland, around the low. Parallel to this occlusion spiral extends the Convergence Clouds from the Atlantic between Greenland and Iceland southward, where it merges with the occlusion cloud band.
 |
 |
 |
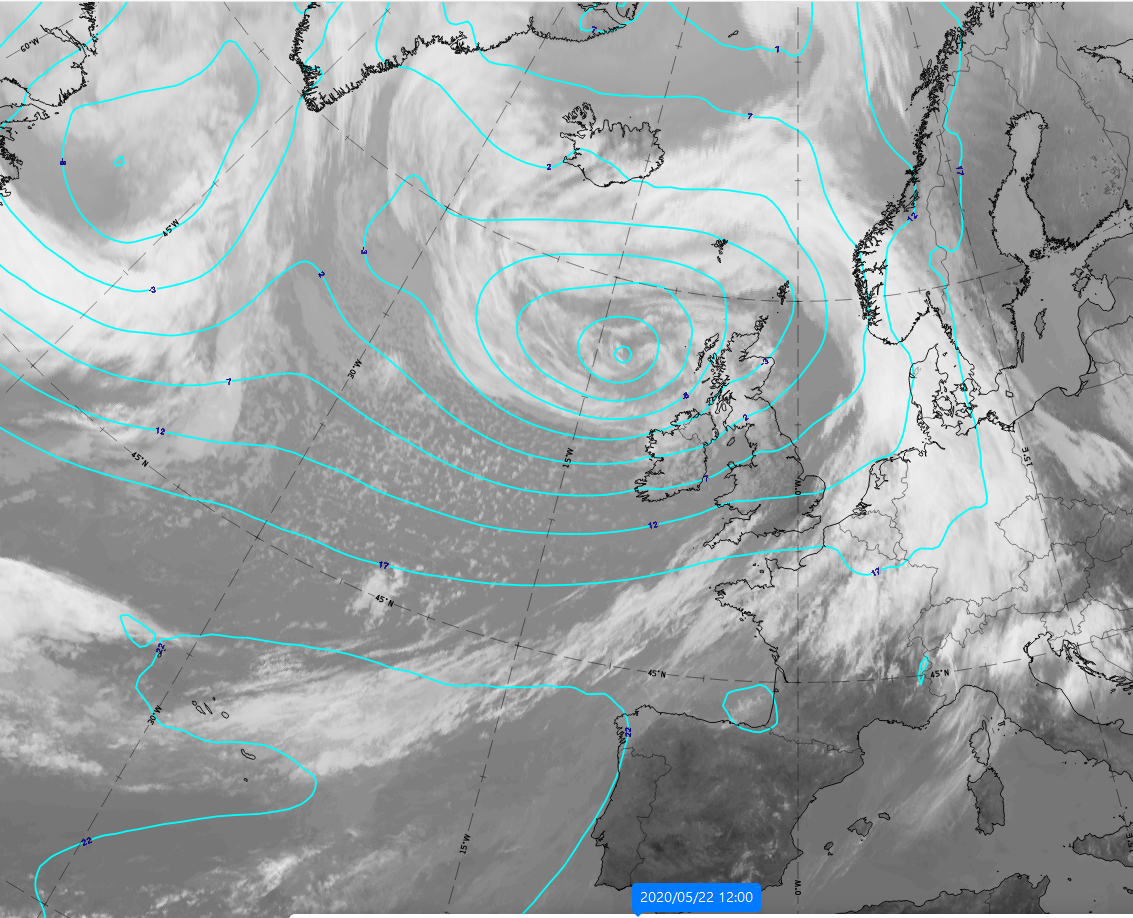 |
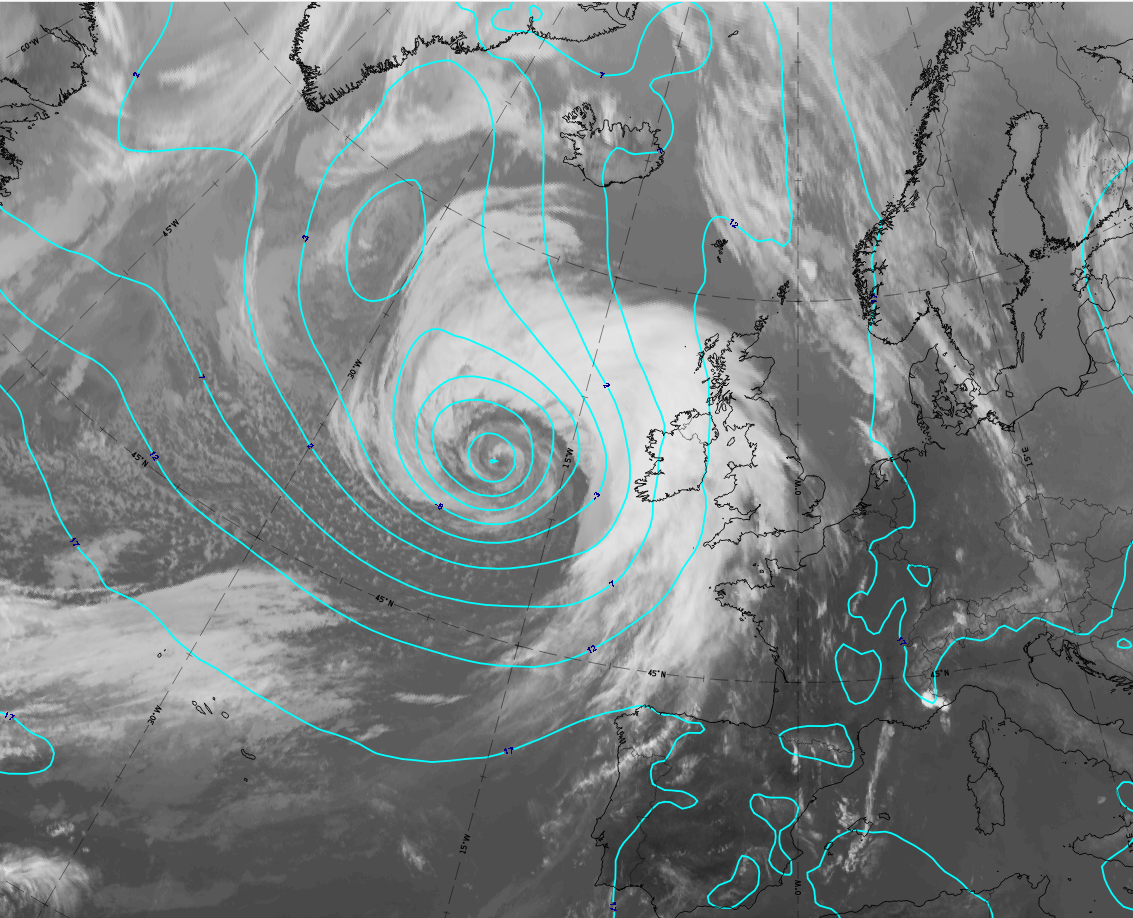
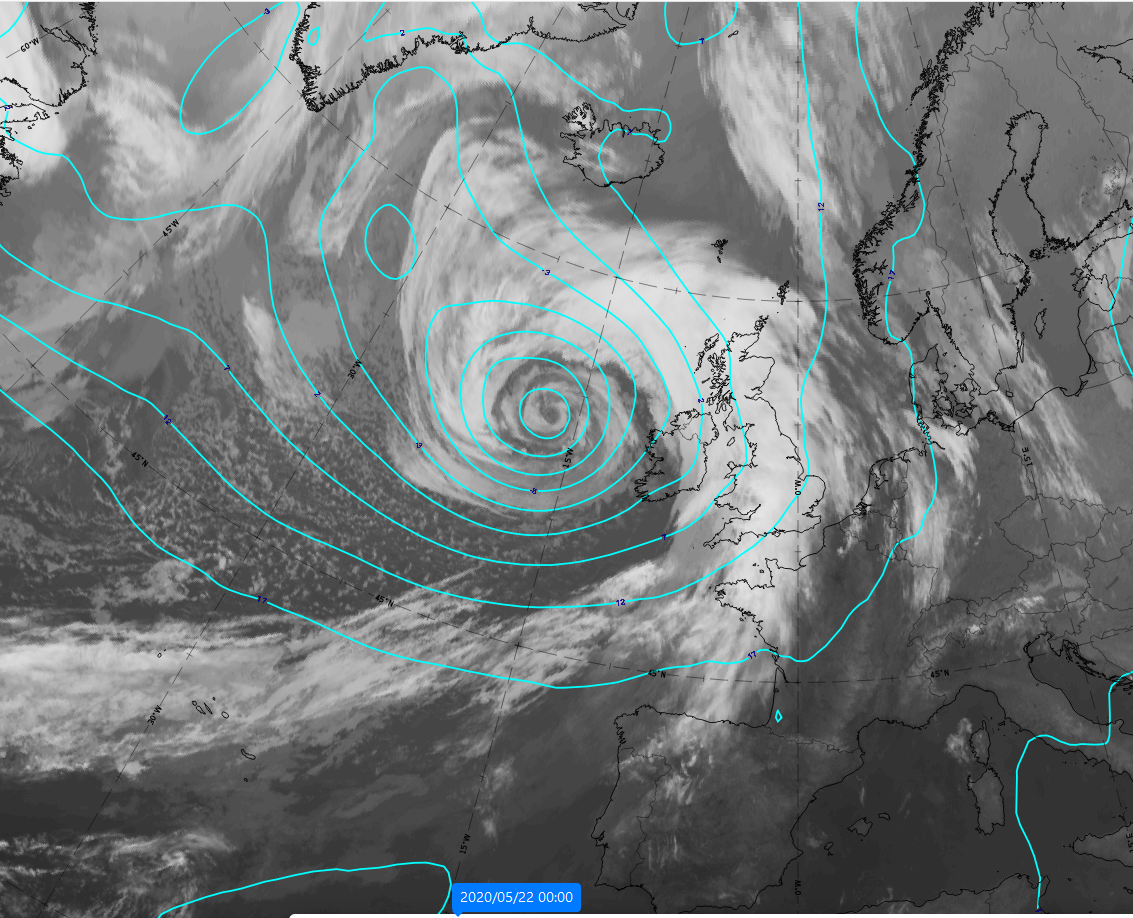
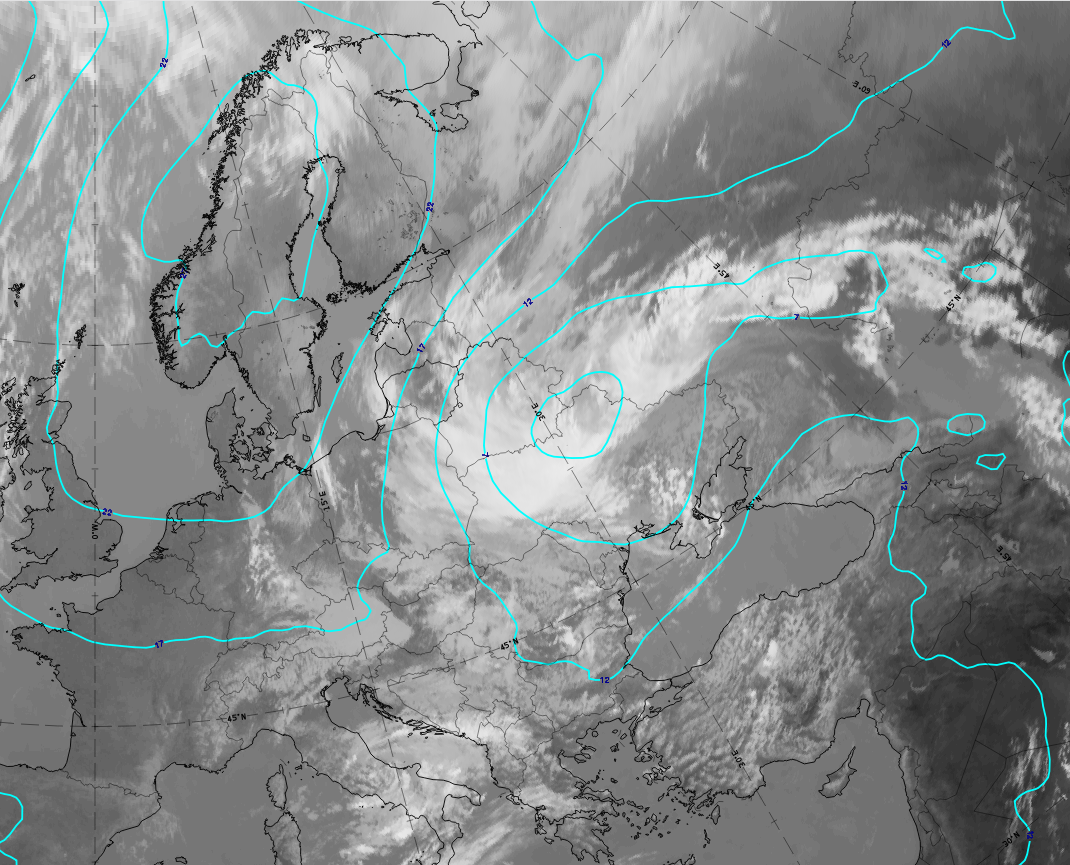
21-22 May 2020: 6- hourly sequence of Convergence Clouds. Type 1. IR. Cyan: Height contours 1000 hPa
u.l: 21 May at 18 UTC; u.r.: 22 May at 00 UTC; l.l: 22 May at 06 UTC; l.r.: 22 May at 12 UTC.*Note: click on the image to access the image gallery (navigate using arrows on keyboard)
The development of the Convergence Clouds is shown by an increase in the cloud fraction with a north-westward movement from the south of Ireland to southern tip of Greenland. In the first two images Convergence Clouds are clearly darker than the clouds of the occlusion spiral, indicating that warmer cloud tops exist there.
|
|
|
|
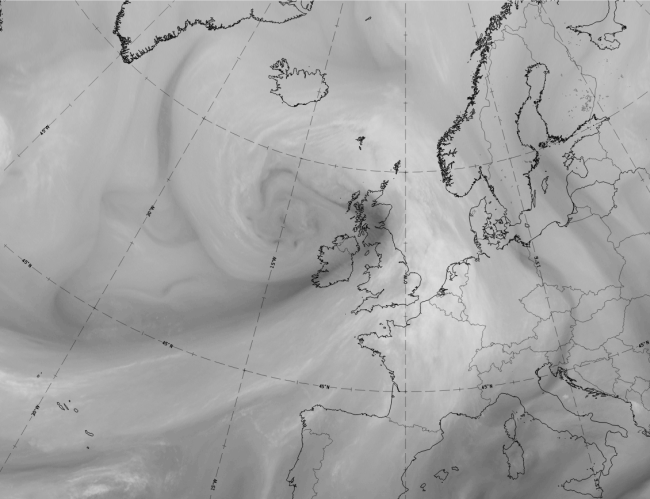
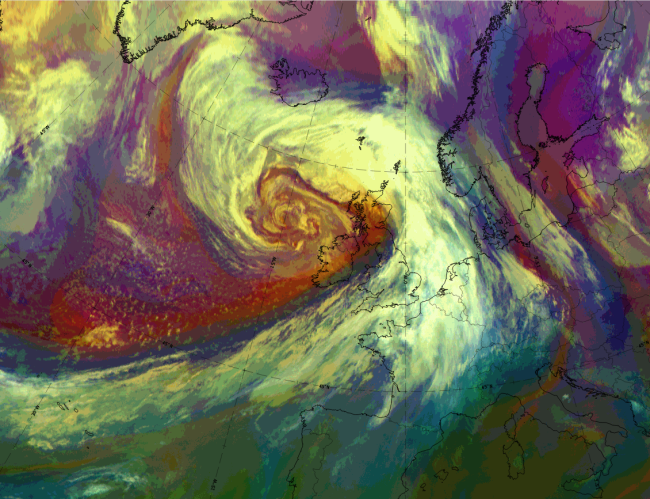
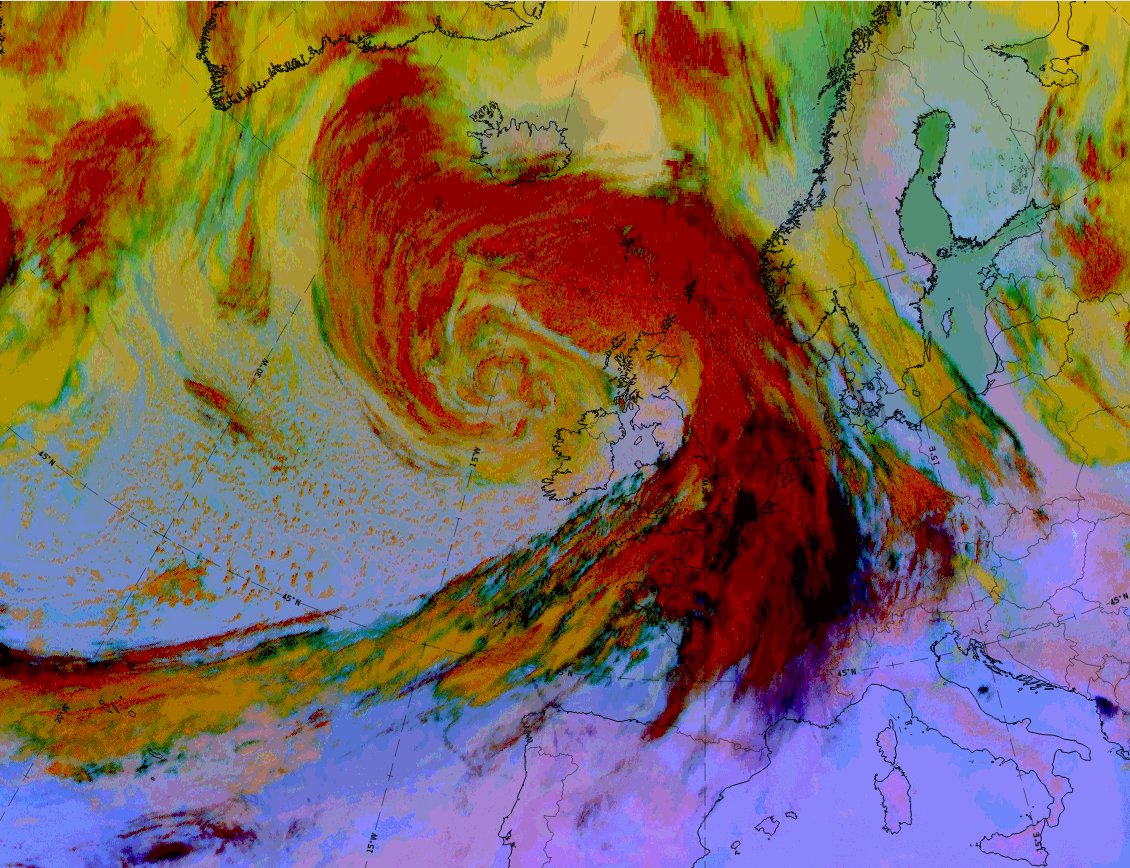
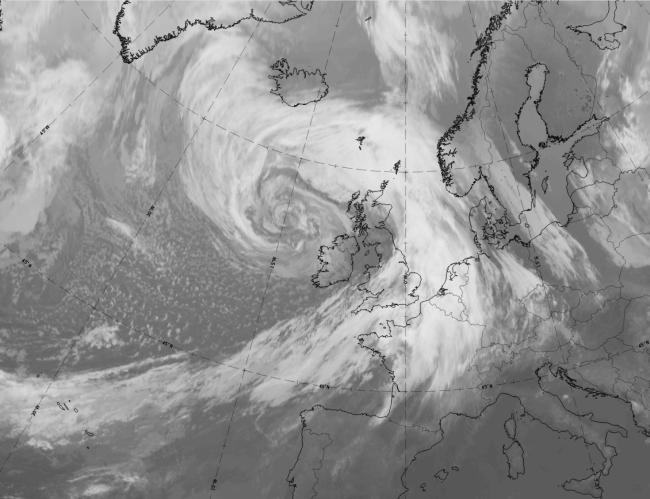
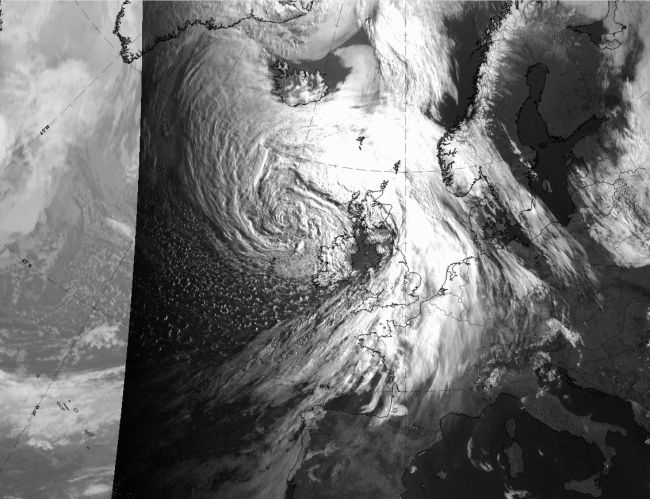
22 May 2020 at 06UTC: 1st row: IR (above) + HRV (below); 2nd row: WV (above) + Airmass RGB (below); 3rd row: Dust RGB + image gallery.
*Note: click on the image to access the image gallery (navigate using arrows on keyboard).
| OR | Mostly light grey and fibrous, representing cold cloud tops, however in many parts have lower values than in the occlusion spiral. |
| HRV | Light grey; because of the sun illumination angle at this time of the day, a comparison with the occlusion spiral is not useful. |
| WV | Light grey. |
| Airmass RGB | Mainly within the blue to dark-brown colours, representing cold and dry airmasses. The most important feature is the dark brown stripe at the rear (western side) of the Convergence Clouds merging with the dark brown area which reaches from the SW into the low centre. |
| Dust RGB | Dark red colours indicate thick ice clouds which do not differentiate much from the occlusion cloud spiral. In the southern latitudes, blue colours indicate the cloud free surface while in the more northern latitudes, ochre colours represent thin mid-level clouds surrounding the convergence and occlusion cloud bands. |
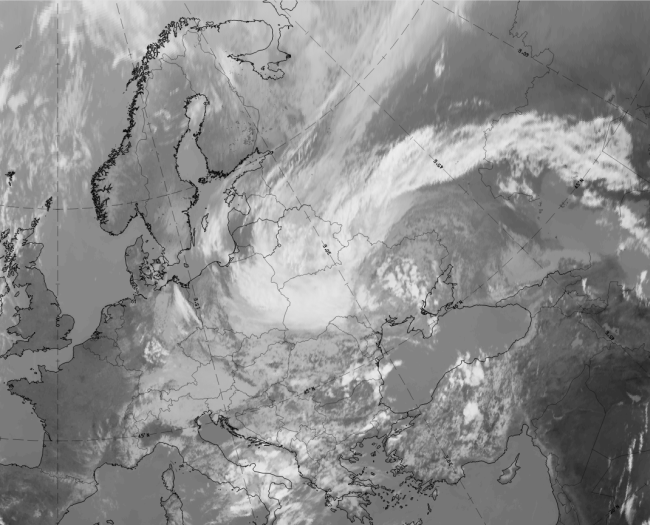
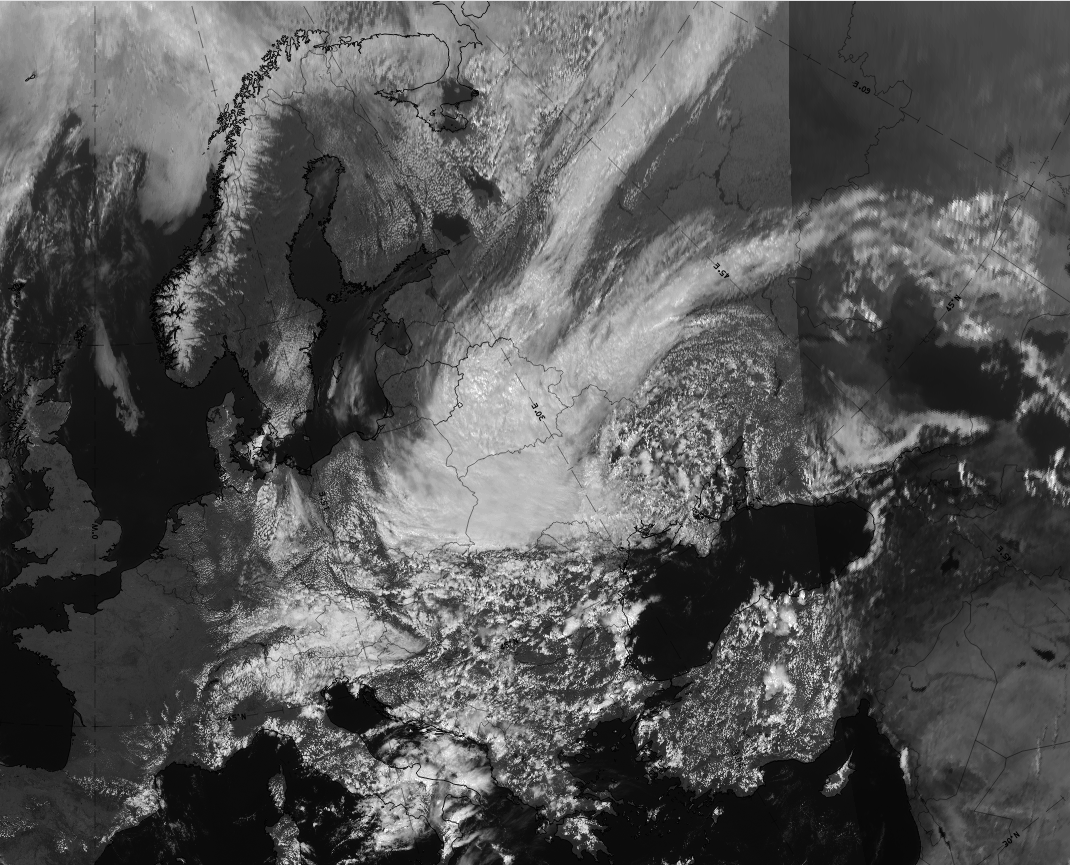
The case of 30 May 2020 at 12 UTC is an example of Convergence Clouds of type 2. On the one hand there is an occlusion spiral extending around a far developed low over North Ukraine and Belarus. On the other hand, there is a cold front cloud band extending from north Russia southward to Lithuania and Belarus. The Convergence Clouds develop in the transition area of both systems in the western part of the low pressure area.
 |
 |
 |
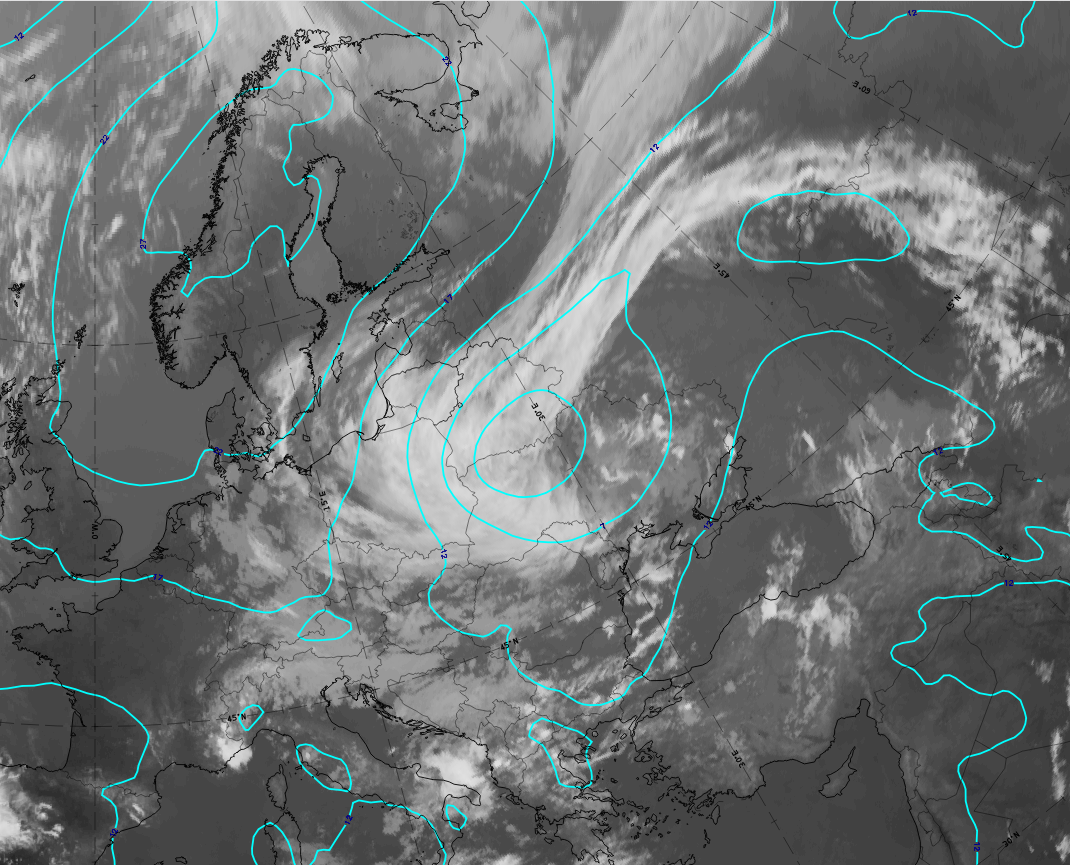 |
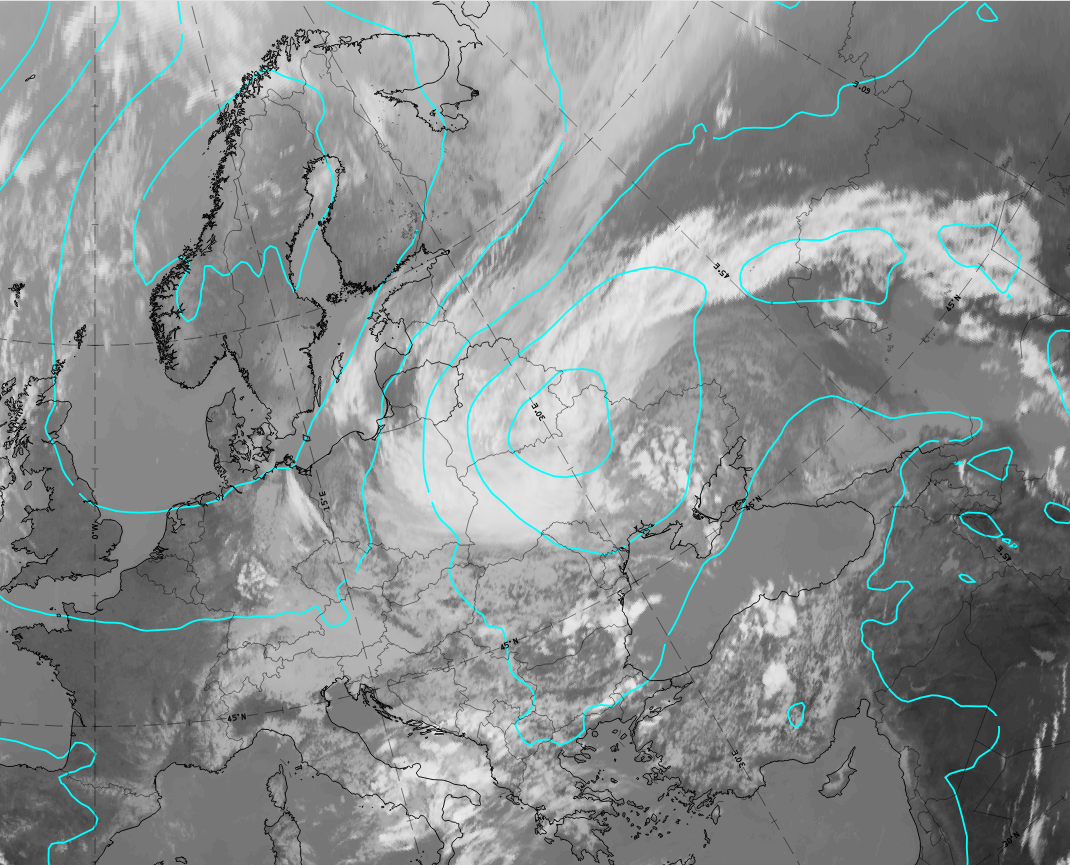
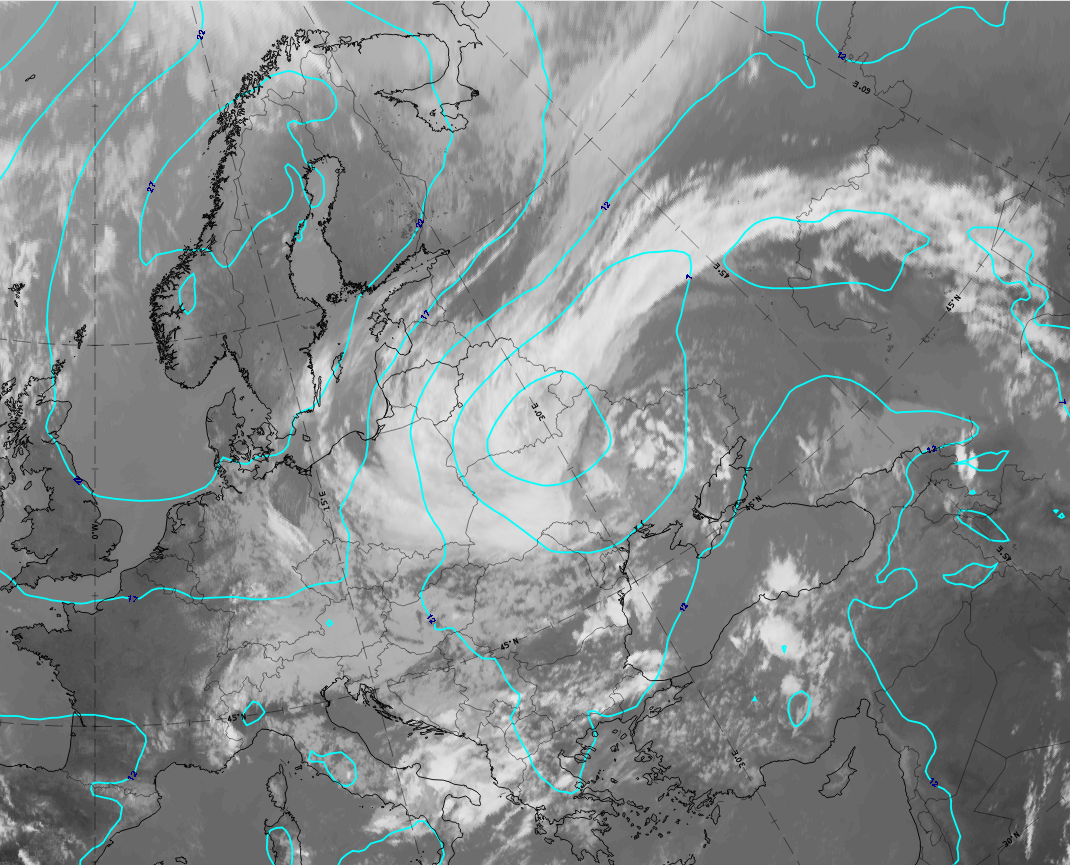
30 May 2020: 3- hourly sequence of Convergence Clouds Type 2. IR. Cyan: Height contours 1000 hPa
u.l: 30 May at 9 UTC; u.r.: 30 May at 12 UTC; l.l: 30 May at 15 UTC; l.r.: 30 May at 18 UTC.*Note: click on the image to access the image gallery (navigate using arrows on keyboard)
The Convergence Clouds develop at the western part of the merging area of both cloud bands, and extends south- and south-eastward. In this case, the Convergence Clouds appear as bright in the IR channel as the occlusion does, but it appears brighter than the cold front cloud band.
|
|

|
|

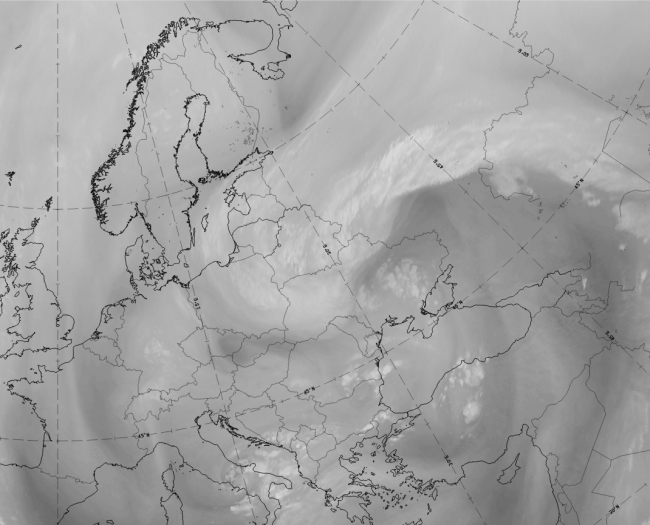
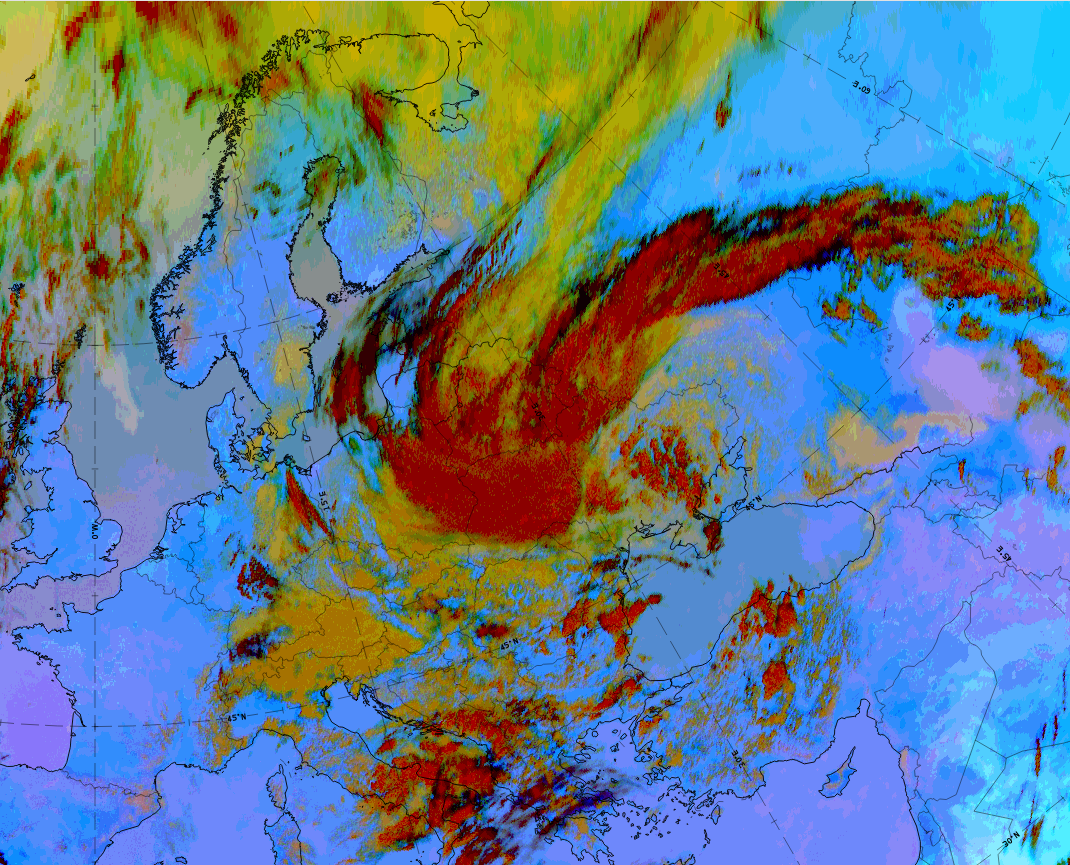
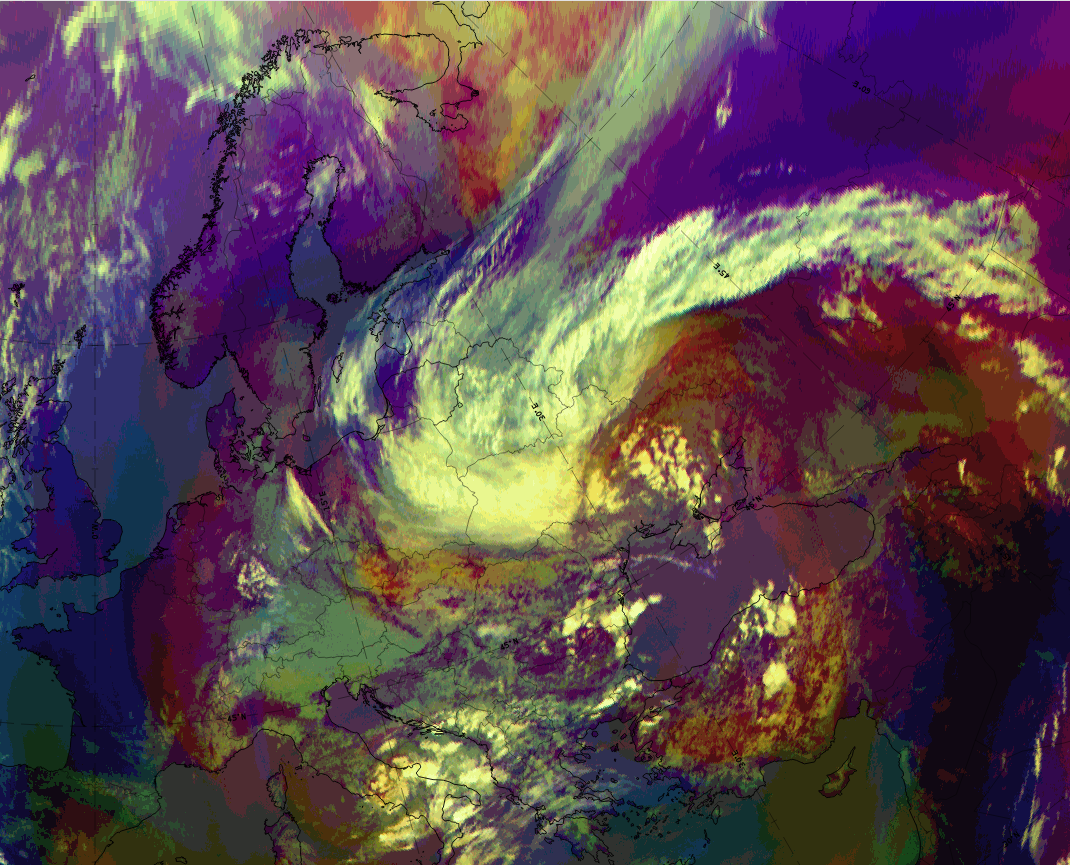
30 May 2020 at 12UTC: 1st row: IR (above) + HRV (below); 2nd row: WV (above) + Airmass RGB (below); 3rd row: Dust RGB + image gallery.
*Note: click on the image to access the image gallery (navigate using arrows on keyboard)
| IR | White and mainly dense. Representing the very cold cloud tops. |
| HRV | Light grey to white. Partly dense. Representing the thick clouds. |
| WV | White to light grey. Representing the clouds and the high water vapour content. |
| Airmass RGB | Located within the blue colours and partly surrounded by a dark brown stripe behind the cold front cloud band and at the southern border of the Convergence Clouds reaching into the low centre. |
| Dust RGB | Dark-red colours indicate thick ice cloud. |
| In the majority of cases, Convergence Clouds are less cold and more broken than the connected occlusion cloud band. In this case this scenario is not realised; on the contrary, the Convergence Clouds have equal or greater intensity than the occlusion cloud band. | |