Typical Appearance In Vertical Cross Sections
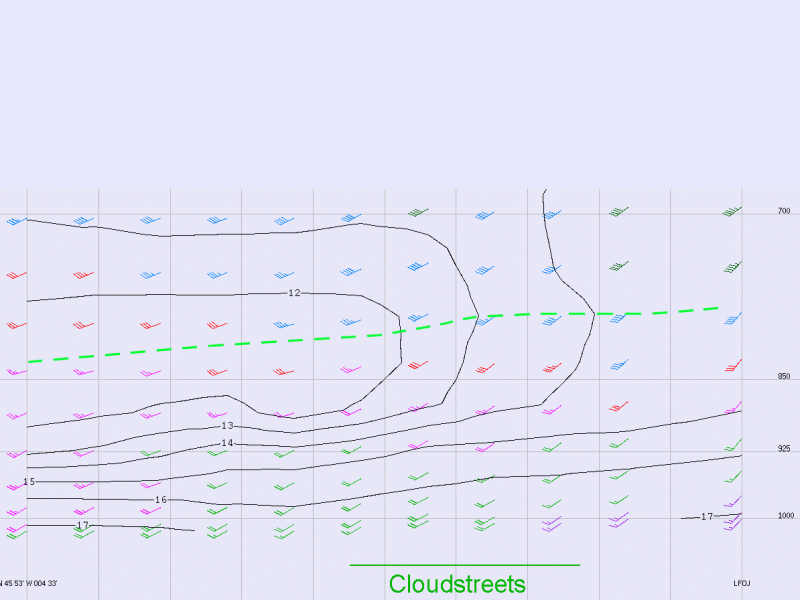
The dynamics of Cloud Streets generally differ totally from the other conceptual models described in this manual. Most of the essential processes take place in the lowest 1 - 2 kilometres, the processes themselves are in the range of micro/meso scale rather than baroclinic at the synoptic scale. However cross sections can help to detect the synoptic environment in which Cloud Streets can develop.
- ΘW
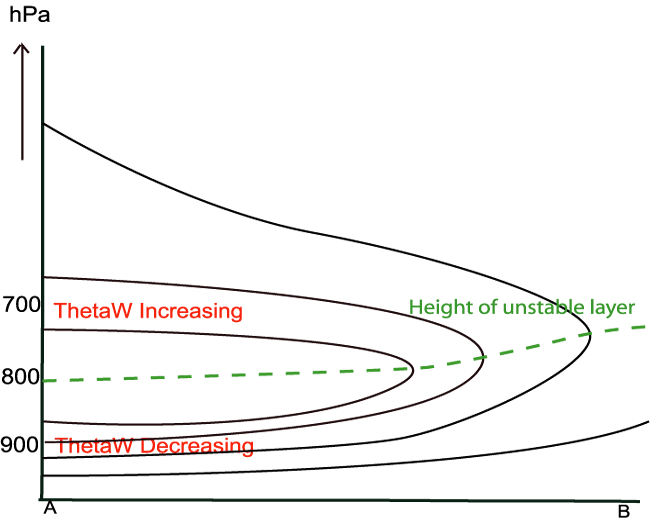
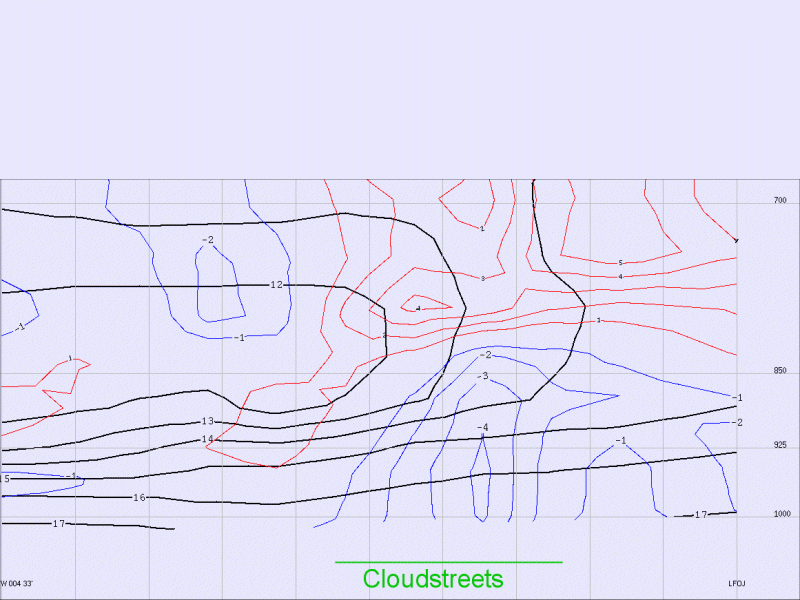
The typical restricted instability can be easily detected in the isentropes. In the lowest levels the potential wet bulb temperature decreases with height, indicating unstable stratification. Around a mean level of 800 hPa, 2 km, wet bulb potential temperature starts to rise again, indicating a change to a stable stratification or inversion. - Wind
In the unstable layer, the winds tend to increase with height and usually show a wind profile that slightly veers with height. However, numerical models do not always show the small scale wind variations which can be found from radiosonde data (dicussed in the Meteorological Physical Background). - Temperature advection
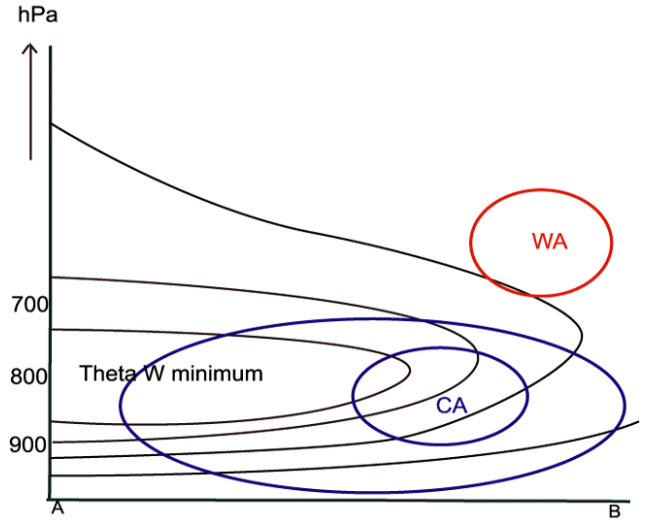
Cloud Streets usually occur in an outbreak of cold air, behind cold fronts in areas of cold advection. The maximum of cold advection can be found in the middle of the convective layer.
|
|
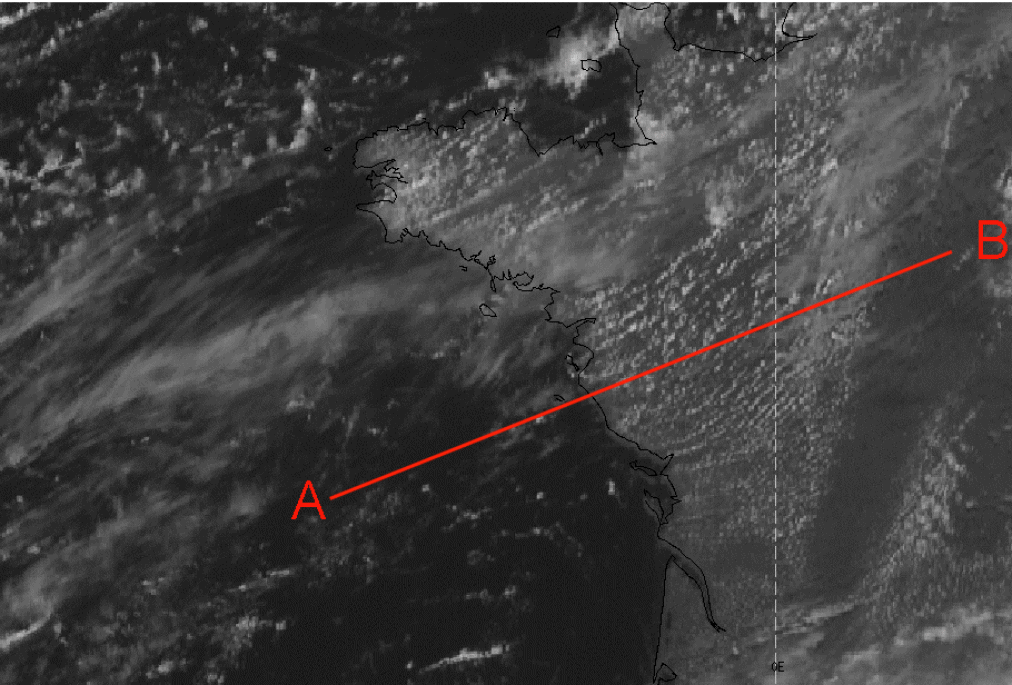
23 August 2004/12.00 UTC - Meteosat 8 Hires VIS image; position of vertical cross section indicated
|
|
ΘW
|
|
23 August 2004/12.00 UTC - Vertical cross section; horizontal wind barbs and black: isolines of Θw
|
|
|
|
|
|
|
23 August 2004/12.00 UTC - Vertical cross section; black: isolines of Θw, Red WA, Blue CA
|