Table of Contents
Cloud Structure In Satellite Images
Cold Fronts are usually associated with cold advection behind the frontal zone, but there are cases, where there is also warm advection within and behind the frontal zone, albeit usually weak. These are called Cold Fronts in Warm Advection, abbreviated CF in WA.
45 cases of CF in WA have been investigated here.
In satellite imagery the cloud bands of CF in WA generally look similar to Cold Fronts, but they are often weaker: roughly one third of such cloud bands consist only of low clouds, and almost half of them are more fibrous and broken than Cold Fronts.
As with a Cold Front in Cold Advection, a CF in WA can be a whole front, or a part of it (the rest of the front being either a classical Cold Front or a CF in CA).
CF in WA forms, when a Cold Front encounters warm air advection related to an another approaching system. This happens most often, when a new wave forms within a Cold Front.
Appearance in the basic channels:
- In VIS images: a light grey cloud band with some broken structure
- In IR images: a grey, broken cloud band, which is clearly darker than other frontal parts of the system
- In WV images: a grey band of high WV content with a shart boundary at the rearward edge
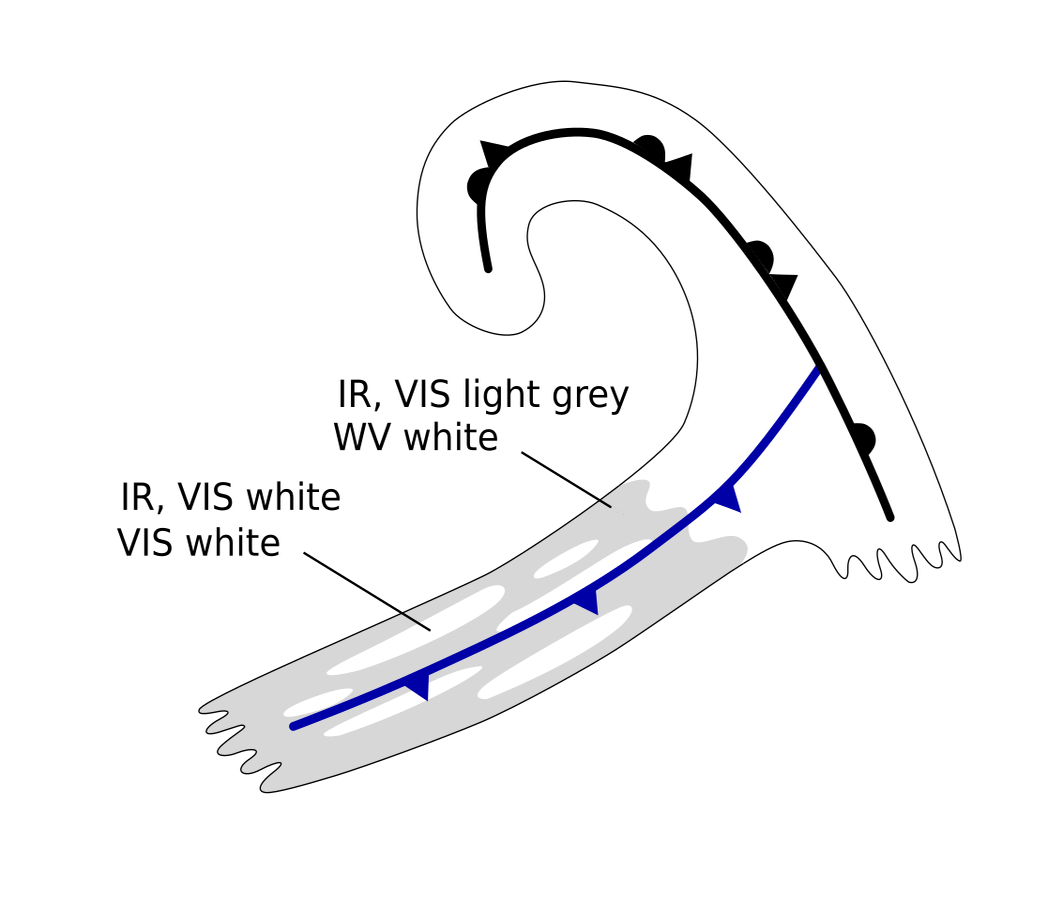
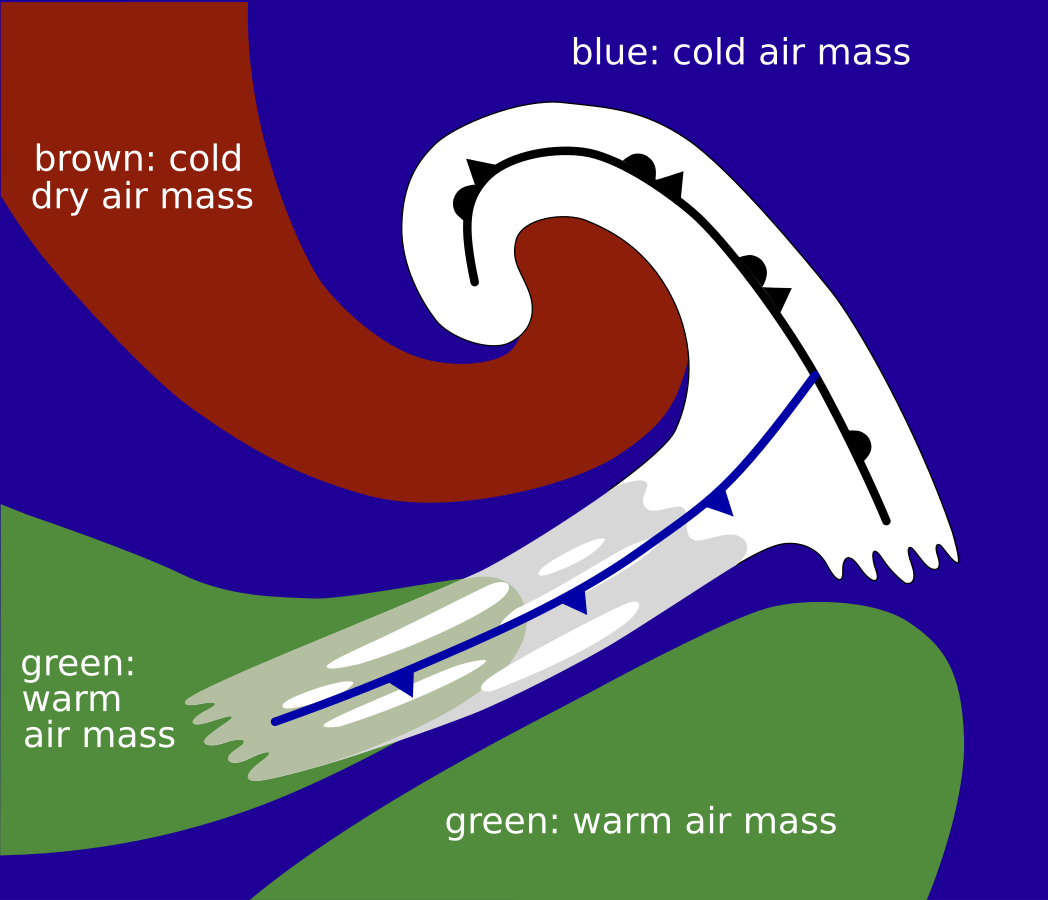
Appearance in the basic RGBs:
Airmass RGB
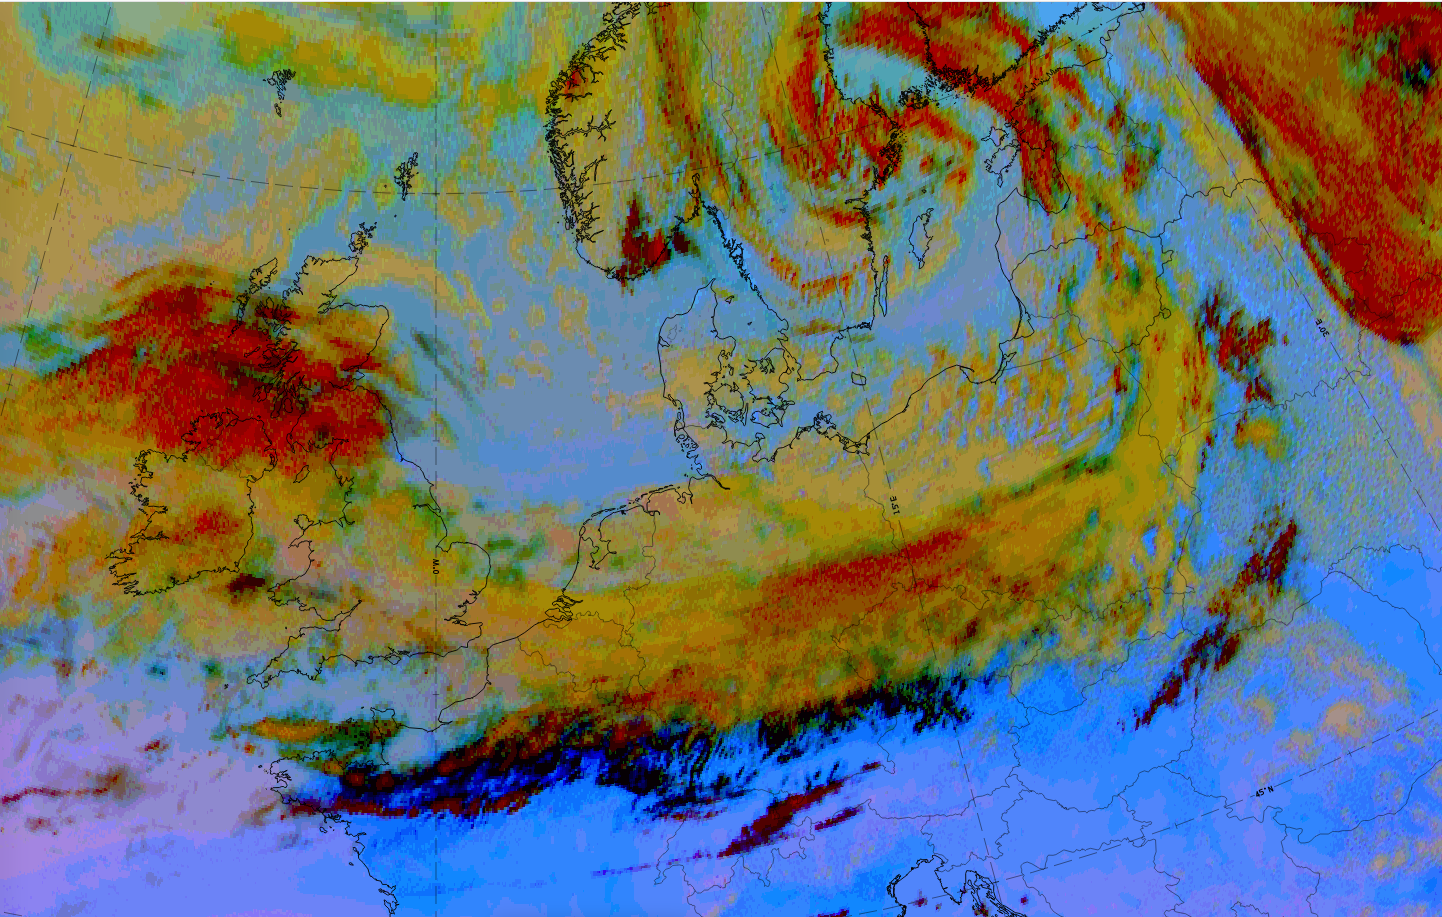
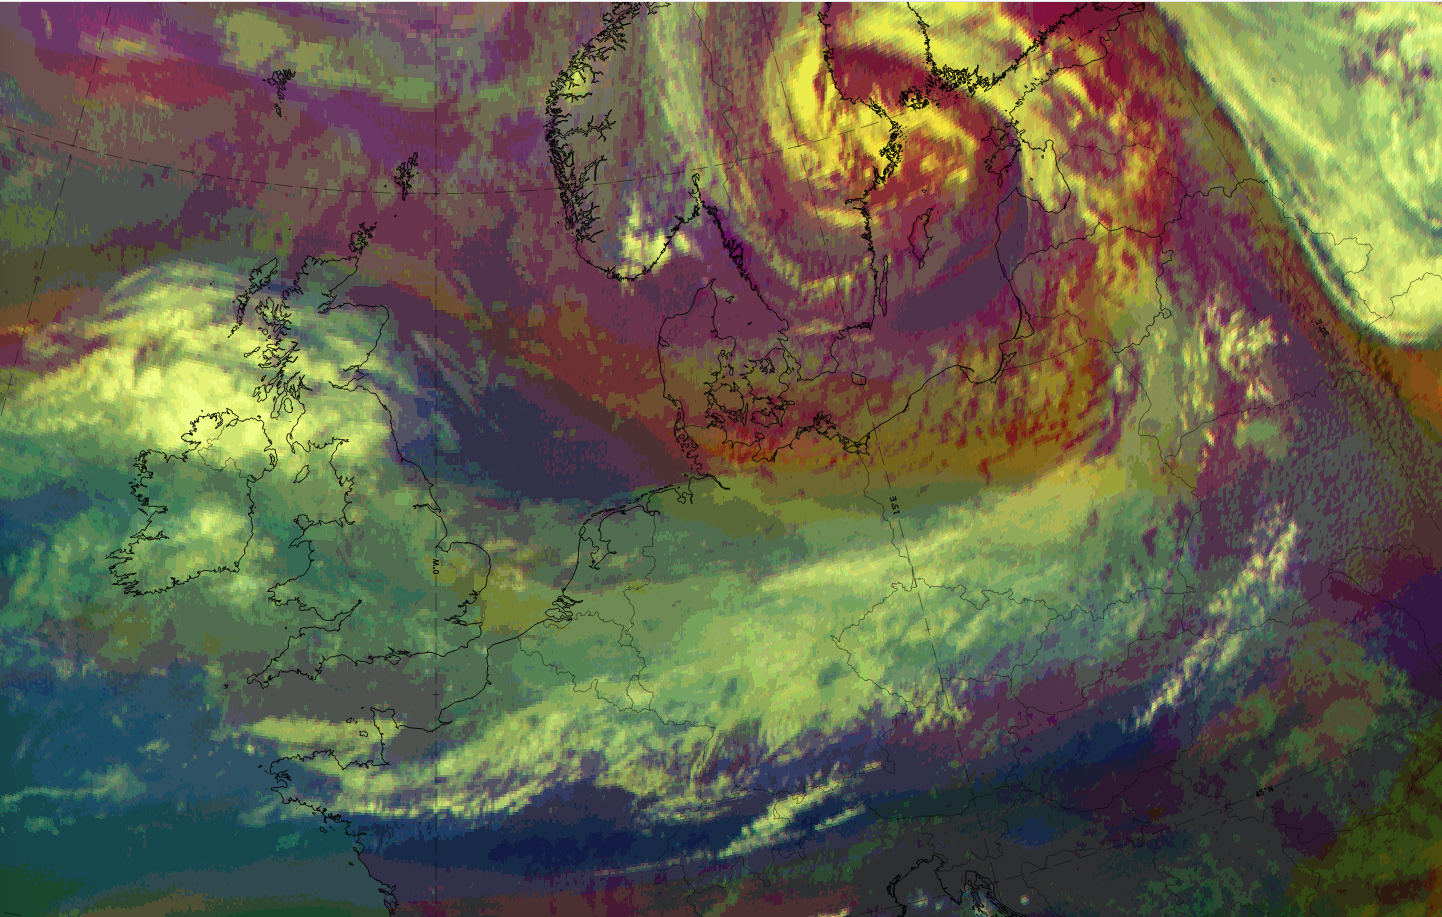
In the Airmass RGB the cloud band has a very similar appearance to that in the IR image. However, the area of the frontal band where clouds have dissolved appears in blue, sometimes greenish, colours, having the same width and configuration as in the WV channel. Consequently, this area mostly much broader than the cloud band and greenish colours indicate the warmer airmass approaching from the west and south-west.
Behind the distinct rearward edge, brownish colours indicate the approaching cold and dry air from the north and north-west.
Dust RGB
The surroundings of the Cold Front in Warm Advection cloud band are usually blue where there is cloud free ground. Ochre cloud patches, representing mid-level cloud, or pinkish areas, representing very dry air above the cloud-free ground, can occur within the blue area depending on the individual case.
The cloud band of the Cold Front in Warm Advection consists largely of ochre colours where there are only low and mid-level clouds, and dark-red colours, representing thick cloud with ice droplets, where higher cloud fibres have remained.
 |
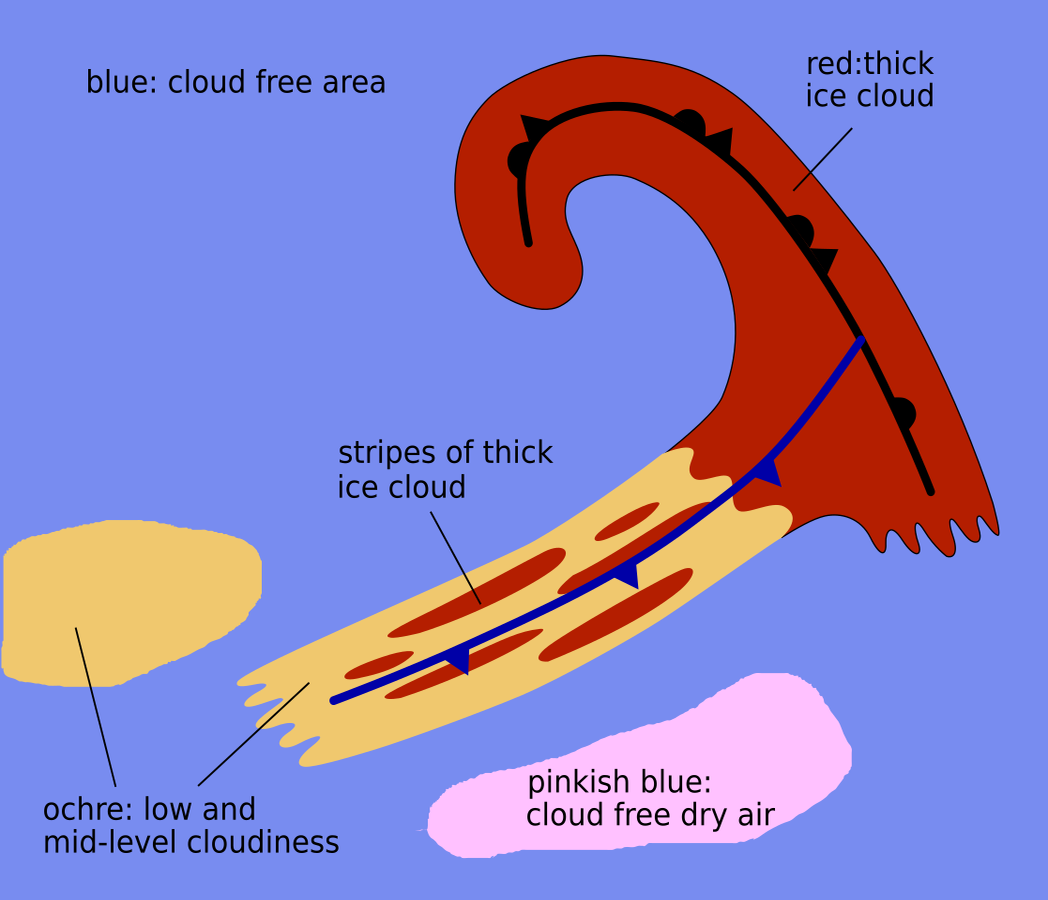 |
Legend: Basic RGB schematics.
Left: Airmass RGB; right: Dust RGB.
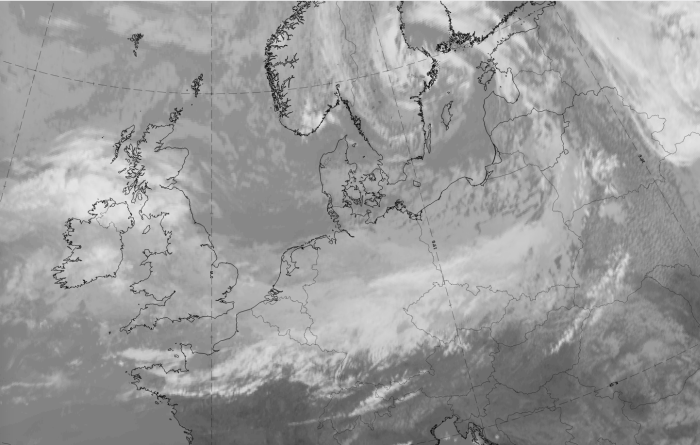
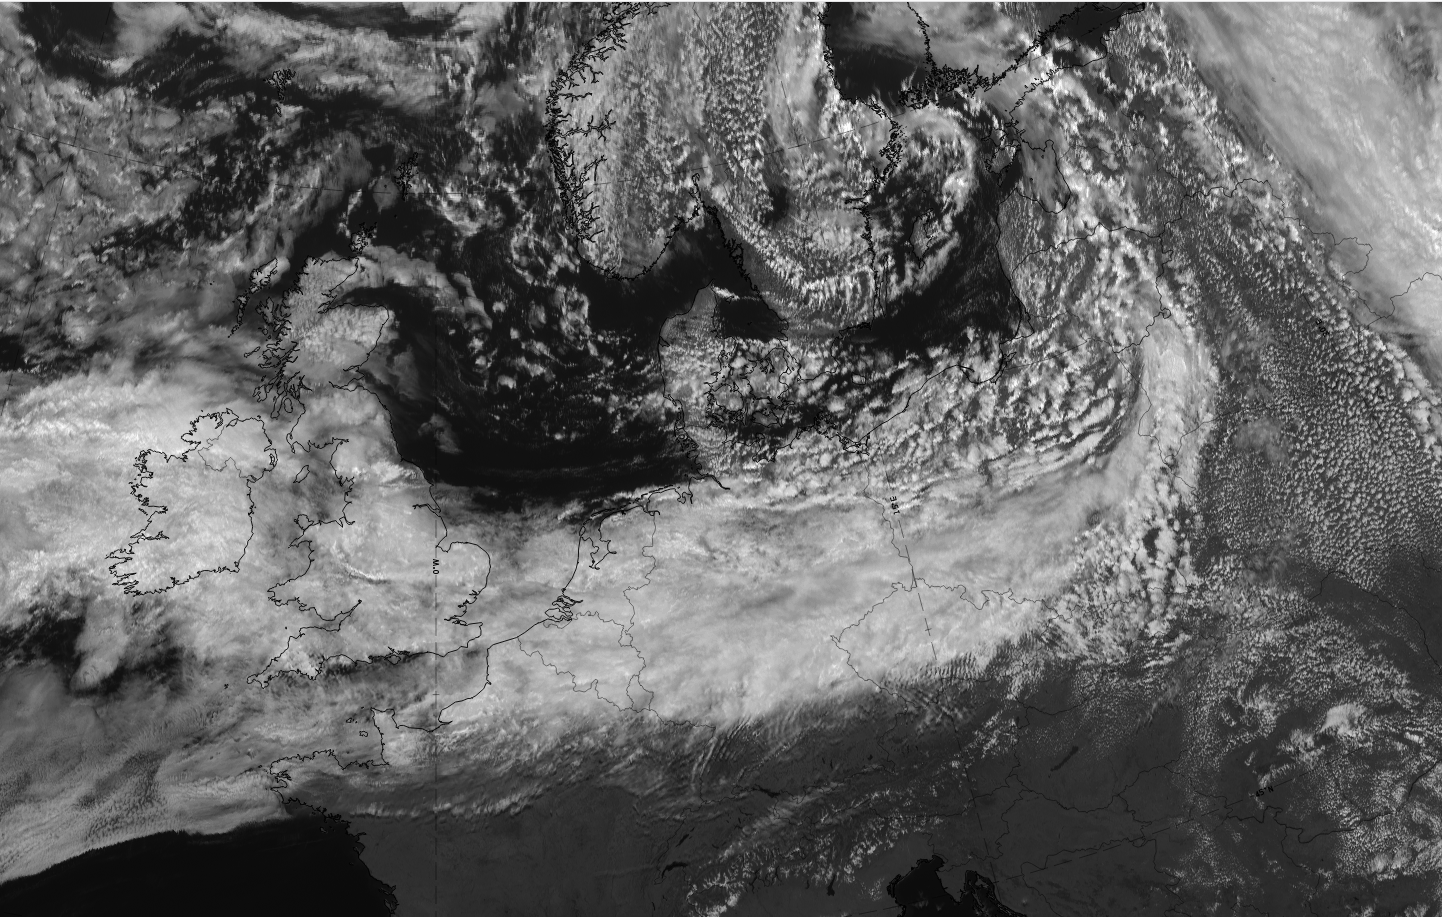
A case from 8 July 2020 at 12 UTC shows a typical example of a cloud band of a Cold Front in Warm Advection, which extends from western Europe across Germany and the Czech Republic to southern Poland. Over the British Isles, the cloud shield of a warm front can be observed. This system is thought to be responsible for the warm advection.
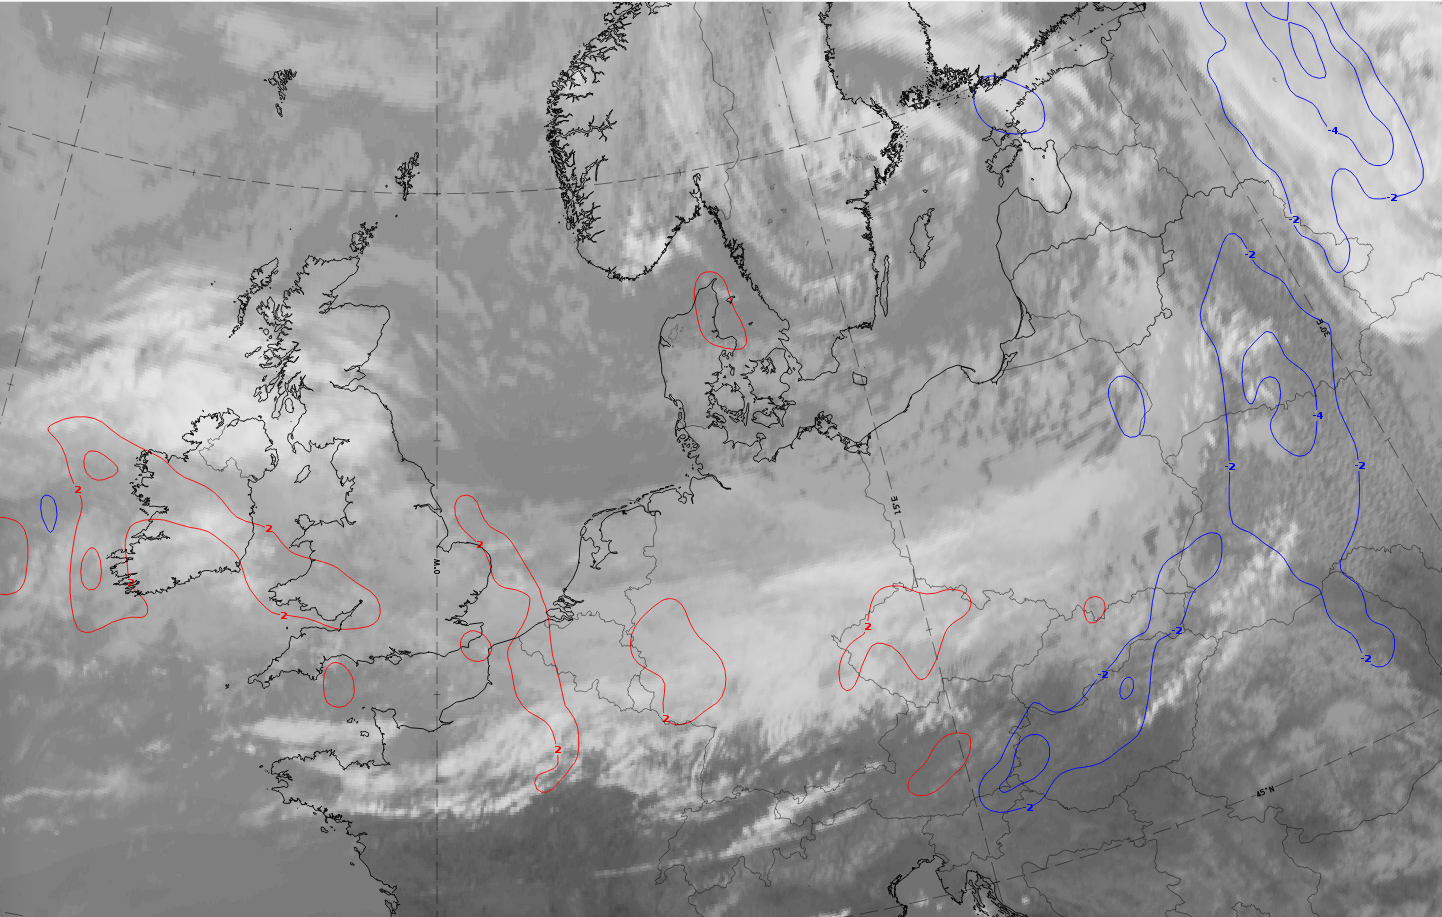
8 July 2020, 12UTC: IR with temperature advection at 700 hPa superimposed; red: warm advection; blue: cold advection.
|
|

|
|
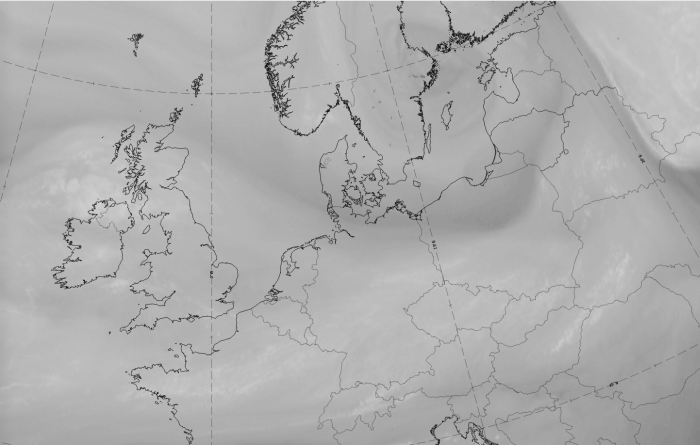
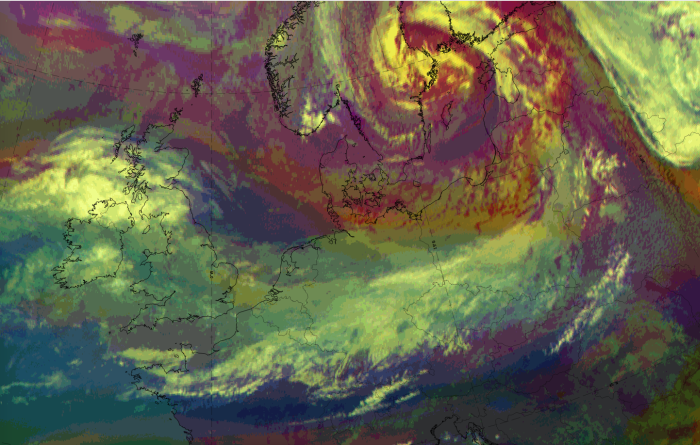
8 July 2020, 12UTC: 1st row: IR (above) + HRV (below); 2nd row: WV (above) + Airmass RGB (below); 3rd row: Dust RGB + image gallery.
*Note: click on the image to access the image gallery (navigate using arrows on keyboard).
| IR | Light grey with white stripes at the rear edge. |
| HRV | White at the leading part in the south and grey at the rearward part. |
| WV | Broad white band with a dark grey stripe to the north. |
| Airmass RGB | Clouds in white with a greenish shadow above, especially in the western parts where warm airmasses are advected. A dark-brown stripe to the north, corresponding to the dark grey stripe in the WV image. |
| Dust RGB | Some black translucent ice clouds at the leading edge. Ochre colours within the cloud band at the rear side. Dark-red stripes representing the thicker ice clouds. |
A case from 19 to 20 April 2020, shown in a 6-hourly sequence, illustrates two typical processes for a Cold Front in Warm Advection: warm air is advected into the circulation of the occlusion development from the rear side, and this warm advection leads to the dissolution of the former cold front cloud band.
19 - 20 April 2020: 6-hourly sequence. The Cold Front in Warm Advection is indicated by an arrow.
u.l.: 19 April at 18 UTC; u.r.: 20 April 00 UTC; l.l: 20 April 06 UTC; l.l.: 20 April 12 UTC.*Note: click on the image to access the image gallery (navigate using arrows on keyboard)
Meteorological Physical Background
Cold Fronts in Warm Advection, abbreviated CF in WA, are principally like normal Cold Fronts, but they are wholly within warm advection. The warm advection is generally weak, and it is weaker behind the frontal zone than ahead of it.
In summer the Cold Fronts in Warm Advection are nearly as common as Cold Fronts in Cold Advection, but in winter they are rare.
CF in WA forms, when a Cold Front encounters an area of warm advection connected to another, approaching system. Usually this system is a Warm Front, either a wave forming within the Cold Front, or another cyclone catching up the Cold Front. It can also be Detached Warm Front, Warm Conveyor Belt, Baroclinic Boundary, or an Occlusion with warm advection ahead of it.
CF in WA is often a relatively old, weakening front. This stage does not last long (typically less than 12 hours), and it soon turns into some other type of Cold Front or a Wave, or just disappears.
According to studies at ZAMG, about half of CF in WA cases are weakening, and only about 10 % are intensifying.
The main feature of a CF in WA is a Warm Conveyor Belt. It tends to either intensify with height or to exist only at higher levels. In about half of the cases the Warm Conveyor Belt overruns the cloud band to the north. An upper level stream occurs only in the minority of cases. In several cases a closed cyclonic circulation can be found behind the Warm Conveyor Belt, but with little vertical displacement.
As there is only one conveyor belt involved, the temperature and humidity contrasts are rather weak in the area of the frontal cloud band.
|
03 October 2006/12.00 UTC - Meteosat 8 IR10.8 image; position of vertical cross section indicated
|
|
|

|

|
|
|
03 October 2006/12.00 UTC - Meteosat 8 IR10.8 image; magenta: relative streams 318K, yellow: isobars 318K
|
03 October 2006/12.00 UTC - Vertical cross section; black: thetaE, red: warm advection
|
Key Parameters
In this chapter the key parameters of Cold Front in Warm Advection (over Belarus and Poland) are described and compared to the corresponding parameters of a Cold Front (over Scotland).
Positive vorticity advection at 500 hPa and temperature advection at 700 hPa:
- In a CF in WA there is a maximum of PVA over the rear edge of the cloud band.
- In a CF the maximum of PVA is equally distributed, but remarkably stronger.
- In a CF in WA the cloud band is wholly under weak warm advection; some warm advection is also ahead of the front. Behind the front there is usually very little temperature advection.
- in a CF there is warm advection ahead of the cloud band and strong cold advection behind it. The cloud band is mostly under cold advection.
|
03 October 2006/12.00 UTC - Meteosat 8 IR 10.8 image; green: PVA 500 hPa, red: temperature advection 700 hPa
|
|
|
|
|
|
|
19 September 2005/12.00 UTC - Meteosat 8 IR 10.8 image; green: PVA 500 hPA, red: temperature advection 700 hPa
|
Thermal frontal parameter and equivalent thickness:
- TFP accompanies the cloud band in both cases, although in CF in WA it is weaker.
- Equivalent thickness shows a crowding zone near the rear edge of the cloud band, and a ridge ahead of it.
|
03 October 2006/12.00 UTC - Meteosat 8 IR 10.8 image; blue: TFP, green: equivalent thickness
|
|
|
|
|
|
|
19 September 2005/12.00 UTC - Meteosat 8 IR 10.8 image; blue: TFP, green: equivalent thickness
|
Shear vorticity and wind at 300 hPa:
- The zero line of shear vorticity follows the rear edge of the cloud band and coincides the jet stream.
|
03 October 2006/12.00 UTC - Meteosat 8 IR 10.8 image; magenta: zero line of shear vorticity 300 hPa, yellow: isotachs 300 hPa
|
|
|
|
|
|
|
19 September 2005/12.00 UTC - Meteosat 8 IR 10.8 image; magenta: zero line of shear vorticity 300 hPa, yellow: isotachs 300 hPa
|
Typical Appearance In Vertical Cross Sections
The vertical structure of CF in WA shows most clearly, that the front is indeed a Cold Front, despite being within warm advection.
Comparison of cross sections between a Cold Front and a Cold Front in Warm Advection (see Cold Front - Typical Appearance In Vertical Cross Sections ):
- TA: in CF warm advection ahead of the frontal zone and strong cold advection behind it, in CF in WA only weak warm advection is present
- Omega: in CF strong ascend ahead of the frontal zone and weak descend behind it, in CF in WA mostly only weak ascend on the middle levels
- PVA: In a CF the frontal zone is within PVA, which increases with height. The maximum is just below the tropopause. In a CF in WA there is only weak PVA on the upper levels.
- Divergence: convergence within the frontal zone, divergence above it. Features are similar in both types, but in CF they are stronger.
- Relative humidity: Humid air ahead of the frontal zone, dry air intruding into it from behind. In CF in WA the dry air does not penetrate through the whole frontal zone.
Locations of the cross section for both cases:
|
Cold Front in Warm Advection: 03 October 2006/12.00 UTC - Meteosat 8 10.8 image; position of vertical cross section indicated
|
Cold Front: 19 September 2005/12.00 UTC - Meteosat 8 10.8 image; position of vertical cross section indicated
|
|
|
Temperature advection:
- In CF in WA the whole system is under weak warm advection.
- In CF there is warm advection above and ahead of the frontal zone and pronounced cold advection behind it, and partly within it.
|
03 October 2006/12.00 UTC - Vertical cross section; black: isentropes, red thick: warm advection, red thin: cold advection
|
|
|

|
|
|
|
19 September 2005/12.00 UTC - Vertical cross section; black: isentropes, red: warm advection (no cold advection present)
|
Vertical motion:
- In CF in WA there is weak ascent ahead of the frontal zone on the middle levels, and even weaker descent behind it.
- In CF there is strong ascent ahead of the frontal zone and descent behind it.
|
03 October 2006/12.00 UTC - Vertical cross section; black: isentropes, cyan thick: upward motion, cyan thin: downward motion
|
|
|
|
|
|
|
19 September 2005/12.00 UTC - Vertical cross section; black: isentropes, cyan thick: upward motion, cyan thin: downward motion
|
Vorticity advection:
- In CF in WA there is weak PVA on the upper levels.
- In CF the frontal zone is within positive vorticity advection, which increases with height. The maximum is just below the tropopause.
|
03 October 2006/12.00 UTC - Vertical cross section; black: isentropes, green: PVA
|
|
|
|
|
|
|
19 September 2005/12.00 UTC - Vertical cross section; black: isentropes, green thick: PVA, green thin: NVA
|
Divergence:
- In connection with fronts there is convergence within the frontal zone and divergence above it.
|
03 October 2006/12.00 UTC - Vertical cross section; black: isentropes, magenta thick: convergence, magenta thin: divergence
|
|
|
|
|
|
|
19 September 2005/12.00 UTC - Vertical cross section; black: isentropes, magenta thick: convergence, magenta thin: divergence
|
Relative humidity:
- The relative humidity is high ahead of the frontal zone and low behind it.
|
03 October 2006/12.00 UTC - Vertical cross section; black: isentropes, blue solid: relative humidity > 60%, blue dashed: relative humidity
< 70%
|
|
|
|
|
|
|
19 September 2005/12.00 UTC - Vertical cross section; black: isentropes, blue solid: relative humidity > 60%, blue dashed: relative humidity
< 70%
|
Weather Events
As Cold Fronts in WA are usually weaker than other Cold Fronts, they produce less precipitation. In about a third of the cases there is no precipitation at all. Severe weather such as thunderstorms is very unlikely.
| Parameter | Description |
| Precipitation |
|
| Temperature |
|
| Wind (incl. gusts) |
|
| Other relevant information |
|
|
|
|
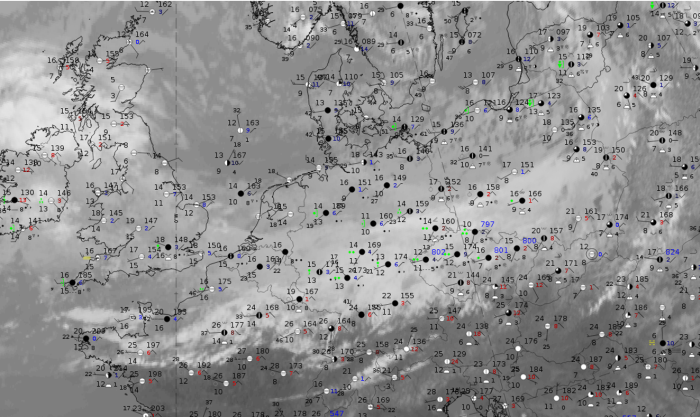
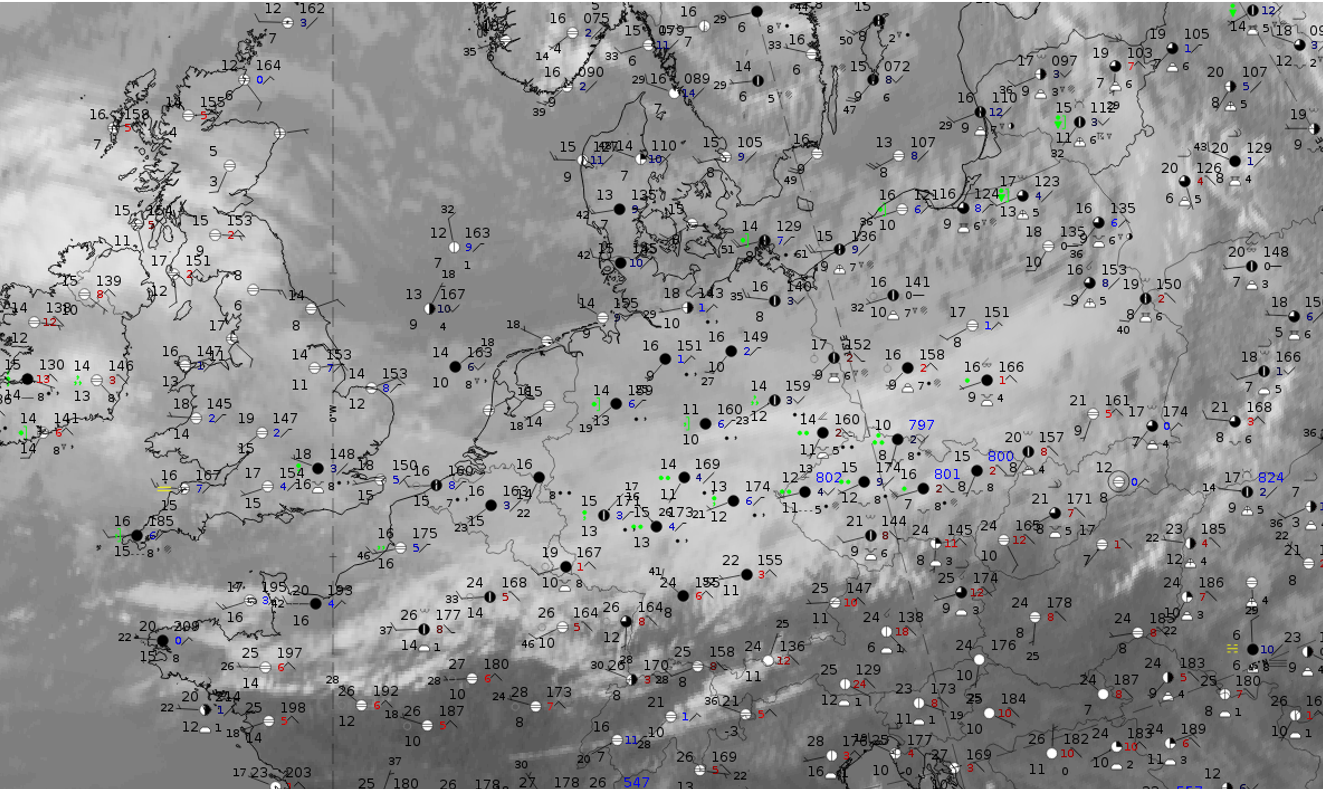
Note: for a larger SYNOP image click this link.
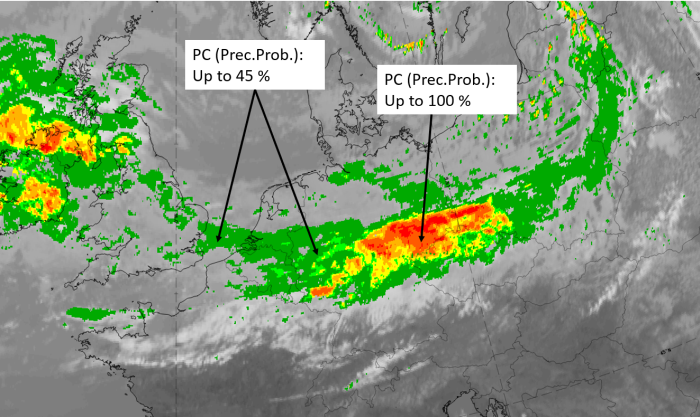
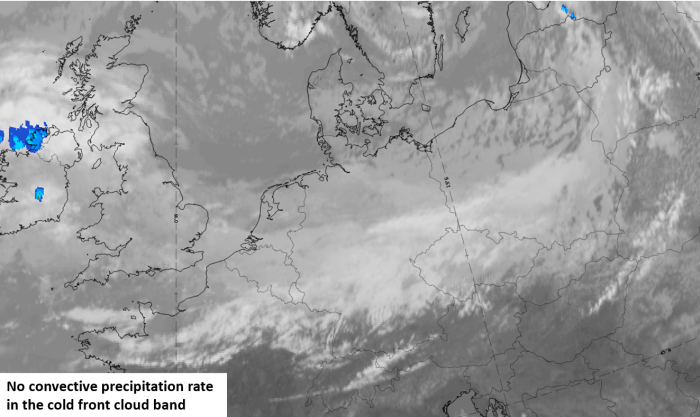
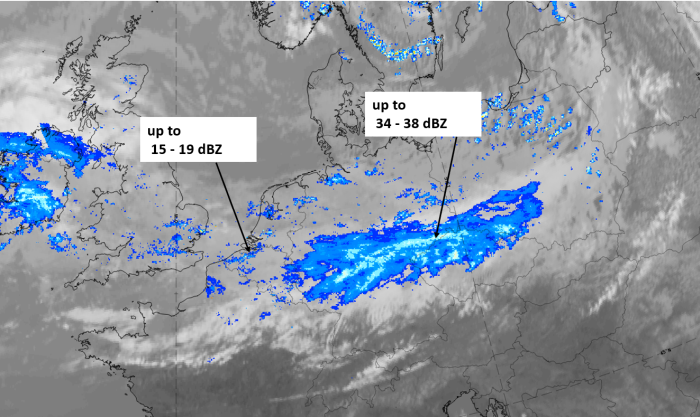
The whole cloud band extends from southern England across southern Germany to Poland and has in its western parts, which are close to the subsequent warm front cloud shield, only low precipitation activity. This is also reflected in the low probability of precipitation computed from NWCSAF. To the east, in the centre of the cloud band, more precipitation observations occur, with higher values; here, the precipitation could be enhanced by orographic effects.
|
|
|
|
Legend:
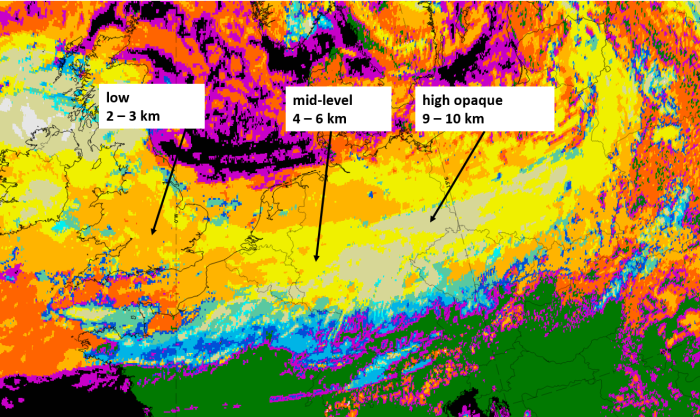
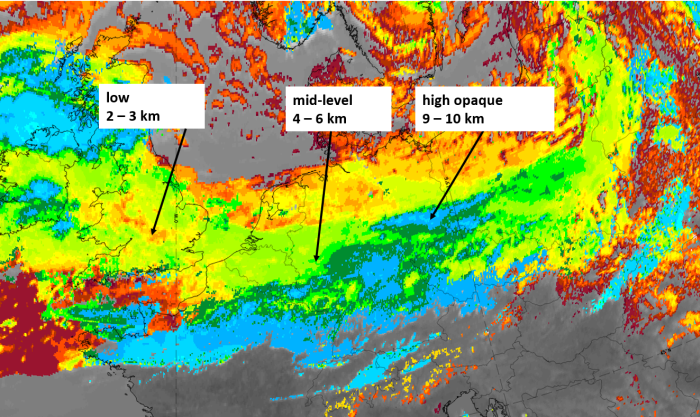
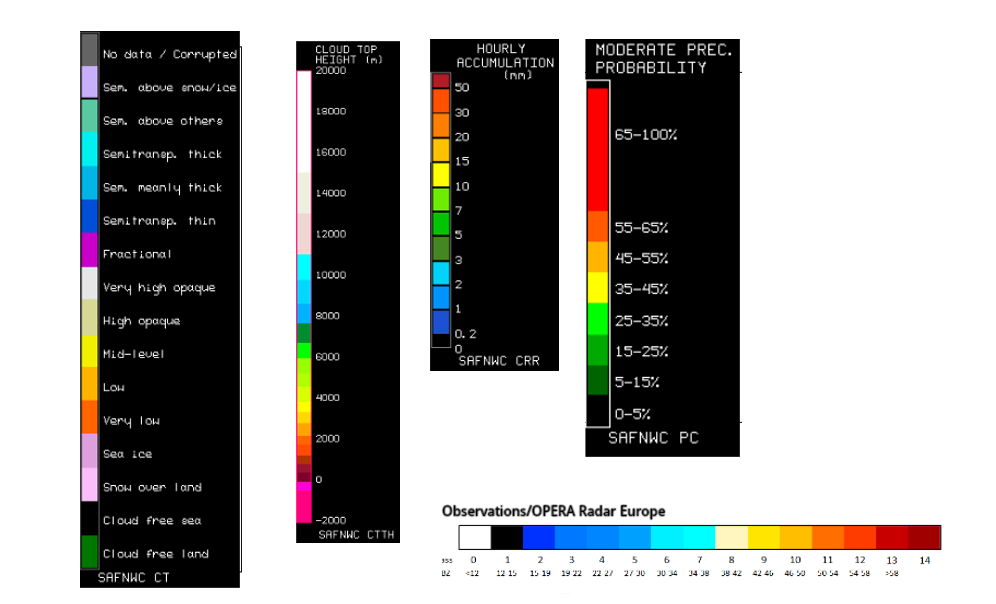
8 July 2020, 12 UTC, IR; with the following fields superimposed: 1st row: Cloud Type (CT NWCSAF) (above) + Cloud Top Height (CTTH - NWCSAF) (below); 2nd row: Convective Rainfall Rate (CRR NWCSAF) (above) + Radar intensities from Opera radar system (below).
For identifying values for Cloud type (CT), Cloud type height (CTTH), precipitating clouds (PC), and Opera radar for any pixel in the images look into the legends. (link)
References
References concerning the "Cold Front in Warm Advection" are similar to the ones for "Cold Front". Compare Cold Front - References