Table of Contents
Cloud Structure In Satellite Images
In satellite images, Cold Fronts appear as cyclonically curved synoptic scale cloud bands. They can be divided into two subgroups: Ana and Kata fronts. These types show a slightly different structure in satellite images.
Ana Cold Front
Appearance in the basic channels
-
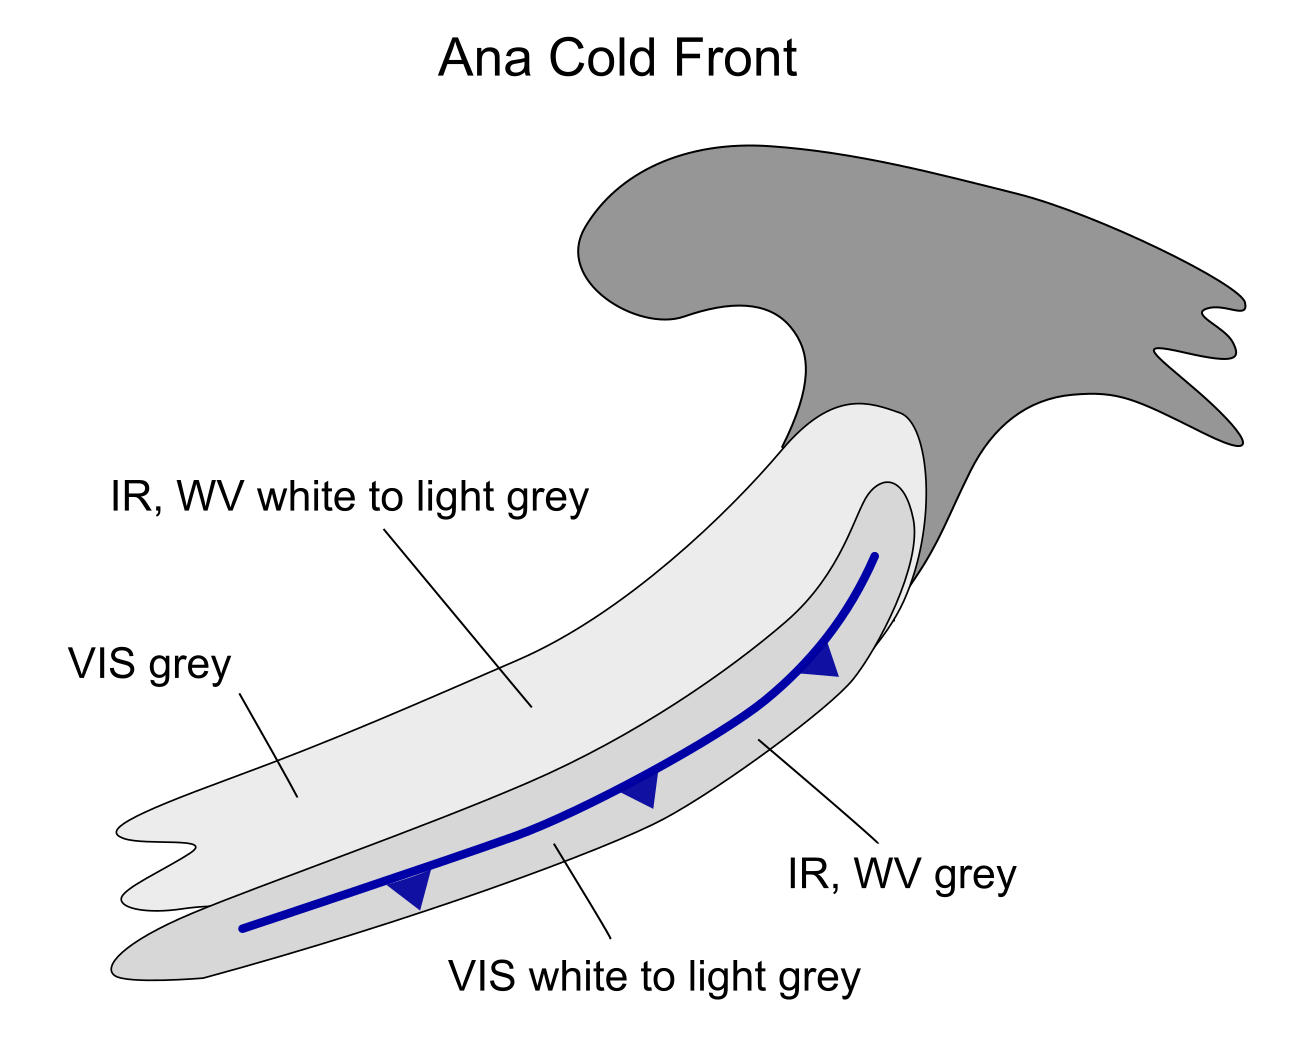
- Generally smooth appearance
- In VIS images, the brightest area is from the leading edge to the middle part of the cloud band, indicating lower water clouds reaching from the lowest cloud base to the mid-troposphere.
- In IR and WV images, the brightest area is from the rear edge to the middle part of the cloud band, indicating cold and high cloud tops at the rear side of the frontal system, often with embedded CBs
Appearance in basic RGBs:
Airmass RGB
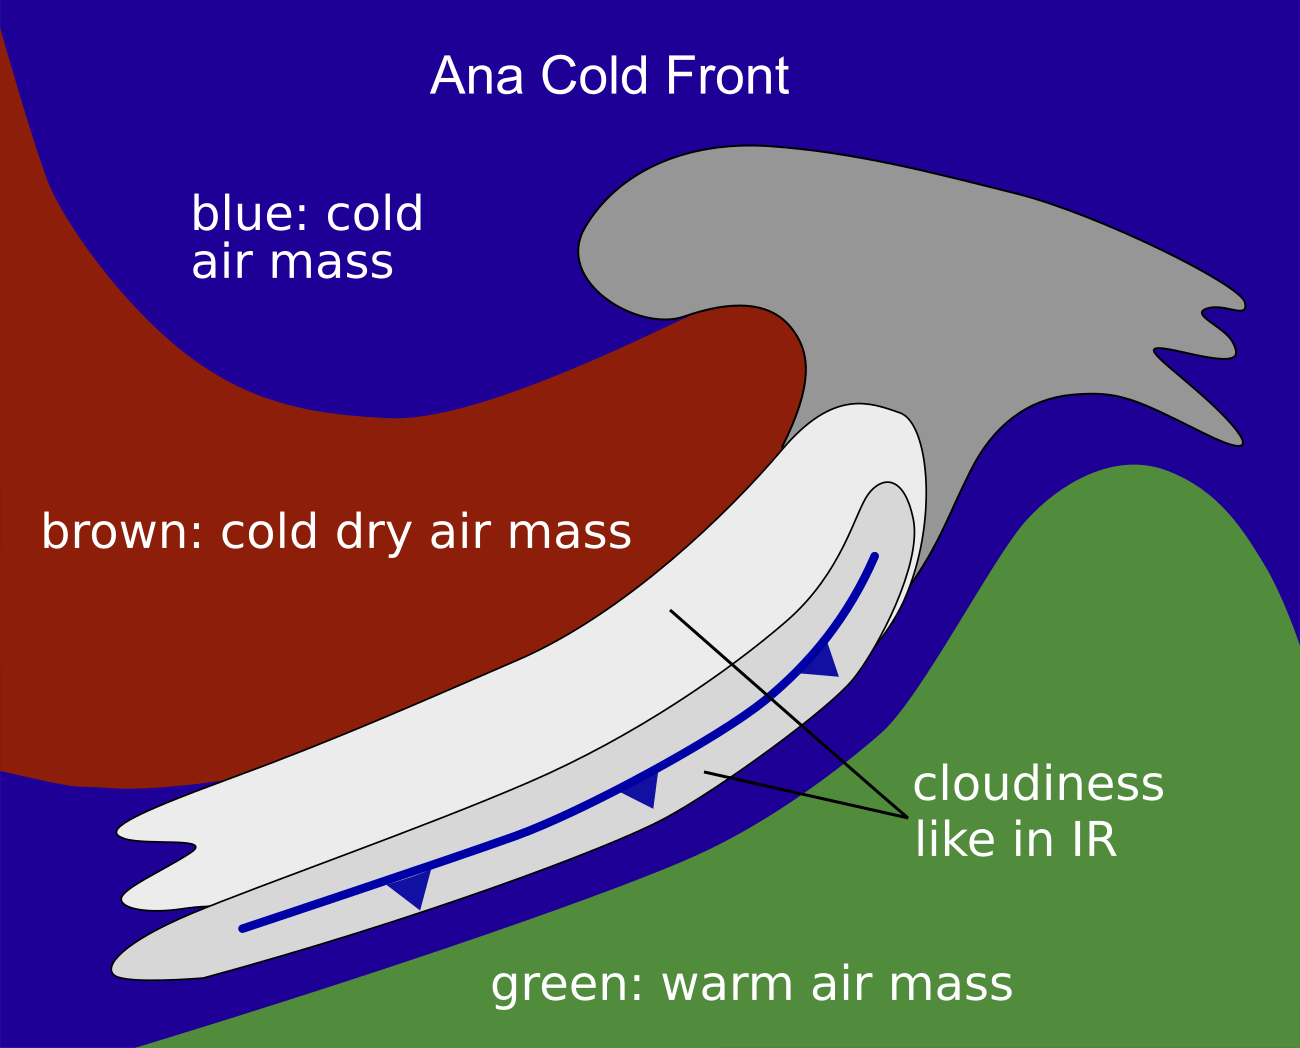
In the Airmass RGB, blue or green colours appear in front of the cloud band, representing the cold or warm air masses ahead of cold fronts (mostly depending on the geographical site being in more southern or northern latitudes); at the rear side of the cloud band blue and brown colours appear, extending from north-northwest turning to a position parallel to the cloud band. These colours are representing the cold and dry air sinking behind the cold front.
The cloud band itself looks very similar in the Airmass RGB to its appearance in the IR image.
Dust RGB
In the Dust RGB the areas in front of and behind of the cloud band are light or pinkish blue, representing cloud free areas; however, these areas usually contain cloud features like cold air cloudiness in the trough behind the cold front cloud band or cloudiness in the thickness ridge in front of the frontal cloud band.
The cloud band is dominated by dark red colours representing thick ice clouds with cold tops; these dark red clouds can be either uniform or structured; in the latter case yellow to light brown colours represent mid-level cloudiness below. Often there is a black stripe at the rearward edge representing a high cloud fibre at the jet axis.
 |
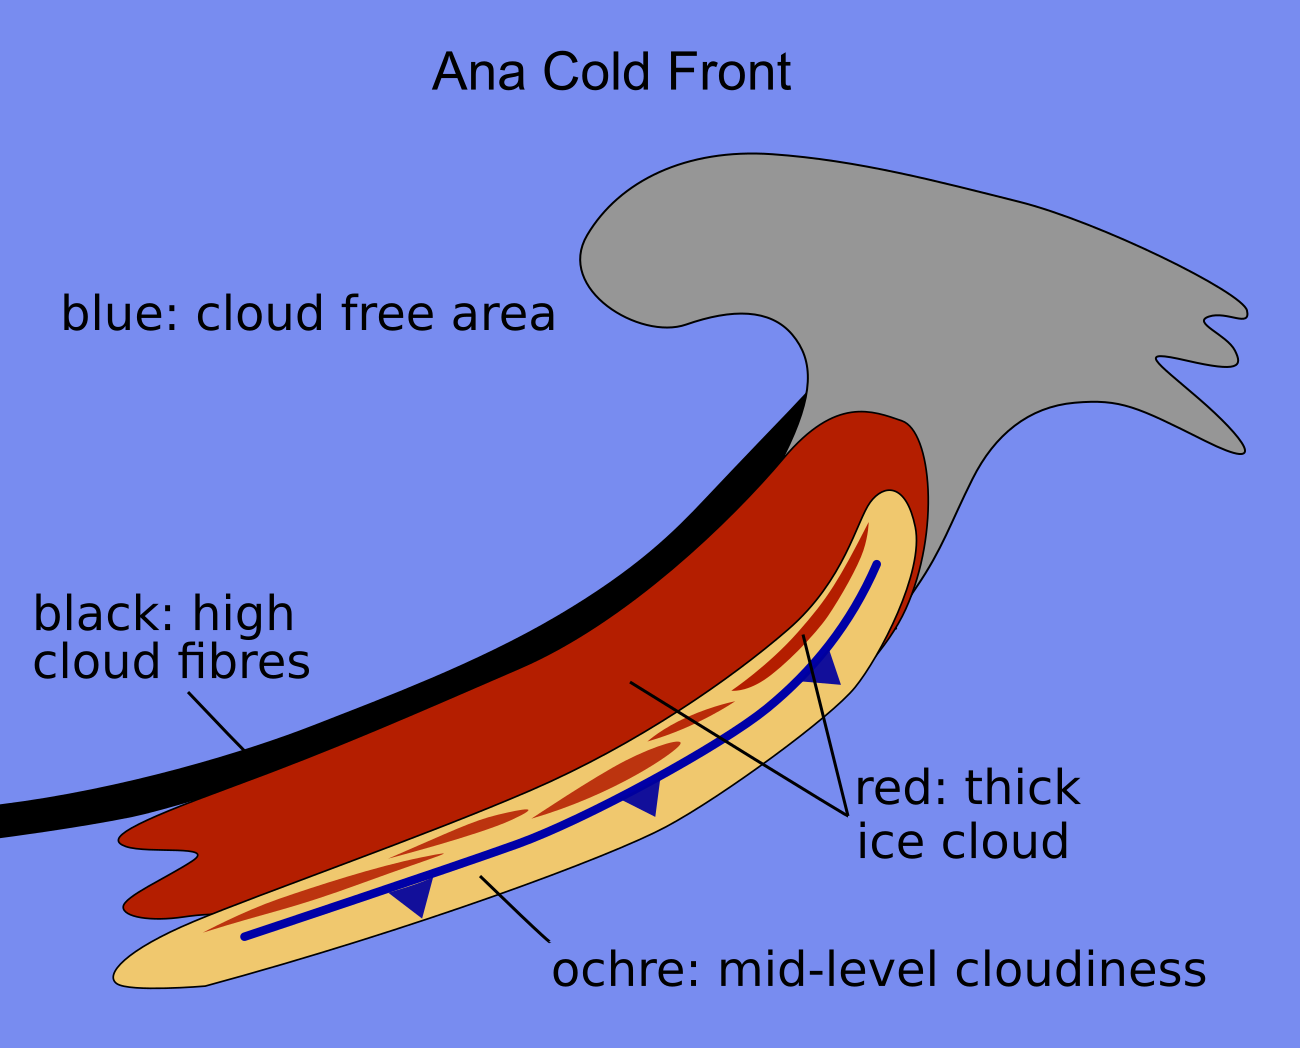 |
Schematics for basic RGBs. Left: Airmass RGB; right: Dust RGB
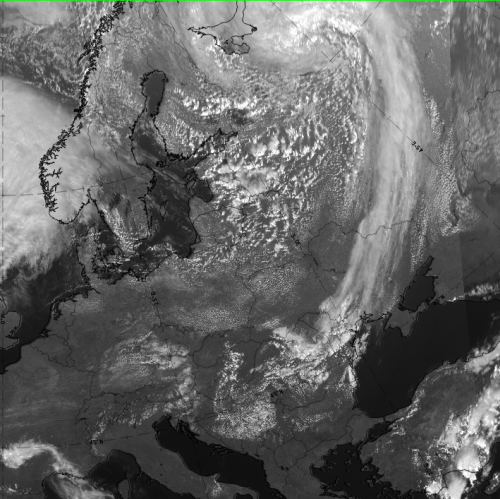
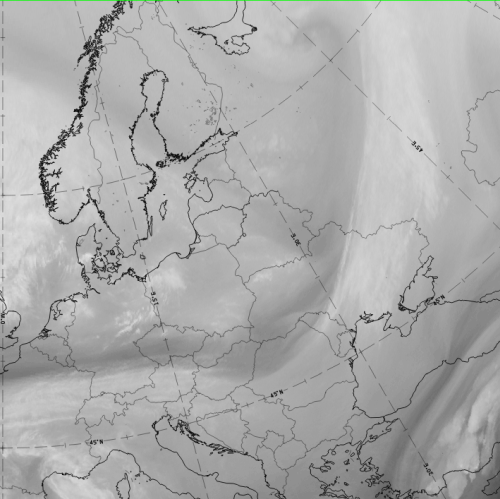
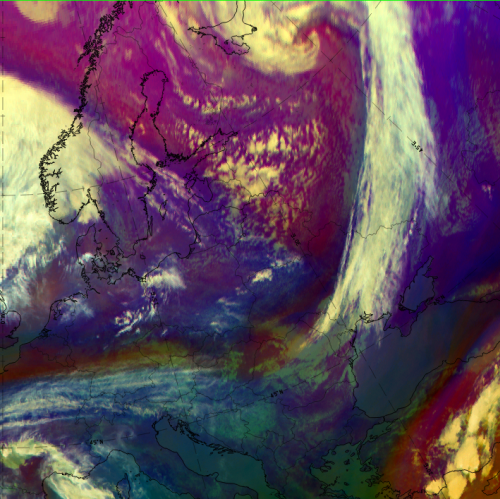
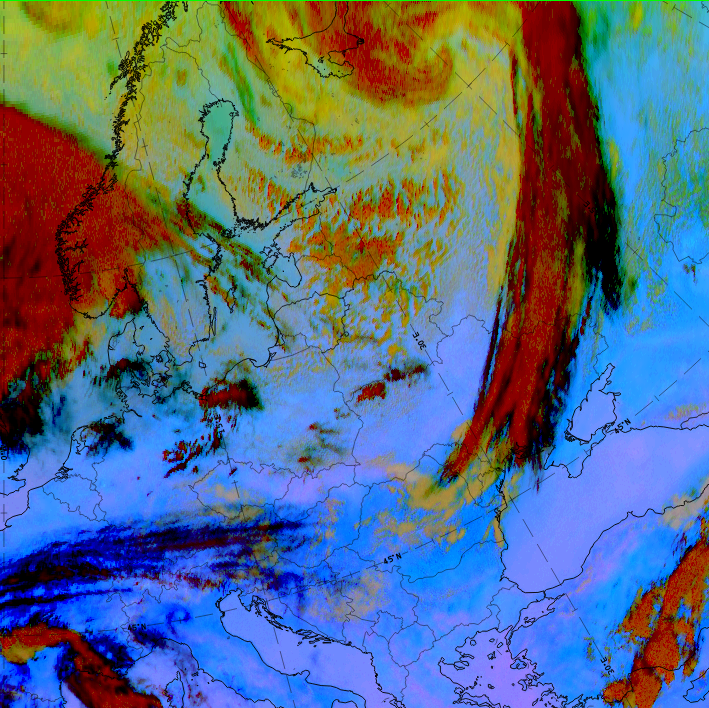
The case of 12 October 2019 at 12 UTC shows a typical example for an Ana Cold Front extending from the Atlantic north-eastward to the Baltic states and Russia.
|
|
|
|
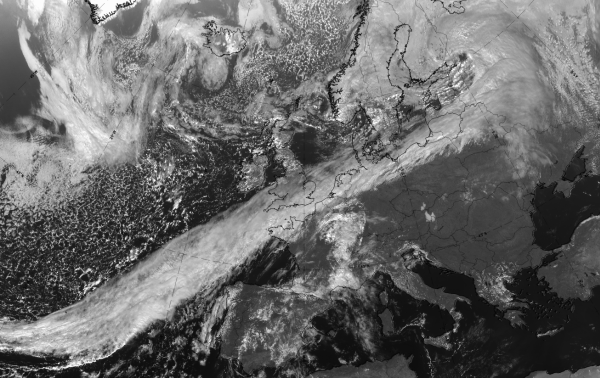
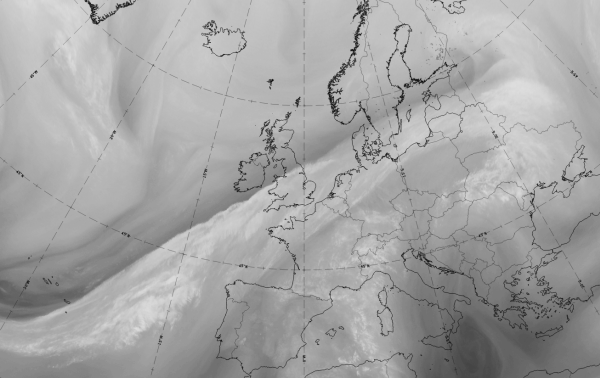
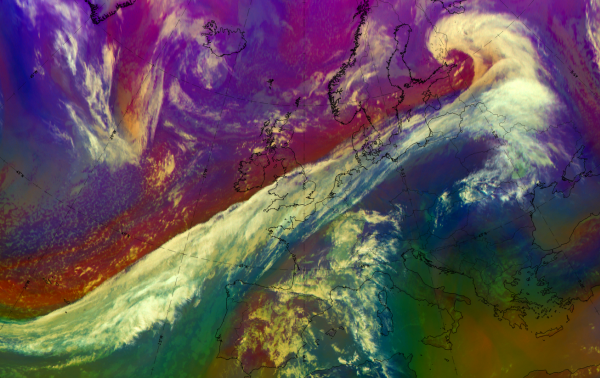
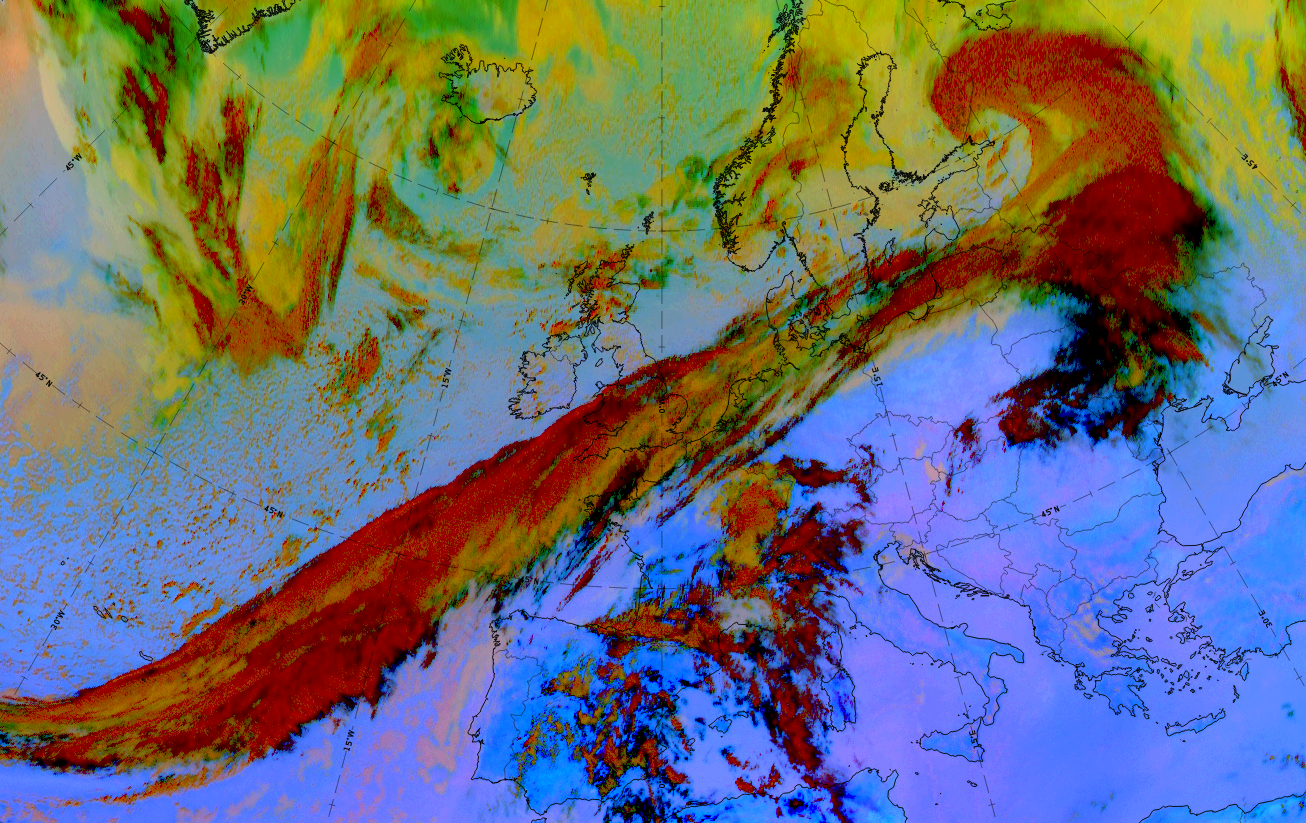
12 October 2019, 12UTC: 1st row: IR (above) + HRV (below); 2nd row: WV (above) + Airmass RGB (below); 3rd row: Dust RGB + image gallery.
*Note: click on the Dust RGB image to access image gallery (navigate using arrows on keyboard)
| IR | Brightest colours in the rearward part of the band. |
| HRV | Brightest colours in the leading part of the band. |
| WV | Light grey with embedded brighter structures and a dark stripe at the rear of and parallel to the cloud band. |
| Airmass RGB | Greenish colours in front of the cloud band (warm air masses); blue colours behind the cloud band (cold air masses); broad brown stripe at the rear of and parallel to the cloud band representing cold and dry air. |
| Dust RGB | Dark red colours (thick ice cloud); ochre colours (mid-level water cloud) at the leading part of the band and where the dark red area is broken; black stripes (high cloud fibres) at the leading and the rearward edges. |
Kata Cold Front
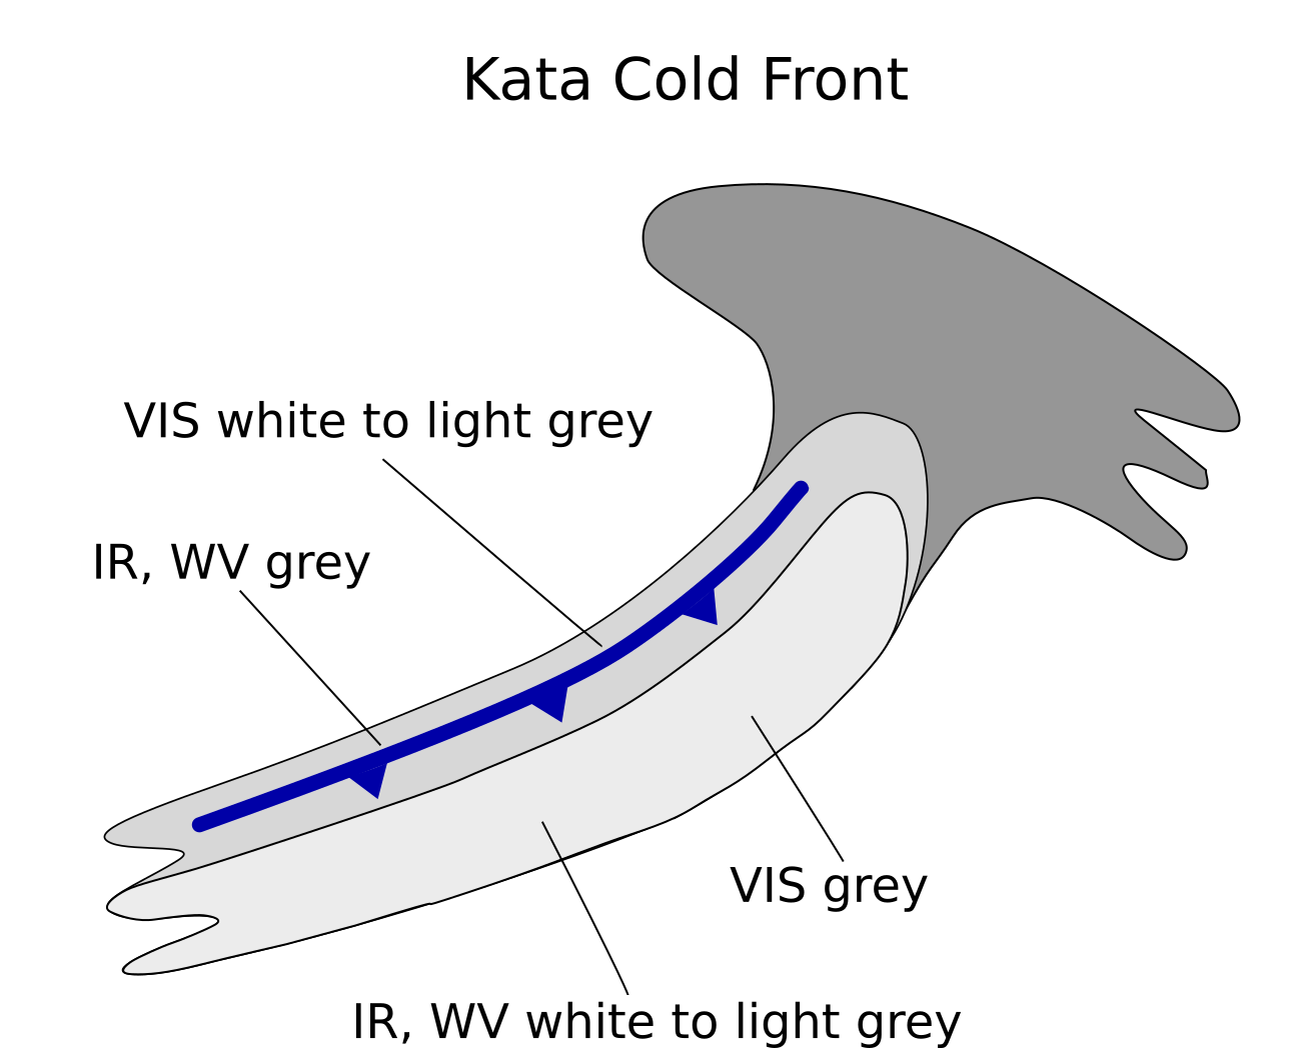
Appearance in the basic channels:
-
- Structured appearance
- In VIS images, the brightest area is from the rear edge to the middle part of the cloud band, indicating lower water clouds.
- In IR and WV images the brightest area is from the leading edge to the middle part of the cloud band, indicating cold and high cloud tops, often with embedded CBs.
Appearance in the basic RGBs:
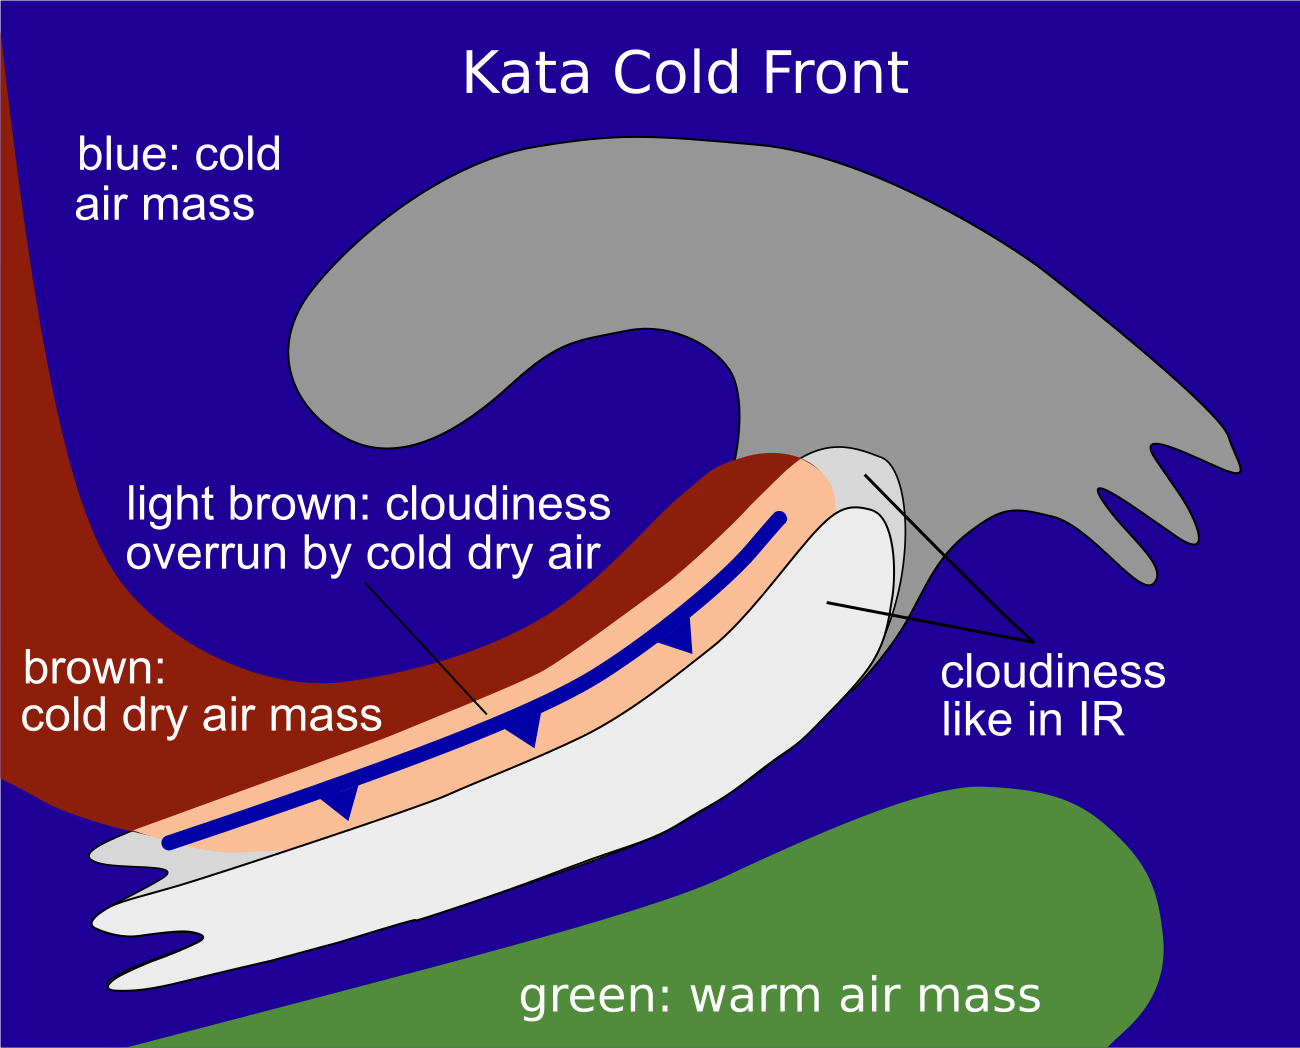
Airmass RGB
At the rear of Kata Cold Fronts, the downward protruding cold air shows up as blue and brown areas indicating the cold and the cold and dry air.
The cloud band of a Kata Cold Front has very similar appearance in the Airmass RGB to that in the IR image; as in case of Kata fronts the jet streak and therefore the dry air on the cyclonic side often penetrate parts of the frontal cloud band and these areas appear with a brownish shadow.
Dust RGB
The surroundings of the Kata Cold Front - especially on the rear side - show blue or pinkish blue colours where there are no clouds below; cloud cells or patches appear mostly in yellowish to ochre colours.
The largest part of the Kata Cold Front cloud band shows as dark red to red-brown colours in the Dust RGB indicating thick ice cloud; yellowish areas between the red-brown areas indicate mid-level cloudiness below and are more extensive than in the ana front case. Often there are black fibres at the leading and rearward edges, indicating high translucent cloud fibres.
 |
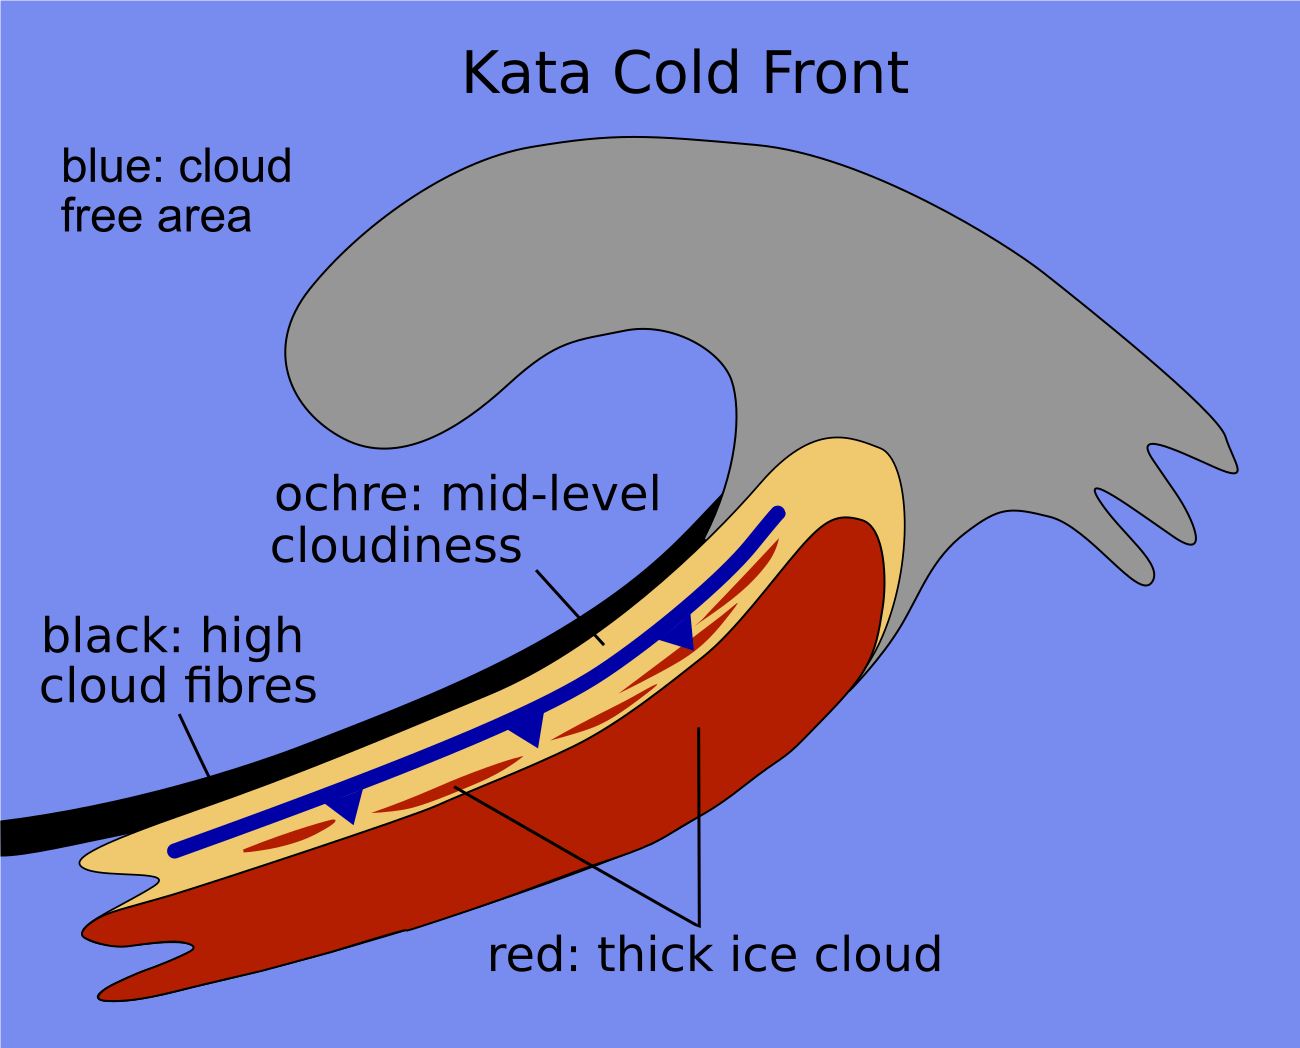 |
Basic RGB schematics. Left: Airmass RGB; right: Dust RGB.
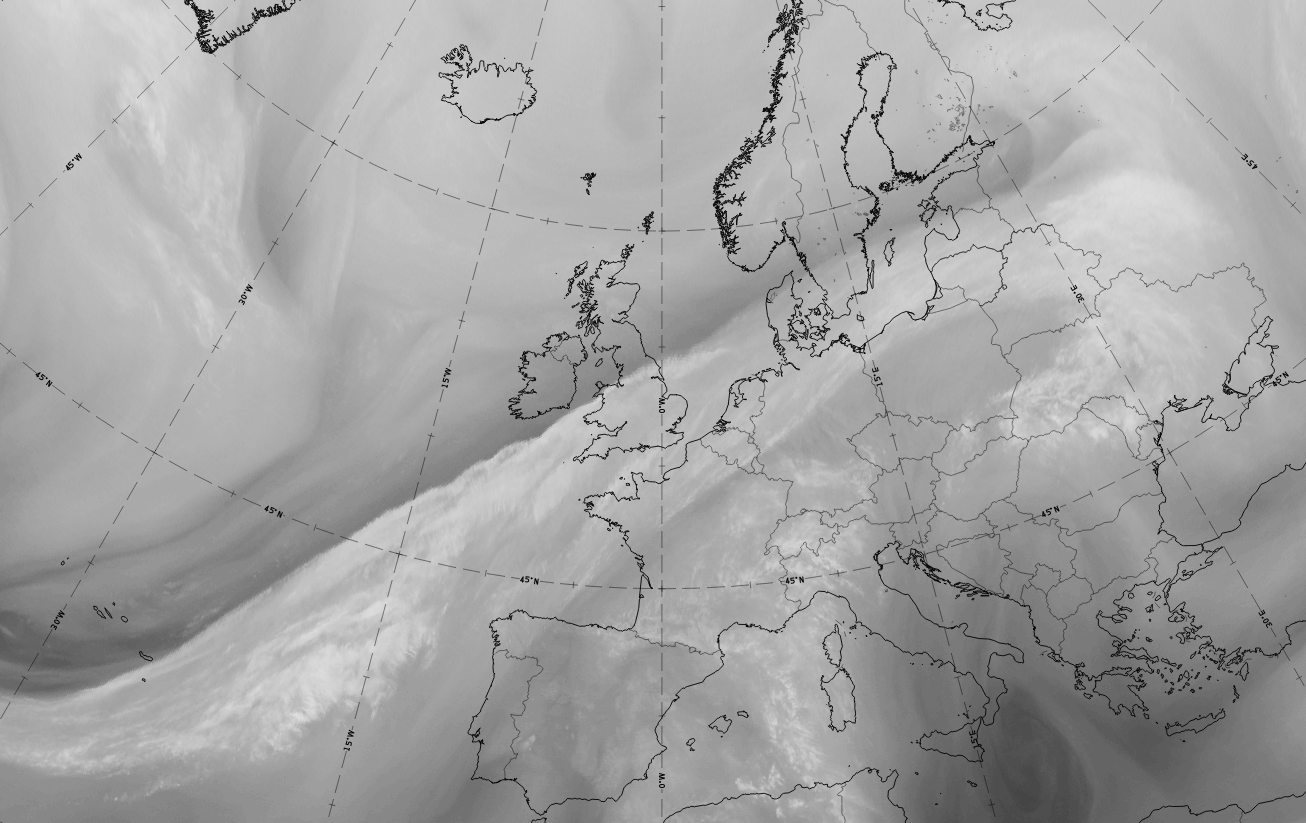
Data from 14 September 2019 at 12 UTC show a very typical example of a Kata Cold Front, which had reached NE Europe, extending from the Ukraine northward into Russia.
|
|
|
|
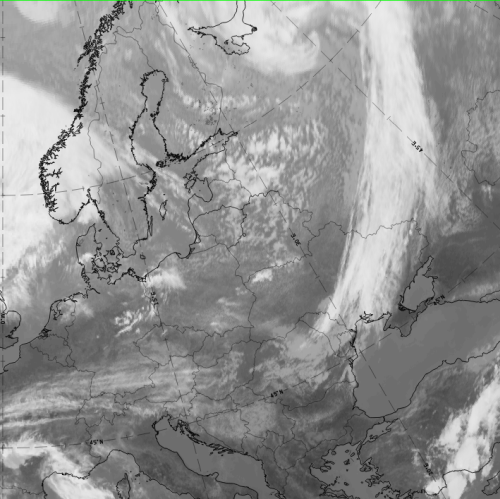
Legend:14 September 2019, 12UTC: 1st row: IR (above)+ HRV (below); 2nd row: WV (above) + Airmass RGB (below); 3rd row: Dust RGB + image gallery.
*Note: click on the Dust RGB image to access image gallery (navigate using arrows on keyboard)
| IR | Bright colours with structures appear over the whole cloud band. |
| HRV | Brightest colours close to the rear side of the band (thick cloud close to the surface front). |
| WV | Light grey with embedded brighter structures and a dark stipe at the rear of and parallel to the cloud band; A second dark stripe across mid-Norway and Sweden, perpendicular to the Kata Cold front band. Penetration of the dry air is not visible in this case. |
| Airmass RGB | At the rear side of the cloud band there are dark blue to brown colours (cold and dry air). The penetrating dry air, which is often a characteristic of a kata type cold front, is in this case only vaguely apparent where the blue area extends nearly perpendicular from the Norwegian coast to NW Ukraine. |
| Dust RGB | Dark red colours (thick ice cloud) in the centre of the cloud band. Very extensive black cloud fibres at the leading and rearward edges. |
It is not always easy to clearly separate Ana and Kata types. During early development the front is usually an Ana type, becoming a Kata-type later. These two types can also exist within the same front.
The structure of a Cold Front can also vary according to other features attached to or embedded within it. Conceptual models include Wave, Upper Wave, Front Intensification by Jet Crossing and Front Decay. A PVA maximum may also produce additional substructures. Kata Cold Fronts can sometimes look like Split Fronts.
Meteorological Physical Background
Fronts generally form within a baroclinic boundary between cold and warm air masses. The main physical process for the development of Cold Fronts is the movement of the cold air against warm air within a classical Polar Front Development. The warm air ascends along the boundary while the cold air sinks below it. If there is enough humidity, the upward motion leads to condensation and to the development of clouds and precipitation.
Cold Fronts can be devided into two types: Ana and Kata Cold Fronts. These types can be described both in terms of classical frontal theory and in terms of conveyor belts.
The main feature which separates the different types of Cold Front is the orientation of the jet relative to the front in the middle and upper levels of the troposphere:
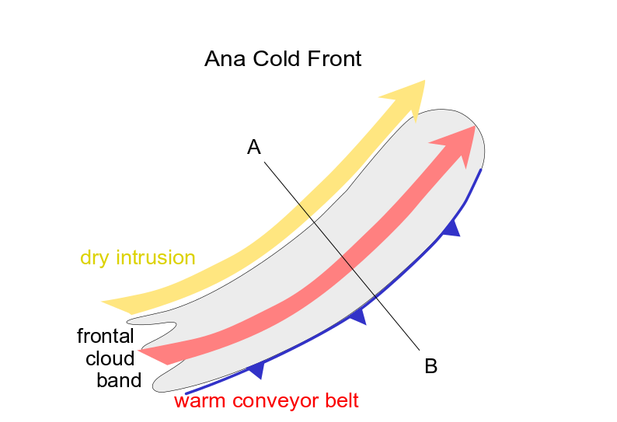
- In the case of an Ana Cold Front, the jet axis and dry intrusion are parallel to the frontal cloud band, and form a well pronounced rear cloud edge.
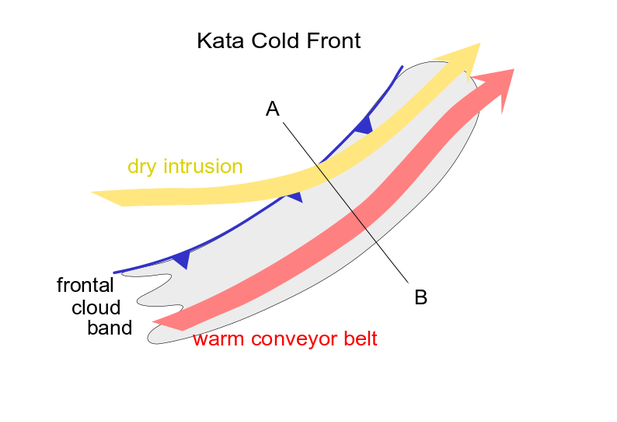
- In the case of a Kata cold front, the jet axis crosses the frontal cloud band.
Discussion
In the literature, as well in the studies carried out by ZAMG and FMI, there are some uncertainties about the structure of Ana and Kata types:
- It is not always completely clear whether a Cold Front is Ana or Kata type.
- Even within the same front Ana and Kata structures can be observed; in these cases Ana features can be found close to the occlusion point, whereas Kata structures prevail in the parts of the front farther away.
- The frontal cloudiness, especially in Kata Cold Front, is often not produced solely by the Warm Conveyor Belt. The rear parts of the cloud band are produced by an upper relative stream orginating from the trough behind the Cold Front. This moist rising stream can sometimes be followed backwards as far as the area of Warm Front clouds. Thus, the upper relative stream is added to the schematics describing the conveyor belt model of the Ana and Kata Fronts.
- There can be parallel or even forward inclined Warm Conveyor Belts. The rearward component at lower levels is due to the ageostrophic wind within the boundary layer, while the parallel or even forward sloping Warm Conveyor Belt in the middle and upper levels is in accordance with the geostrophic wind relationship.
Ana Cold Front
According to the classical theory:
- The cold air moves rapidly against warm air, creating convergence within the baroclinic zone between the two air masses.
- Convergence forces the warm, moist air to ascend along the frontal surface. The developing cloud band is inclined rearward with height.
- The main zone of cloudiness and precipitation is located behind the surface front.
- An exception is a case with strong upper winds which force the high clouds to extend downstream ahead of the surface front.
According to the conveyor belt theory:
- The frontal cloud band and precipitation are related to an ascending Warm Conveyor Belt, which has a rearward component relative to the movement of the front, causing the frontal cloud band and precipitation to appear behind the surface front.
- Parallel to the warm conveyor belt there is a dry stream (dry intrusion). The sharp rear cloud edge of frontal cloudiness marks the transition between the two relative streams.
|
04 October 2005/12.00 UTC - Vertical cross section; black: isentropes (Θe), blue: relative humidity, orange thin:
IR pixel values, orange thick: WV pixel values
|
04 October 2005/12.00 UTC - Meteosat 8 IR 10.8 image; magenta: relative streams 308K - system velocity 236° 15 m/s, yellow:
isobars 308K; position of vertical cross section indicated
|

|
|
The 308K isentropic surface is close to the upper boundary of the frontal zone reaching through the whole troposphere. The frontal cloudiness is under the influence of the Warm Conveyor Belt.
Kata Cold Front
According to classical theory:
- The ascent of warm air is restricted by dry descending air originating from behind the front and, consequently, dissipating the higher clouds.
- The main zones of cloudiness and precipitation appear in front of the surface front.
According to the conveyor belt theory:
- The ascending Warm Conveyor Belt is overrun by the dry intrusion.
- The dry air originates from upper levels of the troposphere or even from the lower levels of the stratosphere, and crosses the Cold Front from behind.
- The warm conveyor belt acquires a component which is inclined forwards relative to the movement of the Cold Front. Therefore, frontal clouds and precipitation tend to lie ahead of the surface front.
- The cloud tops in the area of the dry airstream are relatively low, whereas on the leading edge of this area the cloud tops are higher. This area indicates the so-called upper Cold Front.
- The air mass which is advected by the dry intrusion is colder than the air within the warm conveyor belt. The intrusion cools air above and, later, also ahead of the Cold Front. Furthermore, the air of the upper relative stream has lower equivalent potential temperature. The result is the development of a conditionally unstable layer close to the leading edge of the frontal cloud band. This can be observed as a transformation of layered clouds into convective ones.
|
19 September 2005/12.00 UTC - Vertical cross section; black: isentropes (Θe), blue: relative humidity, orange
thin: IR pixel values, orange thick: WV pixel values
|
19 September 2005/12.00 UTC - Meteosat 8 IR 10.8 image; magenta: relative streams 312K - system velocity 236° 15 m/s, yellow:
isobars 312K; position of vertical cross section indicated
|
|
|
The 312K isentropic surface is close to the upper boundary of the frontal zone. The relative streams show that most parts of the frontal cloud band are under the influence of the moist upper relative stream coming from behind. The Warm Conveyor Belt is only associated with some cloudiness in the leading edge of the cloud band.
There are a lot of similarities between Kata Cold Fronts and Split Fronts (see Split Front). The main difference is the orientation between the jet and the front.
It is generally considered that a Kata Cold Front evolves from an Ana Cold Front. As baroclinic disturbances often develop over the Atlantic, the newly developed Ana Fronts can mainly be found there, whereas older, continental fronts are mostly Kata type. Another reason for the spatial differences might be that the lower parts of the front are decelerated due to the friction of the continent, while the upper parts continue with higher speed.
Key Parameters
- Equivalent thickness
Gradient zone of equivalent thickness:- Ana Cold Front: within the cloud band
- Kata Cold Front: behind the cloud band
- Thermal front parameter (TFP)
The maximum of TFP accompanies the cloud band:- Ana Cold Front: within the leading area of the cloud band
- Kata Cold Front: within the rear area of the cloud band
- Temperature advection
There is relatively weak warm advection ahead of the Cold Front, and pronounced cold advection behind it.- Ana Cold Front: cloudiness usually lies within CA, TA=0 ahead of cloud band
- Kata Cold Front: cloudiness usually lies within WA, TA=0 within the cloud band
- Positive vorticity advection (PVA) in upper levels
PVA maxima can be found near the rear edge of the cloud band indicating the propagation of the upper level trough and/or the approach of a jet streak (see Front Intensification By Jet Crossing). - Isotachs at 300 hPa
- Ana Cold Front: the jet runs behind the cloud band and parallel to it. The jet crosses the frontal system in the area of the occlusion point. The front is on the anticyclonic side of the jet.
- Kata Cold Front: the jet crosses the Cold Front at a sharp angle; according to the jet crossing point the cloud band can be on the anticyclonic or cyclonic side of the jet.
- Shear vorticity at 300 hPa
Zero line of the shear vorticity:- Ana Cold Front: the zero line is close to and parallel to the rear cloud edge
- Kata Cold Front: the zero line crosses the Cold Front; usually it accompanies the transition of the lower cloud tops on the cyclonic side to higher tops on the anticyclonic side of the front.
Equivalent thickness and Thermal Front Parameter (TFP)
|
|
04 October 2005/12.00 UTC - Meteosat 8 IR 10.8 image, Ana front; blue: thermal front parameter (TFP) 500/850 hPa, green: equivalent thickness
500/850 hPa
|
|
|
|
|
19 September 2005/12.00 UTC - Meteosat 8 IR 10.8 image, Kata front; blue: thermal front parameter (TFP) 500/850 hPa, green: equivalent
thickness 500/850 hPa
|
|
|
Temperature Advection and Positive Vorticity Advection (PVA)
|
|
04 October 2005/12.00 UTC - Meteosat 8 IR 10.8 image; red: temperature advection 500/1000 hPa, green: vorticity advection 500 hPa
|
|
|
|
|
19 September 2005/12.00 UTC - Meteosat 8 IR 10.8 image; red: temperature advection 500/1000 hPa, green: vorticity advection 500 hPa
|
|
|
Isotachs and Shear Vorticity 300 hPa
|
|
04 October 2005/12.00 UTC - Meteosat 8 IR 10.8 image; yellow: isotachs 300 hPa, magenta: zero line of shear vorticity
|
|
|
|
|
19 September 2005/12.00 UTC - Meteosat 8 IR 10.8 image; yellow: isotachs 300 hPa, magenta: zero line of shear vorticity
|
|
|
Typical Appearance In Vertical Cross Sections
- Isentropes show a downward inclined gradient zone (frontal zone), which extends through the whole troposphere.
- There is warm advection ahead of the frontal zone and cold advection behind it. The cold advection is much more pronounced than the warm advection.
- In an Ana Cold Front the relative humidity is high ahead of the frontal zone and low behind it. In the case of a Kata Cold Front the area of high humidity is inclined forwards and, therefore, is moving away from the highest surface of the frontal zone with height. In a Kata Cold Front the dry air extends from behind into the frontal zone.
- The frontal zone lies within positive vorticity advection, which increases with height. The maximum is just below the tropopause.
- There is convergence within the frontal zone and divergence above it.
- Omega has negative values (upward motion) within and above the frontal zone. Weak positive values (downward motion) can be found behind the frontal zone.
- Pixel values in satellite images are high in VIS images for both types of Cold Fronts over the frontal zone. In an Ana Cold Front the highest values in IR and WV images coincide with the VIS values, but in a Kata Cold Front they are ahead of the frontal zone.
|
04 October 2005/12.00 UTC - Meteosat 8 IR 10.8 image; position of vertical cross section indicated
|
19 September 2005/12.00 UTC - Meteosat 8 IR 10.8 image; position of vertical cross section indicated
|
|
|
Relative Humidity
|
|
04 October 2005/12.00 UTC - Vertical cross section; black: isentropes (Θe), blue: relative humidity, orange
thin: IR pixel values, orange thick: WV pixel values
|
|
|
|
|
19 September 2005/12.00 UTC - Vertical cross section; black: isentropes (Θe), blue: relative humidity, orange
thin: IR pixel values, orange thick: WV pixel values
|
|

|
Temperature Advection
|
|
19 September 2005/12.00 UTC - Vertical cross section; black: isentropes (Θe), red thick: temperature advection
- WA, red thin: temperature advection - CA, orange thin: IR pixel values, orange thick: WV pixel values
|
|
|
Vorticity Advection
|
|
19 September 2005/12.00 UTC - Vertical cross section; black: isentropes (Θe), green thick: vorticity advection -
PVA, green thin: vorticity advection - NVA, orange thin: IR pixel values, orange thick: WV pixel values
|
|
|
Divergence
|
|
19 September 2005/12.00 UTC - Vertical cross section; black: isentropes (Θe), magenta thick: convergence,
magenta thin: divergence, orange thin: IR pixel values, orange thick: WV pixel values
|
|
|
Vertical motion (Omega)
|
|
19 September 2005/12.00 UTC - Vertical cross section; black: isentropes (Θe),cyan thick: vertical motion (omega) -
upward motion, cyan thin: vertical motion (omega) - downward motion, orange thin: IR pixel values, orange thick: WV pixel values
|
|
|
Weather Events
Weather features are highly variable and can differ from season to season. Features are desribed here for two types of fronts: Ana and Kata Cold Fronts.
Ana Cold Front
| Parameter | Description |
| Precipitation (incl. thunder) |
|
| Temperature |
|
| Wind (incl. gusts) |
|
| Other relevant information |
|
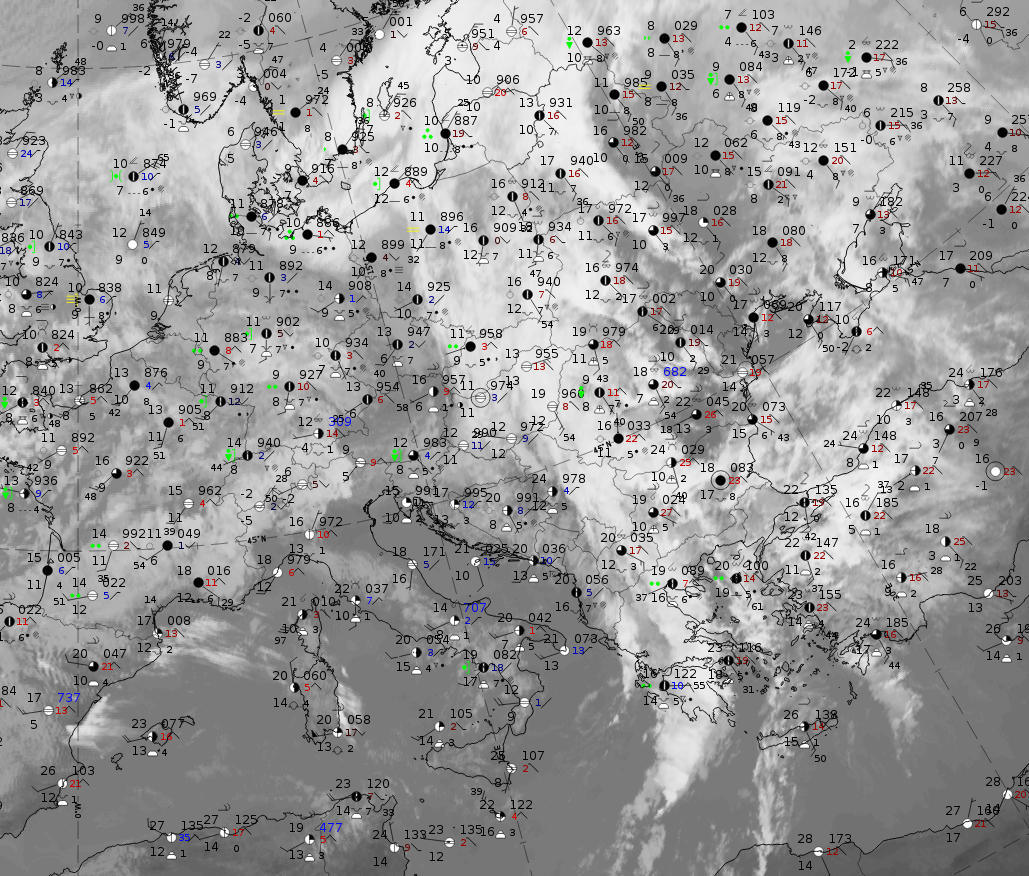
These features are best illustrated using data from 3 September 2019 at 12 UTC when an Ana Cold Front appeared over north-eastern Europe.
3 September 2019,12 UTC: IR image.
|
|
3 September 2019, 12 UTC: IR + synoptic measurements (above) + probability of moderate rain (Precipitting clouds PC - NWCSAF).
Note: for a larger SYNOP image click this link.
Precipitation in the form of showers is widespread, and several reports of Cbs can be seen. A comparison with the precipitation probability from the NWC SAF shows that the precipitation reports correspond to the areas with highest precipitation probability (ochre to red areas) south of about 60° N.
|
|
|
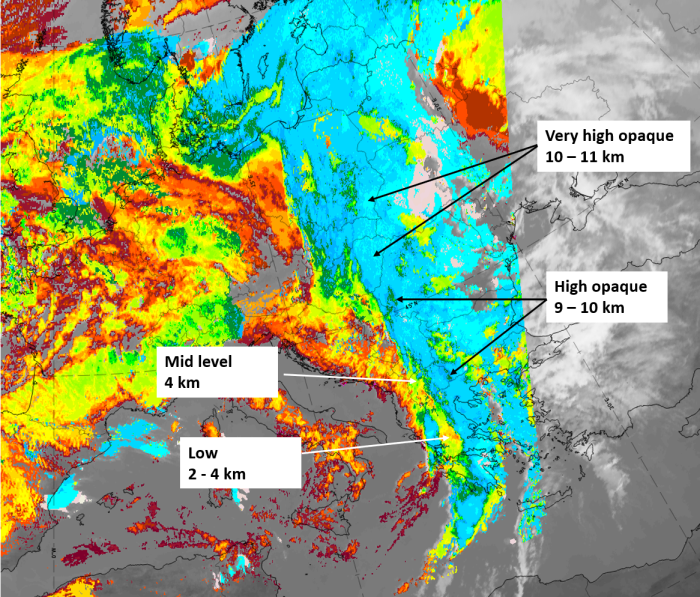
|
3 September 2019, 12 UTC, IR; superimposed:
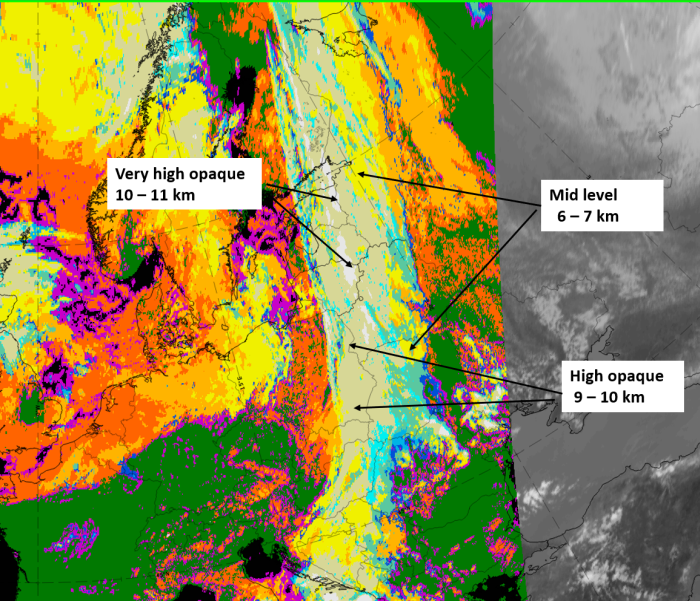
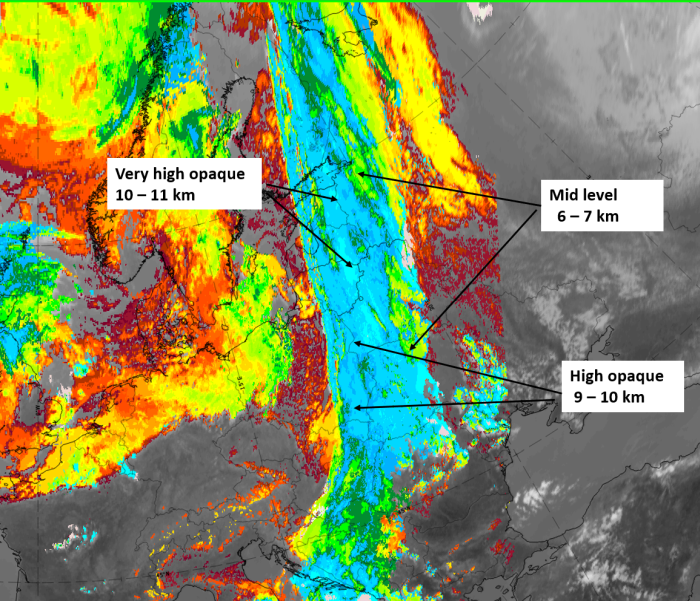
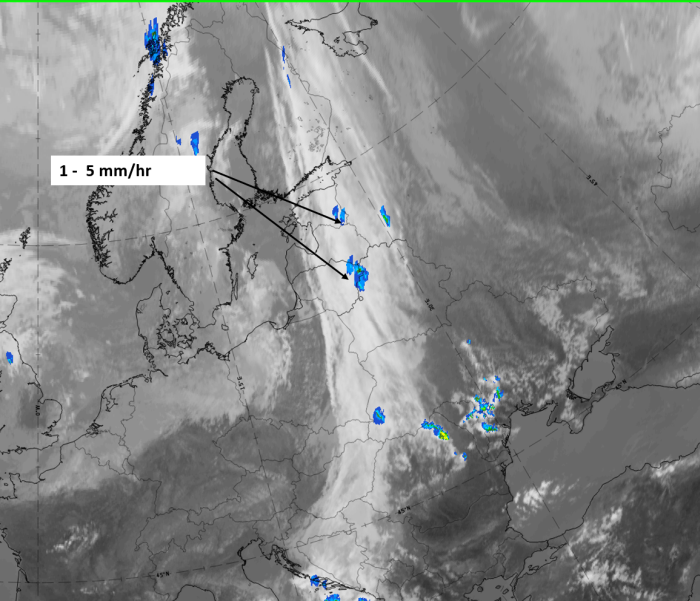
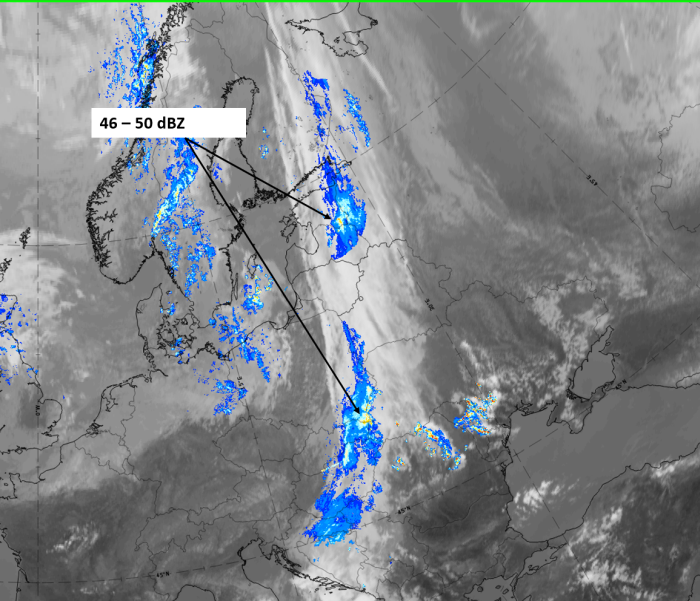
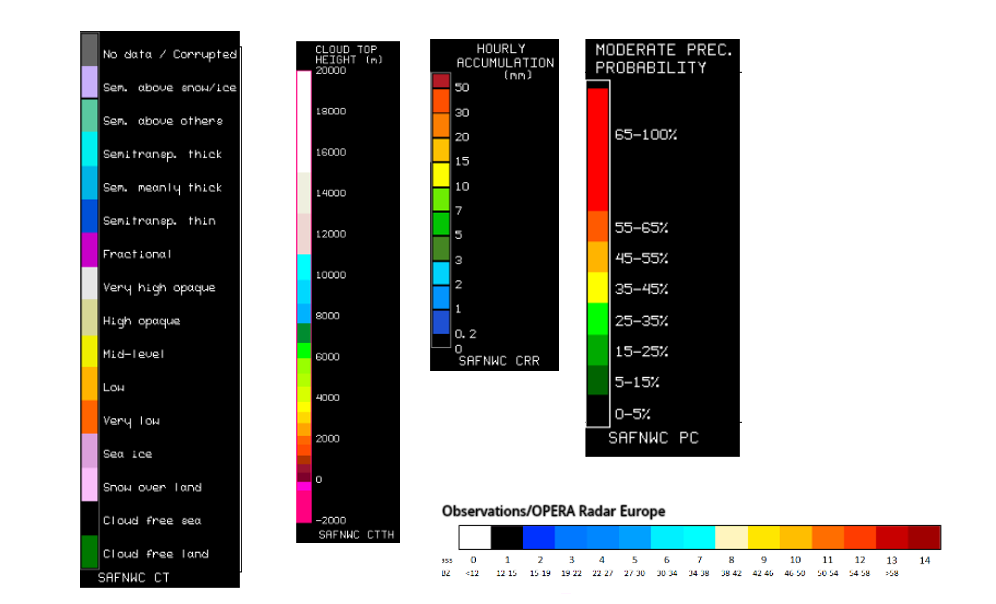
1st row: Cloud Type (CT NWCSAF) (above) + Cloud Top Height (CTTH - NWCSAF) (below); 2nd row: Convective Rainfall Rate (CRR NWCSAF) (above) + Radar intensities from Opera radar system (below)
For identifying values for Cloud type (CT), Cloud type height (CTTH), precipitating clouds (PC), and Opera radar for any pixel in the images look into the legends. (link)
Kata Cold Front
| Parameter | Description |
| Precipitation (incl. thunder) |
|
| Temperature |
|
| Wind (incl. gusts) |
|
| Other relevant information |
|
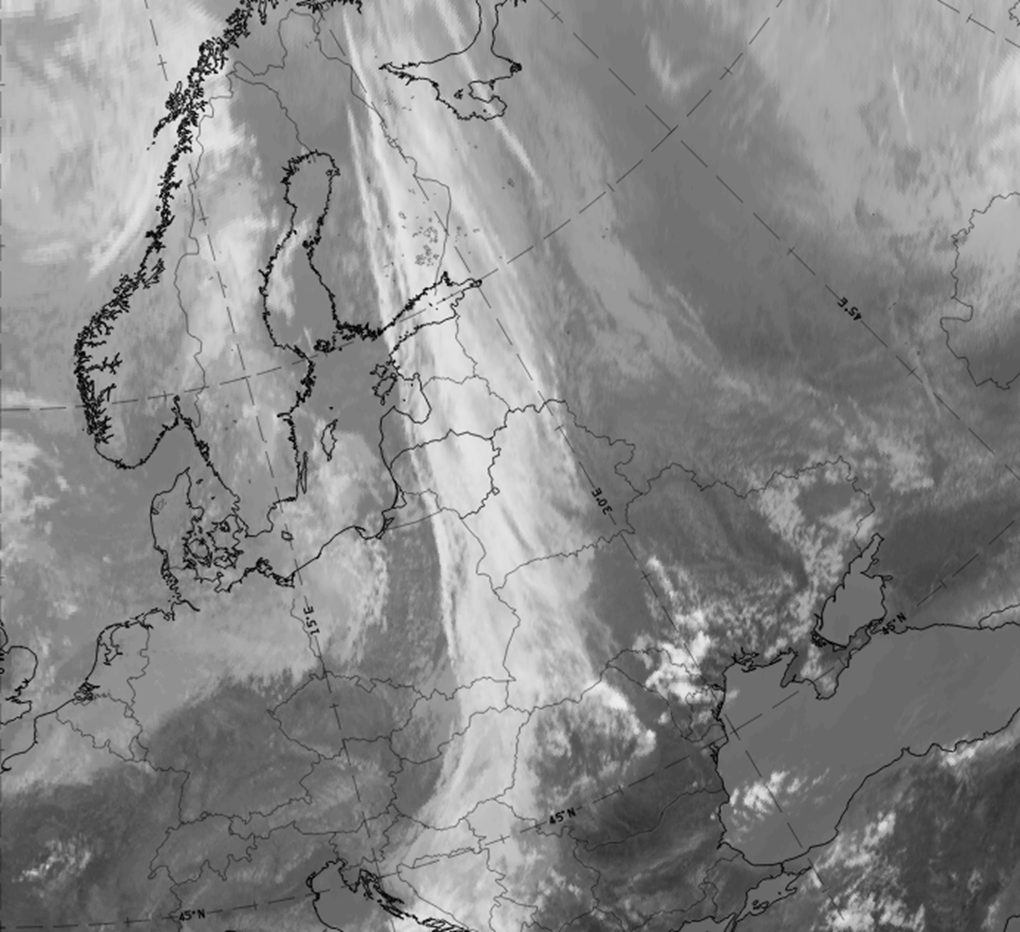
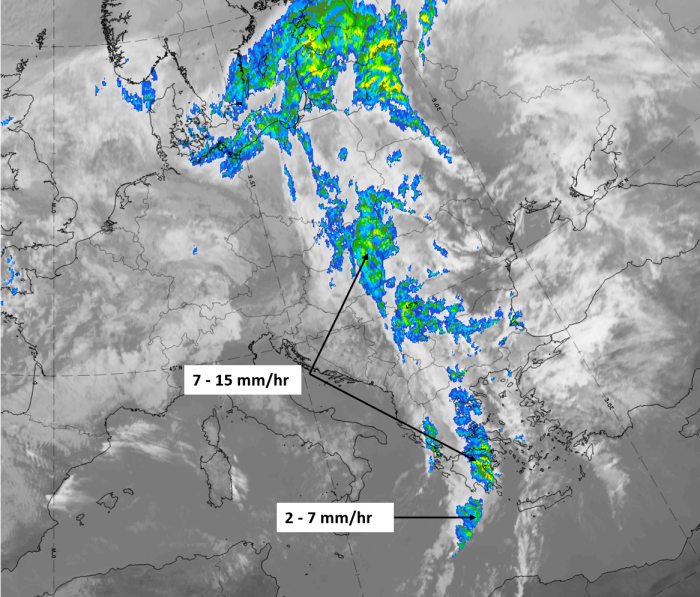
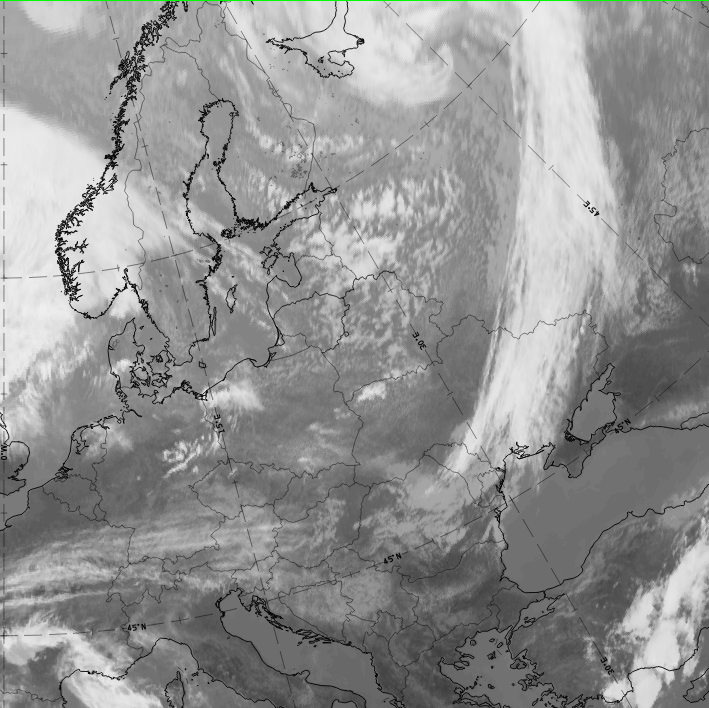
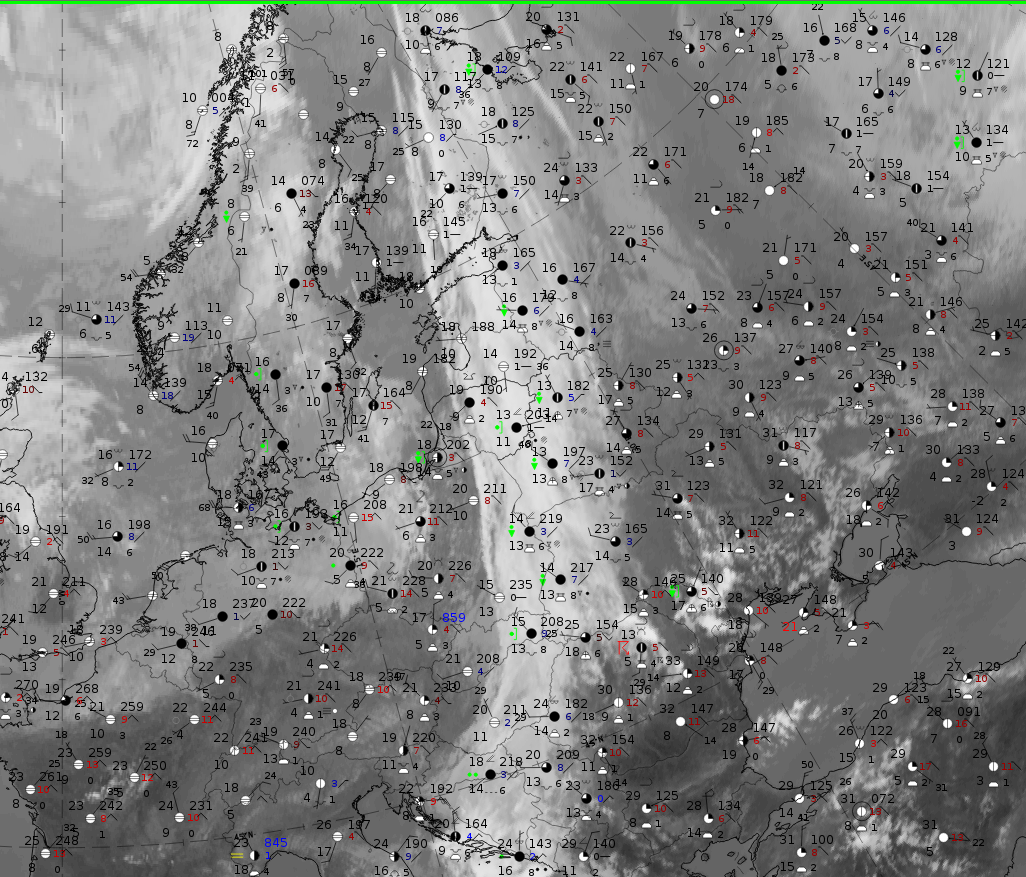
These features are best illustrated using data from 4 November 2019 at 12 UTC, where a Kata Cold Front Band extended from Greece northward across the Balkan Peninsula to Poland.
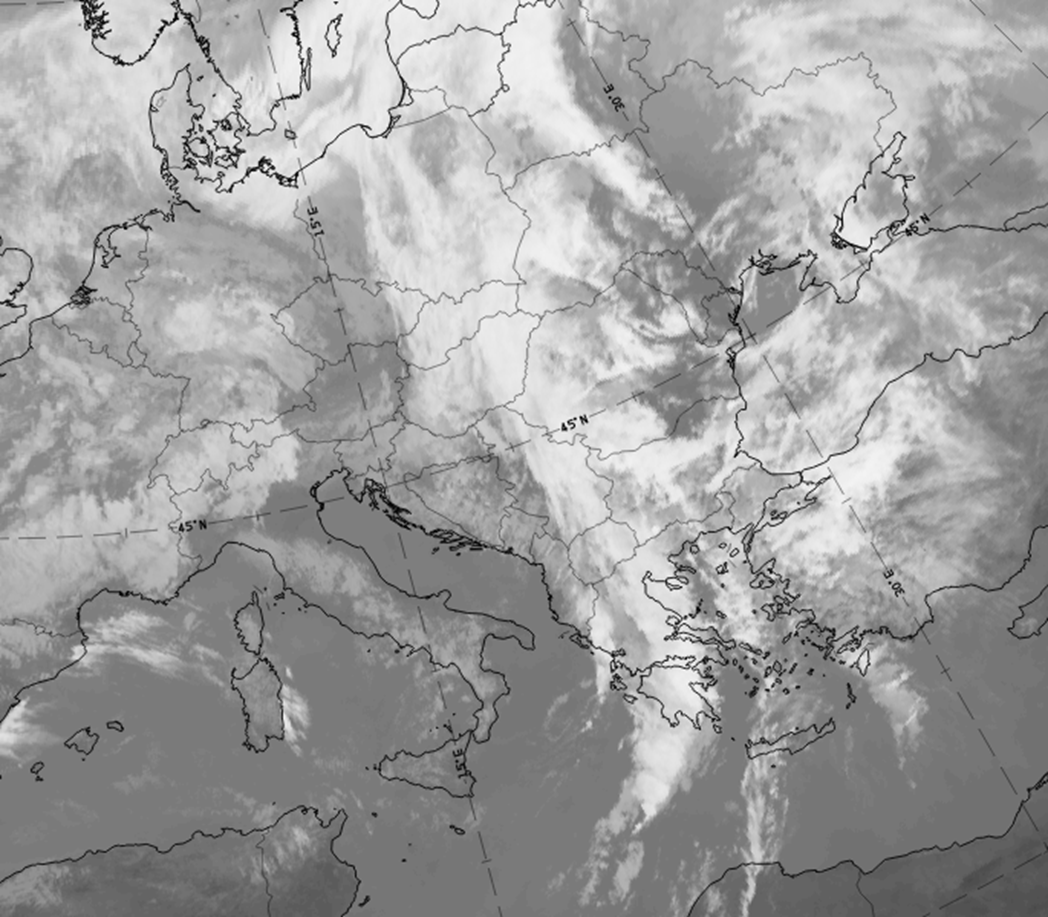
4 November 2019, 12 UTC, IR.
|
|
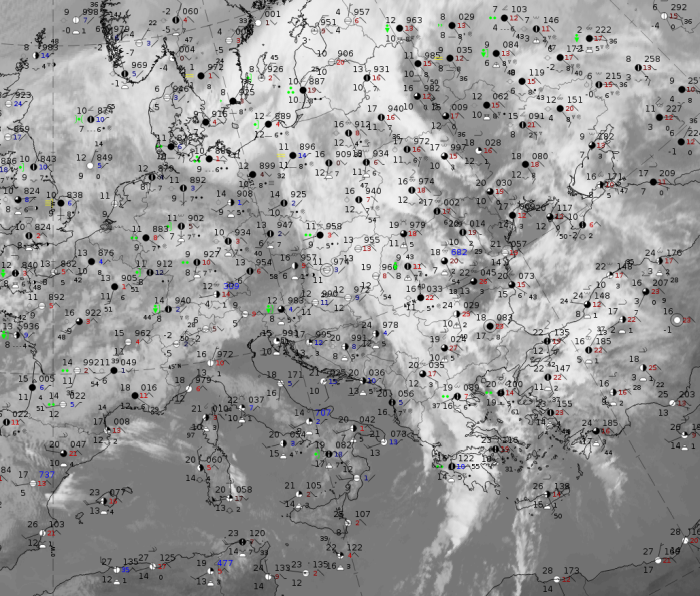
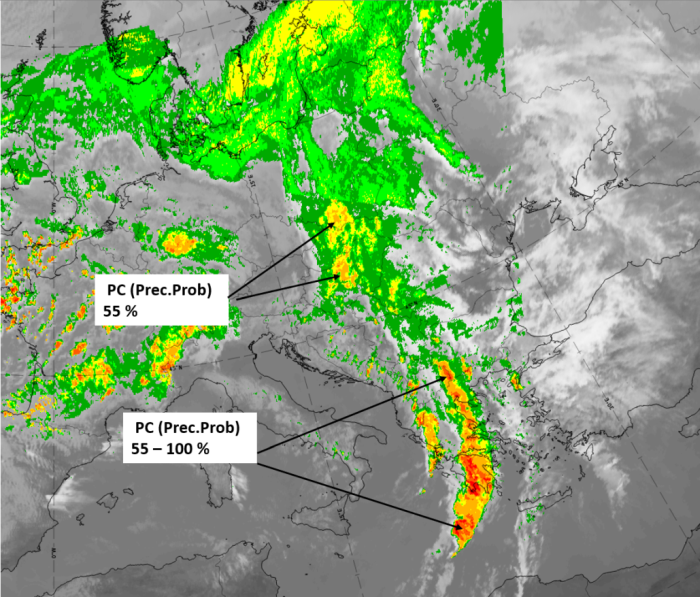
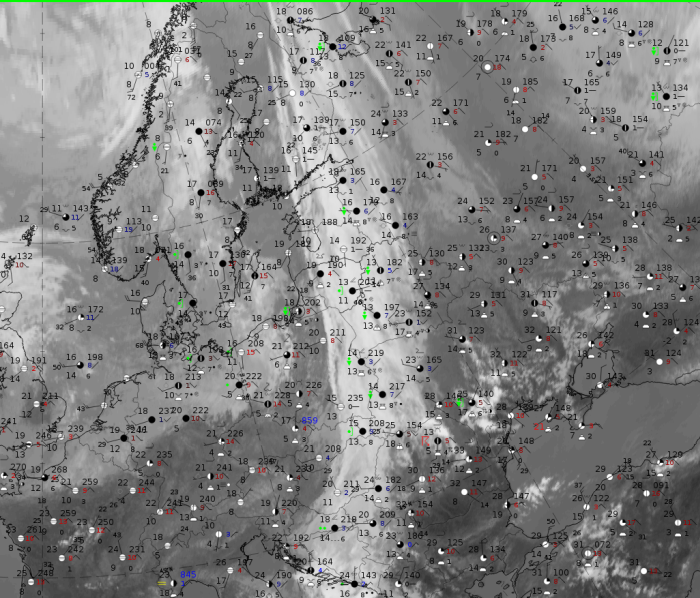
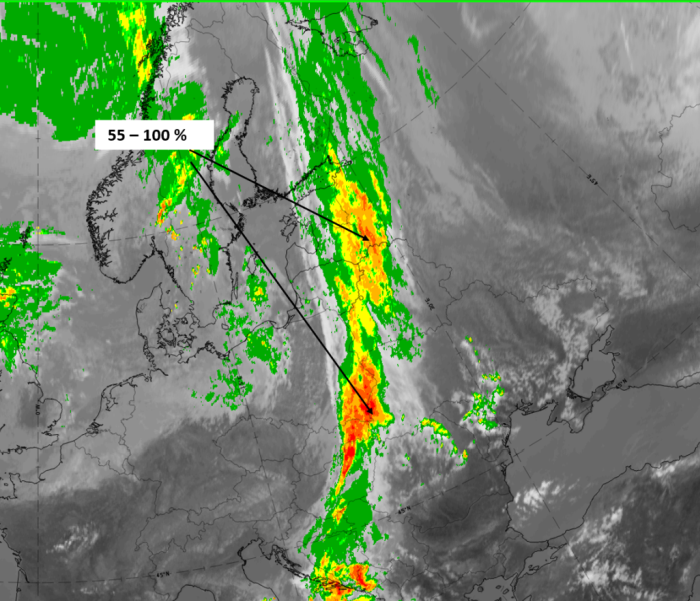
4 November 2019,12 UTC: IR + synoptic measurements (above) + probability of moderate rain (Precipitting clouds PC - NWCSAF).
Note: for a larger SYNOP image click this link.
Rain and shower observations are wide-spread. The shower reports appear more near the leading edge, while rain reports appear more near the rearward edge. The highest precipitation probabilities up to 100 %, are in the southernmost part of the kata cold front cloud band over northern Greece, the Peloponnese and further into the Mediterranean.
|
|
|
|
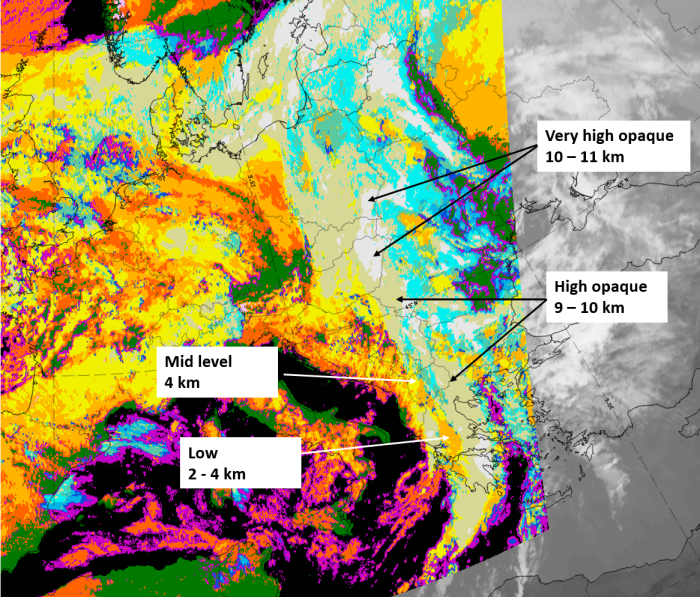
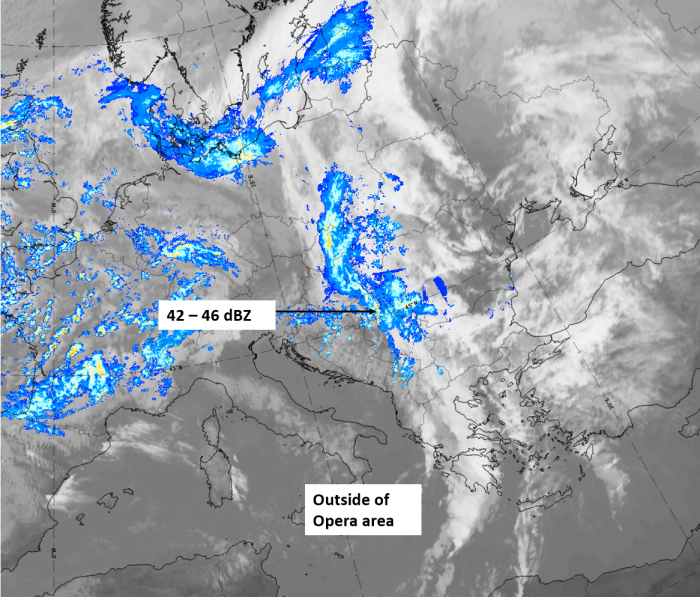
4 November 2019, 12 UTC, IR; superimposed:
1st row: Cloud Type (CT NWCSAF) (above) + Cloud Top Height (CTTH - NWCSAF) (below); 2nd row: Convective Rainfall Rate (CRR NWCSAF) (above) + Radar intensities from Opera radar system (below)
For identifying values for Cloud type (CT), Cloud type height (CTTH), precipitating clouds (PC), and Opera radar for any pixel in the images look into the legends. (link)
Special Investigation: Cold Front/Occlusion
There is group of Cold Front cloud bands that deviates from the ideal configurations almost only in the configuration of the isentropes: instead of the downward inclined zone of high gradients of isentrops a configuration typical for an Occlusion cloud band exists namely an isentropic trough (see Occlusion: Warm Conveyor Belt Type - Typical appearance in vertical cross section).
|
21 November 1999/00.00 UTC - Meteosat IR image; position of vertical cross section indicated
|
21 November 1999/00.00 UTC - Vertical cross section; black: isentropes (Θe), orange thin: IR pixel values, orange
thick: WV pixel values
|
|
|
Although the information from the isentropes in the vertical cross section is rather striking many other indicators support the physical status of a Cold Front instead of an Occlusion:
- the synoptic scale size of the cloud band and the history in the satellite images
- the distribution of the frontal parameters like TFP, thickness and temperature advection.
|
21 November 1999/00.00 UTC - Meteosat IR image; green: height contours 500 hPa, red: height contours 1000 hPa
|
21 November 1999/00.00 UTC - Meteosat IR image; green: thickness, blue: thermal front parameter, red: temperature advection 700 hPa
|
|
|
A detailed investigation of 20 cases identified within one year of Cold Front cases supported the diagnosis of Cold Front. The existence of an Occlusion - like appearance of isentropes comes from a distinct thickness ridge. But this ridge is not the consequence of an Occlusion process (see Occlusion: Warm Conveyor Belt Type - Meteorological physical background) but the result of:
- the approach of the Cold Front to a rather stationary Baroclinic Boundary
- the merging with other CMs like for instance a Detached Warm Front.
Both process lead to pronounced thickness ridges in front of the Cold Front cloud band and therefore show up as isentropic trough in the cross sections.
|
|
|
|
|
Special Investigation: Convective Weather Events Within Or At The Rear Of Frontal Cloud Bands
A frontal zone seen in the satellite image can sometimes deviate from the ideal configuration of a smooth, layered cloud band. This is particularly the case within the cloud band of a Cold Front, but it sometimes also occurs within Occlusions. In such cases the cloud band has a more lumpy characteristic and the tops of embedded Cbs are very distinct in all channels. The reason for this phenomenon is enhanced convection. In most cases the frontal Jet has a distinct component normal to the frontal zone. Convection is enhanced either by PVA in the left exit of the jet streak (see FI by jet) or, when the jet is more or less perpendicular to the front, through a combination of potential instability and frontal convergence (see Split Front). There are also cases in which the jet is parallel to the frontal cloud band, but there is also strong convection within the frontal zone.
|
19 October 2004/12.00 UTC - Meteosat IR 10.6 image; position of vertical cross sections indicated
|
19 October 2004/12.00 UTC - Meteosat IR 10.6 image; blue: wind 300 hPa
|
|
|
Investigations were made of 50 Cold Fronts, 25 of the layered type and 25 of the convective type, as detected from the Satellite image. The period covered the four seasons of the year from September 2003 till October 2004. Ten parameters where examined included the key parameters of all types of described Cold Front in the SatRep Manual. Statistical difference significance was only found with the humidity in the higher levels, and in the instability index (Boyden). In the case of a convective front, the 500 hPa humidity had a significantly lower value than the humidity in a more layered, smooth Cold Front. In a convective Cold Front the main value of the Boyden Index was above 95 which means high risk of thunderstorms, whilst in layered fronts the main value was around 94 which is below the threshold value for risk of thunderstorms. The convective Cold Fronts tends to be more of the Kata type. Marked differences with season were not found.
|
19 October 2004/12.00 UTC - Meteosat IR 10.6 image; red: Boyden index, cyan: TFP
|
19 October 2004/12.00 UTC - HRVIS image
|
|
|
The most distinct difference (see image above left) between a convective and a non convective Cold Front is seen in the
combination of instability index with the thermal front parameter. In the case of a convective Cold Front, high values of the instability index
lie within the maximum of TFP, whilst in a layered Cold Front, high values of instability index are found behind the TFP, and further away from
the Cold Front, in the cold air.
The physical explanation of the differences between the two front types has to be found in the differentiation between instability in the lower
parts of the troposphere and the potential instability. In the case of a convective front, the values of both are much higher than within a
layered Cold Front. The Cross Sections below show this clearly. The convective front (left) has a strong potential instability up to 700 hPa,
over a broad zone, while the layered front (right) only has weak potential instability up to 800 hPa.
The cross section on the left is of the convective front, west of Portugal, and the one on the right is through the layered Cold Front over the
British Isles.
|
19 October 2004/12.00 UTC - Vertical cross section; green: relative humidity, ochre: wet bulb temperature (Θw)
|
19 October 2004/12.00 UTC - Vertical cross section; ochre: wet bulb temperature (Θw)
|
|
|
References
General Meteorology and Basics
- BENNETTS D. A., GRANT J. R. and MCCALLUM E. (1988): An introductory review of fronts. Part I: Theory and observations; Met. Mag., Vol. 117, p. 357 - 370
- BENNETTS D. A., GRANT J. R. and MCCALLUM E. (1989): An introductory review of fronts, Part II: A case study; Met. Mag., Vol. 118, p. 8 - 12
- BROWNING K. A. and GOLDING B. W. (1994): Mesoscale effects of a dry intrusion within a vigorous cyclone; JCMM - internal report 29
- CARLSON T. N. (1980): Airflow through mid-latitude cyclones and the comma cloud pattern; Mon. Wea. Rev., Vol. 108, p. 1498 - 1509
- CONWAY B. J., GERARD L., LABROUSSE J., LILJAS E., SENESI S., SUNDE J. and ZWATZ-MEISE V. (1996): COST78 Meteorology - Nowcasting, a survey of current knowledge, techniques and practice - Phase 1 report; Office for official publications of the European Communities
- GREEN J. S. A., LUDLAM F. H. and MCILVEEN J. F. R. (1966): Isentropic relative-flow analysis and the parcel theory; Quart. J. R. Meteor. Soc., Vol. 92, p. 210 - 219
- HARROLD T. W. (1973): Mechanisms influencing the distribution of precipitation within baroclinic disturbances; Quart. J. R. Meteor. Soc., Vol. 99, p. 232 - 251
- HERZEGH P. H. and HOBBS P. V. (1981): The mesoscale and microscale structure and organization of clouds and precipitation in mid-latitude cyclones. Part IV: Vertical air motions and microphysical structures of prefrontal surge clouds and cold frontal clouds; J. Atmos. Sci., Vol. 38, p. 1771 - 1784
- HUBER-POCK F. and KRESS CH. (1989): An operational model of objective frontal analysis based on ECMWF products; Met. Atmos. Phys., Vol. 40, p. 170 - 180
- KURZ M. (1990): Synoptische Meteorologie - Leitfäden für die Ausbildung im Deutschen Wetterdienst; 2. Auflage, Selbstverlag des Deutschen Wetterdienstes
General Satellite Meteorology
- BADER M. J., FORBES G. S., GRANT J. R., LILLEY R. B. E. and WATERS A. J. (1995): Images in weather forecasting - A practical guide for interpreting satellite and radar imagery; Cambridge University Press
- CARLSON T. N. (1987): Cloud configuration in relation to relative isentropic motion; in: Satellite and radar imagery interpretation, preprints for a workshop on satellite and radar imagery interpretation - Meteorological Office College, Shinfield Park, Reading, Berkshire, England, 20 - 24 July 1987, p. 43 - 61
- ZWATZ-MEISE V. (1987): Satellitenmeteorologie; Springer Verlag, Berlin - Heidelberg - New York - London - Paris - Tokyo
Specific Satellite Meteorology
- BROWNING K. A. and HARROLD T. N. (1970): Air motion and precipitation growth at a cold front; Quart. J. R. Meteor. Soc., Vol. 96, p. 369 - 389
- BROWNING K. A. and PARDOE C. W. (1973): Structure of low-level jet streams ahead of mid-latitude cold fronts; Quart. J. R. Meteor. Soc., Vol. 99, p. 619 - 638
- BROWNING K. A. and MONK G. A. (1982): A simple model for the synoptic Analysis of cold fronts; Quart. J. R. Meteor. Soc., Vol. 108, p. 435 - 452
- BROWNING K. A. (1985): Conceptual models of precipitation systems; Quart. J. R. Meteor. Soc., Vol. 114, p. 293 - 319
- BROWNING K. A. (1986): Conceptual models of precipitation systems; Weather&Forecasting, Vol. 1, p. 23 - 41
- BROWNING K. A. and REYNOLDS R. (1993): Diagnostic study of a narrow cold frontal rainband and severe winds associated with a stratospheric intrusion; JCMM - internal report 7
- BROWNING K. A. (1994): On the nature of convective circulations at a kata-cold front; JCMM - internal report 35
- HOBBS P. V. and HOUZE R. A. JR. (1980): The mesoscale and microscale structure and organization of clouds and precipitation in mid-latitude cyclones. Part I: A case study of a cold front; J. Atmos. Sci., Vol. 37, p. 568 - 596
- HOSKINS B. J. and HECKLEY W. A. (1981): Cold and warm fronts in baroclinic waves; Quart. J. R. Meteor. Soc., Vol. 107, p. 79 - 90
- JAMES P. K. and BROWNING K. A. (1979): Mesoscale structure of line convection at surface cold fronts; Quart. J. R. Meteor. Soc., Vol. 105, p. 371 - 382
- RUTLEDGE S. A. and HOBBS P. V. (1983): The mesoscale and microscale structure and organization of clouds and precipitation in mid-latitude cyclones. Part XII: A diagnostic modelling study of precipitation development in narrow cold-frontal rainbands; J. Atmos. Sci., Vol. 41, p. 2949 - 2972
- WANG P.-Y., PARSONS D.B. and HOBBS P. V. (1983): The mesoscale and microscale structure and organization of clouds and precipitation in mid-latitude cyclones. Part VI: Wavelike rainbands associated with a cold-frontal zone; J. Atmos. Sci., Vol. 40, p. 543 - 558