Cloud Structure In Satellite Images
A typical area with a high probability for the initiation of convection is the area of the warm sector in front of and some distance away from a frontal cloud band. Initiation of convection only happens in cases where the troposphere has a specific structure (see Meteorological physical background and Key parameters ).
|
08 August 2004/18.00 UTC - Meteosat 8 IR 10.8 image
|
08 August 2004/17.00 UTC - Meteosat 8 VIS 0.6 image
|
|
|
The satellite images above show a number of developing Convective Cells over France. In both images (IR 10.8, VIS 0.6) the cells are characterized by more or less bright pixel values indicating high thick and/or multi-level cloudiness. In the IR 10.8 image (left image) the cells have sharp cloud edges. In contrast, the VIS image only shows sharp cloud edges at the upstream edge of the cloud mass (area close to the weather-active part) while the downstream edge is more fibrous and translucent. This part characterises the area of the anvil. This translucent part can also well be seen with an artifical RGB comprised of the brightness temperature difference (BTD) of IR 12.0 - IR 10.8 on red; IR 10.8 - IR 8.7 on green and channel IR 10.8 on blue.
|
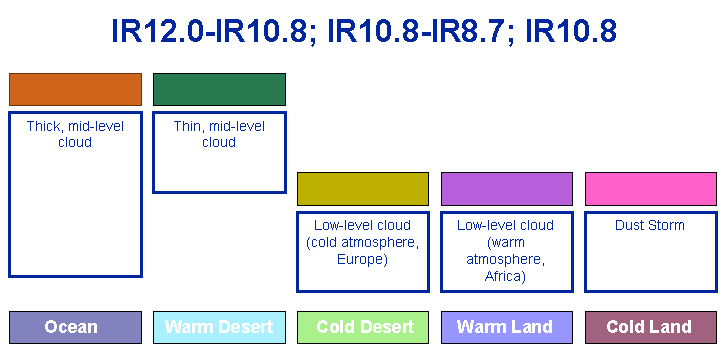
08 August 2004/18.00 UTC - Meteosat 8 Dust-RGB (IR12.0-IR10.8, IR10.8-IR8.7 and IR10.8)
|
|
|
The convective cells found in the warm sector are easily recognised in this RGB as the orange cells. The BTD between IR12.0 and IR10.8, which is projected on the red beam, is a measure of the optical thickness. As the thickness of the clouds become less so does the colour change from orange to green. The translucent part or cirrus shield is recognised as the green areas. This RGB is also known as the Dust-RGB, which becomes clear when observing the dustcloud (pictured in pink) over Northern Algeria and the Mediterranean in the above image. What the other colours in this RGB represent can be found out when clicking here .