Table of Contents
Cloud Structure In Satellite Images
A typical area with a high probability for the initiation of convection is the area of the warm sector in front of and some distance away from a frontal cloud band. Initiation of convection only happens in cases where the troposphere has a specific structure (see Meteorological physical background and Key parameters ).
|
08 August 2004/18.00 UTC - Meteosat 8 IR 10.8 image
|
08 August 2004/17.00 UTC - Meteosat 8 VIS 0.6 image
|
|
|
The satellite images above show a number of developing Convective Cells over France. In both images (IR 10.8, VIS 0.6) the cells are characterized by more or less bright pixel values indicating high thick and/or multi-level cloudiness. In the IR 10.8 image (left image) the cells have sharp cloud edges. In contrast, the VIS image only shows sharp cloud edges at the upstream edge of the cloud mass (area close to the weather-active part) while the downstream edge is more fibrous and translucent. This part characterises the area of the anvil. This translucent part can also well be seen with an artifical RGB comprised of the brightness temperature difference (BTD) of IR 12.0 - IR 10.8 on red; IR 10.8 - IR 8.7 on green and channel IR 10.8 on blue.
|
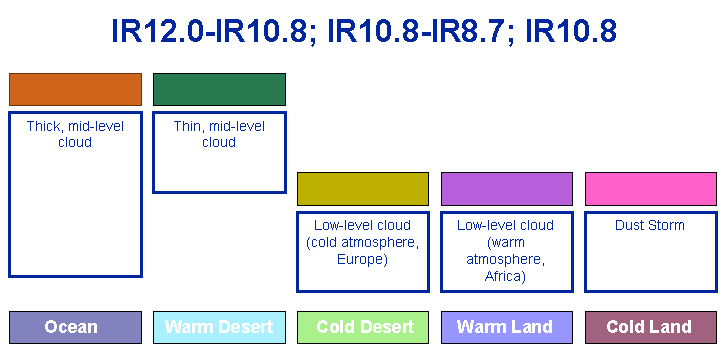
08 August 2004/18.00 UTC - Meteosat 8 Dust-RGB (IR12.0-IR10.8, IR10.8-IR8.7 and IR10.8)
|
|
|
The convective cells found in the warm sector are easily recognised in this RGB as the orange cells. The BTD between IR12.0 and IR10.8, which is projected on the red beam, is a measure of the optical thickness. As the thickness of the clouds become less so does the colour change from orange to green. The translucent part or cirrus shield is recognised as the green areas. This RGB is also known as the Dust-RGB, which becomes clear when observing the dustcloud (pictured in pink) over Northern Algeria and the Mediterranean in the above image. What the other colours in this RGB represent can be found out when clicking here .
Meteorological Physical Background
There are typical situations in the thickness ridge ahead of Cold Fronts where MCSs develop quickly in the afternoon. In low and middle layers moist warm air is advected from the south or south-west which, together with the drier and colder air at upper levels, leads to potentially unstable stratification of the troposphere.
If such a situation occurs close to the Cold Front the effect is often increased by dry and cold air stream from behind the Cold Front overrunning the frontal zone at higher levels (see Thickness Ridge Cloudiness ).
The troposphere under such conditions is characterized by (see Key parameters ):
- a tongue of high values of equivalent potential temperature at a low level (usually at 850 hPa) representing moist, warm air
- warm advection in the lower and middle layers and cold advection above resulting in potentially unstable vertical stratification of the troposphere
- notable convergence in the lower layers (for instance from the surface up to 700 - 600 hPa), which is one process causing upward motion
- a rising warm conveyor belt throughout a thick layer of the troposphere
|
|
|
|
|
08 August 2004/18.00 UTC - Meteosat 8 IR 10.8 image; blue: thermal front parameter 500/850 hPa, green: equivalent thickness 500/850
hPa
|
08 August 2004/18.00 UTC - Meteosat 8 IR 10.8 image; lines: thermal front parameter 500/850 hPa, red: temperature advection 700 hPa
|

|
|
|
|
|
08 August 2004/18.00 UTC - Vertical cross section; black: isentropes (ThetaE)
|
08 August 2004/18.00 UTC - Meteosat 8 IR10.8 image; magenta: relative streams 330K - system velocity: 260° 11 m/s, yellow:
isobars 330K, position of vertical cross section indicated
|
The satellite images show a frontal system over the Iberian peninsula and France. The Cold Front extends from Gibraltar across Spain further
northwards. The above left image shows a pronounced TFP indicating the surface cold front. Ahead a narrow cloudband can be recognised as a warm
conveyor belt. The MCSs situated ahead of the surface cold front have developed along the warmer side of the high gradient of equivalent
thickness.
The above right image shows that the MCSs have developed within an area of WA within the lower and middle levels of the troposphere.
The relative streams are calculated on the isentropic surface of 330K.
The isentropic analysis shows that the MCSs have developed within the ascending relative stream (called upper relative stream). This relative
stream rises from approximately 500 hPa to 400 hPa within the area of MCS development.
|
08 August 2004/18.00 UTC - Vertical cross section; black: isentropes (ThetaE), magenta thin: divergence, magenta thick: convergence
|
|

|
The vertical cross section shows a typical vertical distribution of the divergence field: there is pronounced convergence in front of the Cold Front in the lower levels of the troposphere up to approximately 600 hPa, and divergence aloft.
|
11 June 2004/18.00 UTC - Meteosat 8 IR 10.8 image; lines: blue: thermal front parameter 500/850 hPa, green: equivalent thickness
500/850 hPa
|
11 June 2004/18.00 UTC - Meteosat 8 IR 10.8 image; lines: blue: thermal front parameter 500/850 hPa, red: temperature advection 700
hPa
|
|
|
|
|
|
11 June 2004/18.00 UTC - Meteosat 8 IR 10.8 image; magenta: equivalent potential temperature 850 hPa
|
The images above show the development of MCSs over Central Europe (Austria, Hungary and Romania). Other MCSs have developed above the Iberian
Peninsula and France. The MCSs over Austria, Hungary and Romania are situated ahead of a well-developed Cold Front.
In the above left image, the Cold Front is characterized by a pronounced TFP close to the leading edge of the front and a high gradient of
equivalent thickness within the cloud band (compare Cold Front). The MCSs have developed in the tongue of warm air ahead of the surface front
(maximum values of TFP) which is also indicated by the model by high values of equivalent thickness.
In the above right image, the temperature advection field mostly shows weak WA where the MCSs have developed.
The equivalent potential temperature at 850 hPa has a pronounced gradient within the Cold Front zone (lower left image). The MCSs can be found
along the warmer side of this high gradient where the equivalent potential temperature has a maximum.
|
11 June 2004/18.00 UTC - Meteosat 8 IR 10.8 image; position of vertical cross section indicated
|
11 June 2004/18.00 UTC - Vertical cross section; black: isentropes (ThetaE), red temperature advection
|
|
|
|
|
|
11 June 2004/18.00 UTC - Vertical cross section; black: isentropes (ThetaE), magenta: divergence
|
The above diagrams show a cross section across the frontal cloud band and the MCSs which have developed ahead of the cloud band.
The isentropes area show an unstable stratified troposphere (decreasing values of equivalent potential temperature with height) within the the
lower layers of the troposphere up to approximately 700 hPa. WA can be found in the lower levels and CA in the upper levels of the troposphere
(above right image). The field of divergence (lower left image) does correspond to the ideal vertical distribution of divergence/convergence.
The area of the MCS is indicated by very strong converging motion at lower levels and weak divergence at middle levels of the troposphere.
Key Parameters
Frontal Parameters (TFP, equivalent thickness)
The typical configurations of key parameters for fronts and thickness ridge are described in detail in the relevant conceptual model chapters
(see
Cold Front
,
Cold Front in Cold Advection
,
Cold Front in Warm Advection
,
Split Front
,
Arctic Cold Front
,
Warm Front Band
,
Warm Front Shield
,
Detached Warm Front
,
Occlusion
,
Instant Occlusion
,
Occlusion: Cold Conveyor Belt Type
,
Cold Air Development
and
Baroclinic Boundary
).
The relevant area is the thickness ridge ahead of the CF.
|
|
08 August 2004/18.00 UTC - Meteosat 8 IR 10.8 image; lines: blue: thermal front parameter 500/850 hPa, green: equivalent thickness
500/850 hPa
|
|
|
Stability index (Showalter index)
An area with high probability for Cb development will normally have Showalter index with values below 3 units.
|
|
08 August 2004/18.00 UTC - Meteosat 8 IR 10.8 image; lines: green: equivalent thickness 500/850 hPa, yellow: Showalter index
500/850 hPa
|
|
|
Equivalent potential temperature at 850 hPa
Tongue of high values of ThetaE; MCS develop in the area of the maximum values
|
|
08 August 2004/18.00 UTC - Meteosat 8 IR 10.8 image; lines: magenta: ThetaE 850 hPa
|
|
|
Typical Appearance In Vertical Cross Sections
A cross section of the typical environment for the development of MCSs within the warm sector ahead of a frontal zone is characterised by the following (typical) features:
- The isentropes of equivalent potential temperature show a super adiabatic behaviour at mid-levels of the troposphere. A colder air mass overruns the lower warm air mass, resulting in unstable stratification.
- The vertical distribution of temperature advection is clearly characterised by warm advection at low and mid-levels of the troposphere and cold advection above.
- In the field of divergence, there is typically a convergence maximum at lower levels ahead of the frontal gradient of isentropes.
|
08 August 2004/18.00 UTC - Meteosat 8 IR 10.8 image; position of vertical cross section indicated
|
|
|
Isentropes
|
|
08 August 2004/18.00 UTC - Vertical cross section; lines: black: isentropes (ThetaE)
|
|

|
Temperature Advection
|
|
08 August 2004/18.00 UTC - Vertical cross section; lines: black: isentropes (ThetaE), red: temperature advection
|
|
|
Divergence
|
|
08 August 2004/18.00 UTC - Vertical cross section; lines: black: isentropes (ThetaE), magenta thin: divergence/convergence
|
|
|
The diagrams above show a vertical cross section across the frontal cloud band and the MCSs which have developed ahead of it. In the cross
section the MCSs are characterised by an unstable stratification seen ahead of the frontal system around 44N/4E. These unstable stratified
isentropes (decreasing values of equivalent potential temperature with height) reach the lower layers of the troposphere, up to approximately
700 hPa.
WA is associated to the MCSs and will contribute slightly to the upward motions. Not surprising, WA is found ahead and aloft of the Cold Front
in the area of the Warm sector.
In the divergence field a pronounced maxima of convergence can be seen near the surface in the area of the warm sector. Aloft there is divergence causing outflow of air.
Weather Events
For weather events see Cumulonimbus (CB) And Mesoscale Convective System (MCS) - Weather Events .
References
- BROWNING K. A. (1962): Cellular structure of convective storms; Met. Mag., Vol. 91, p. 341 - 350
- BROWNING K. A. and LUDLAM F. H. (1962): Airflow in convective storms; Quart. J. R. Meteor. Soc., Vol. 102, p. 499 -533
- BUNKERS, M.J., et al., (2000): Predicting Supercell Motion Using a new Hodograph Technique, AMS, Weath. a. Forec., 15, 61pp
- CONWAY B. J., GERARD L., LABROUSSE J., LILJAS E., SENESI S., SUNDE J. and ZWATZ-MEISE V. (1996): COST78 Meteorology - Nowcasting, a survey of current knowledge, techniques and practice; Phase 1 report; Office for official publications of the European Communities
- HEIMANN, D., KURZ, M., (1985): The Munich Hailstorm of 12 July 1984: A Discussion of the Synoptic Situation. Beitr. Phys. Atmosph.58, 528pp
- LILLY D. K. (1986): Instability; in: Ray P. (ed.): Mesoscale Meteorology and Forecasting; American Meteorological Society, p. 259 - 271
- SCOFIELD R. A. (1990): The "Water Vapour Imagery/Theta E Connection" with Heavy Convective Rainfall; in: EUMETSAT Proceedings of the Workshop on the Use of Satellite Data in Nowcasting and Very Short Range Forecasting; Reading, U. K., 16 - 20 July 1990, p. 173 - 178
- SHOWALTER A. K. (1953): A Stability Index for Thunderstorm forecasting; Bull. Amer. Met. Soc., Vol. 34, No. 6, p. 250 252