Cloud Structure In Satellite Images
Convective activity in Fair Weather Conditions results in the typical life cycle of convective cells like Cb Clusters or MCS. The difference to other environments of convection can be found in the initial stage of the life cycle:
- In satellite images, convective cells are normally far away from frontal cloud bands as well as frontal circulations.
- In the IR10.8 and VIS0.6 images there are no significant pixel values within the affected area.
- In mostly all cases the convection starts within the small stripe-like area of the smooth transition zone between relatively high and low WV pixel values.
|
|
Appearance in METEOSAT 8 imagery:
- IR 10.8 imagery:
- Only a few nearly black pixels during the initial stage
- Developing Cb or Cb cluster with high pixel values or bright greyish to white pixels in a circular shape
- In a more mature stage developed Cb, Cb complexes and MCS can be observed
- WV 6.2 imagery:
- WV structures such as eddies, vortices, filaments and stripes can be seen
- Near a smooth transition zone between darker and brighter WV pixels, deep convection will be indicated by grey Cb's or a MCS
- VIS0.6/HRVIS imagery:
- Like in the IR 10.8 imagery, no significant cloud pattern can be observed during the initial stage
- During the life cycle the growth of bright white circular clouds can be observed
|
28 July 2005/10.00 UTC - Meteosat 8 IR 10.8 enhanced image; 10.00 UTC - 18.00 UTC half-hourly image loop
|
28 July 2005/10.00 UTC - Meteosat 8 WV 6.2 image; 10.00 UTC - 18.00 UTC half-hourly image loop
|
|
28 July 2005/10.00 UTC - Meteosat 8 HRVIS image; 10.00 UTC - 18.00 UTC half-hourly image loop
|
|
The satellite image loops above show MCS development over the Northeastern part of Austria. In the enhanced IR 10.8 image, as well as in the other two satellite channels, the first cells can be identified early that day. In the WV 6.2 image loop over Austria a dark stripe can be recognised. The first cell develops on the Northern border of this stripe. Further cell developments to the South also occur within the transition zone from dark to bright area.
In the HRVIS image loop multiple small convective developments over the Northwestern part of Austria can be seen during the initial stage. As has been described above, the WV boundaries are preferred areas for initiation of convection.
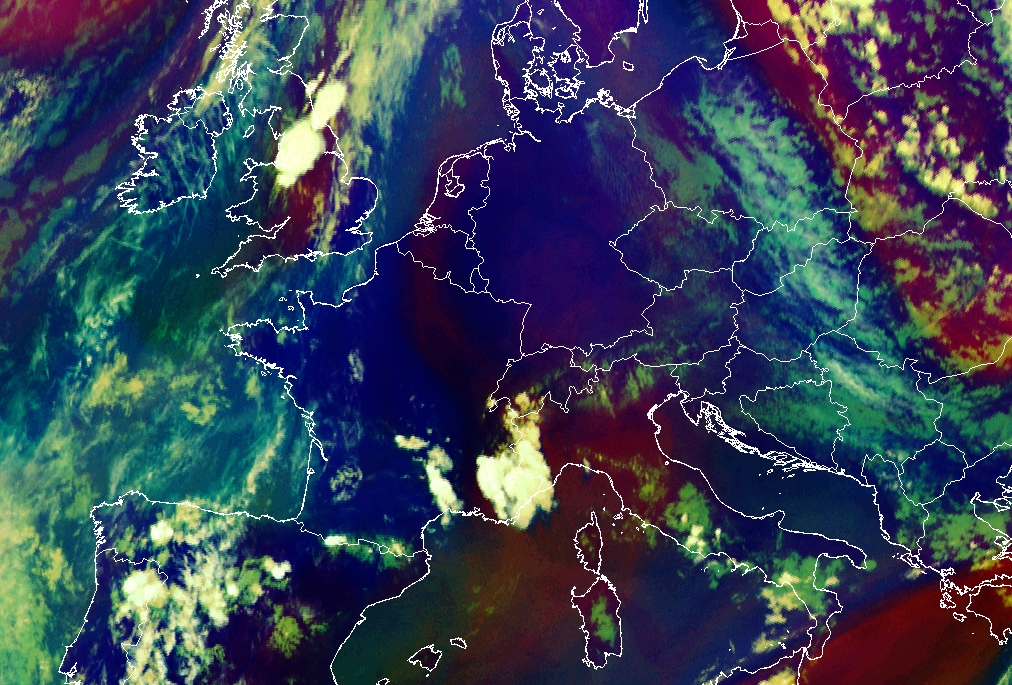
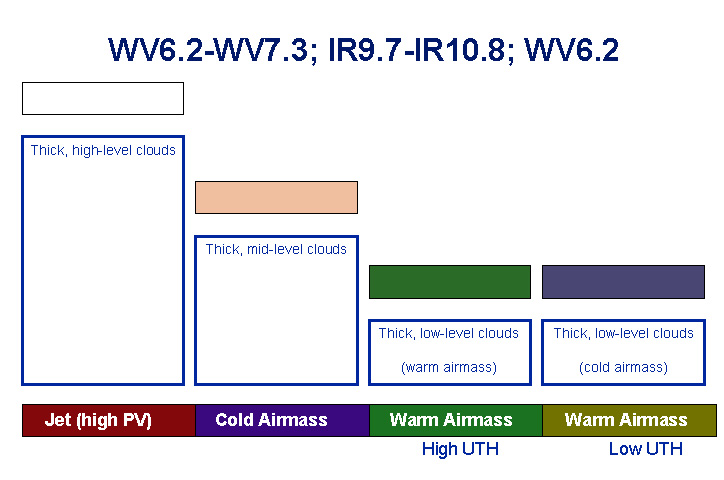
An artificial composite of the infrared and water vapour channels of Meteosat 8 is called the Airmass RGB. The Airmass RGB consists of the WV6.2 - WV7.3 Brightness Temperature Difference (BTD, on red), the IR9.7 - IR10.8 BTD (on green) and the WV6.2 channel (on blue). A particular feature of this RGB is that dry descending stratospheric air is marked by a reddish colour. Details on the representation of other colours can be found here .
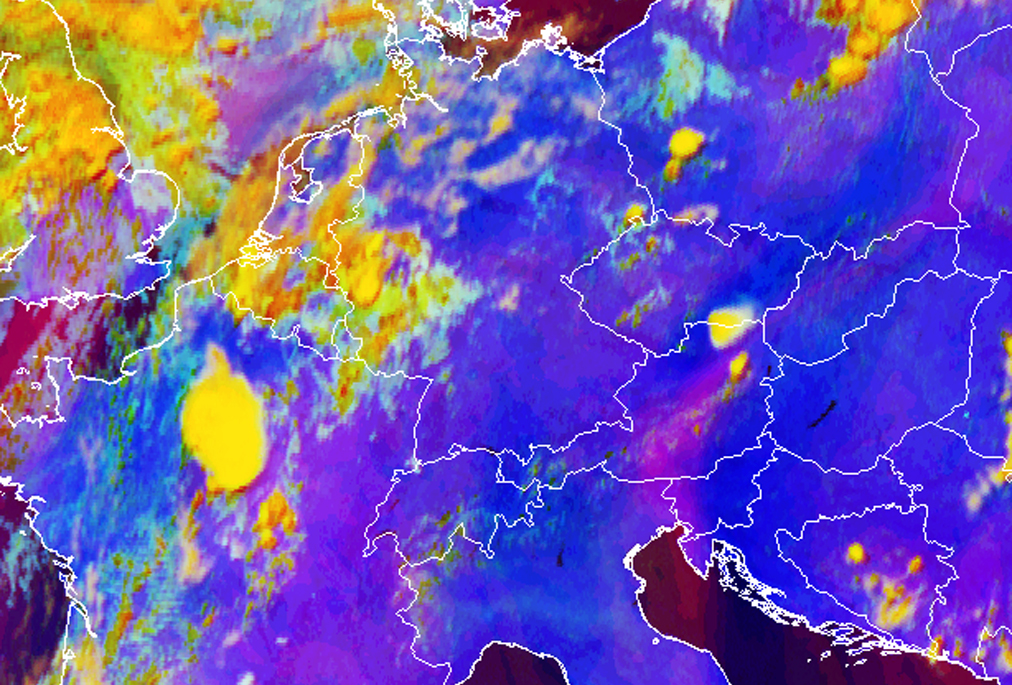
In the image below left the Airmass RGB for 28 July 2005 is given. The image shows clearly the WV red stripe extending over the border of Italy and Slovenia and then turning anticyclonically over Austria into Slovakia. On the border of this red stripe a convective cell develops in Lower Austria.
|
28 July 2005/15.00 UTC - Meteosat 8 Airmass RGB image (WV6.2-WV7.3, IR9.7-IR10.8 and WV6.2i)
|
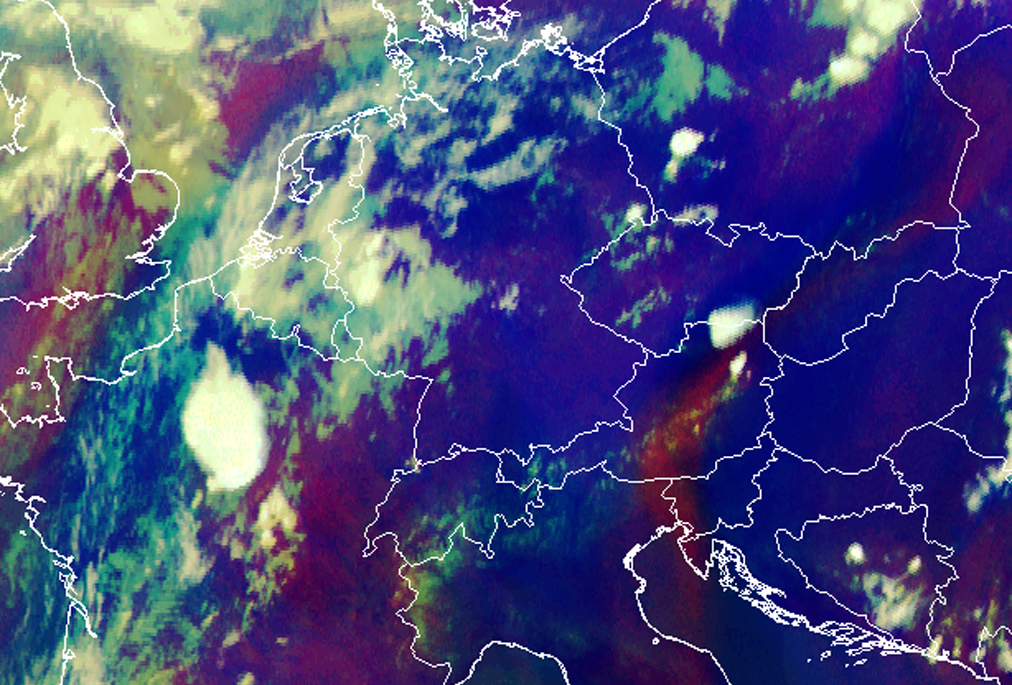
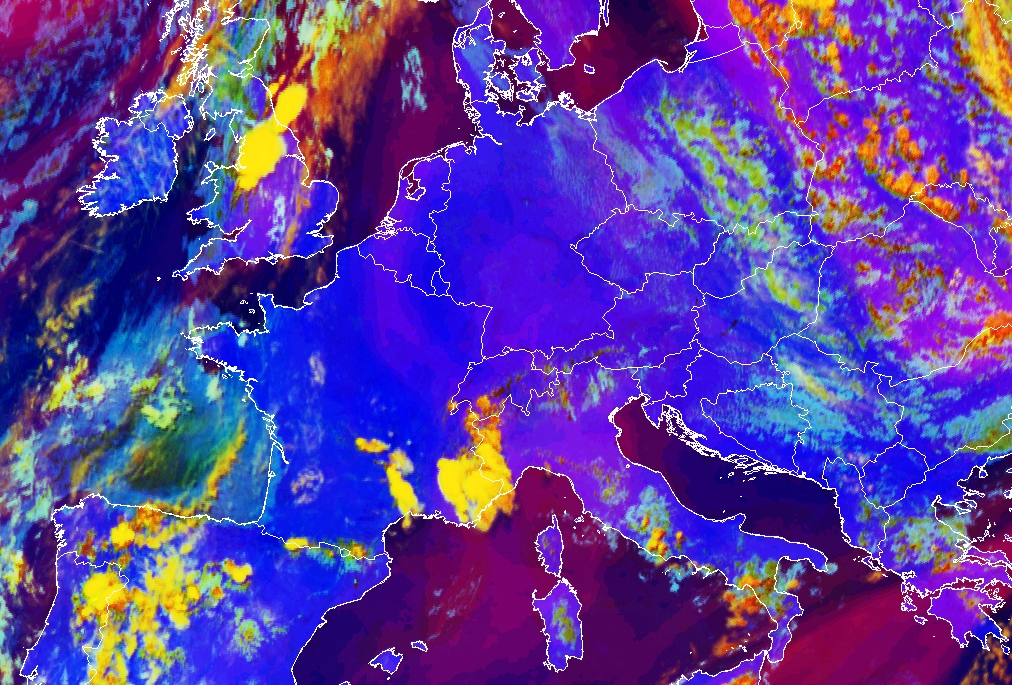
28 July 2005/15.00 UTC - Meteosat 8 Severe Convection RGB image (WV6.2-WV7.3, NIR3.9-IR10.8 and NIR1.6-VIS0.6)
|
|
|
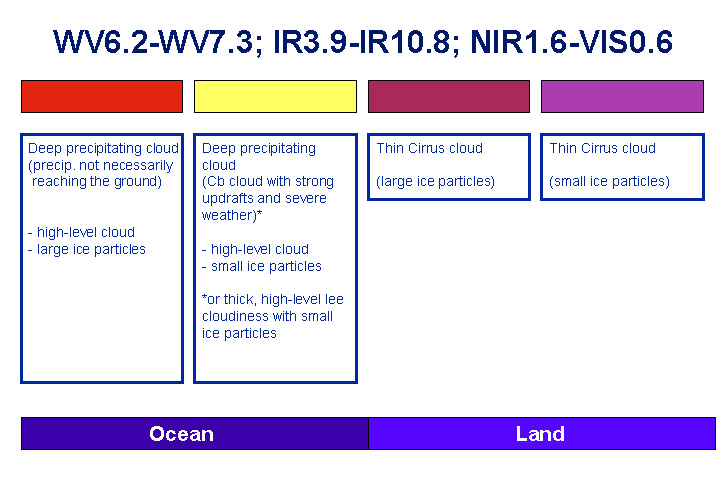
A second RGB usefull to detect convection is the Severe Convection RGB. An example of this RGB is shown in the image above right. The RGB which is build up of the composite of the BTD of WV6.2-WV7.3 on red, the BTD of IR3.9-IR10.8 on green and the BTD of NIR1.6-VIS0.6 on blue. In the image two cells are recognised: a yellow northern cell and a more orange southern cell. The colours of these cells explain the physical content. Whereas the northern cell in yellow is mainly consisting of very small iceparticles, the southern cell has further developed and already consists of larger ice particles. The presence of the BTD of the two water vapour channels on the red beam is clearly visible as the previously WV dark stripe appears in purple in this RGB. More information about the different colours observed in this Severe convection RGB can be found here .
|
19 June 2005/10.00 UTC - Meteosat 8 WV 6.2 image; 10.00 UTC - 18.00 UTC half-hourly image loop
|
|
The above image loop, for 19 June case, shows two regions with development of deep convection: first over the UK and second over the Alps appearing at noon over Southern France, Switzerland and northern Italy. Again the development starts within or next to the WV dark stripe. MCS development follows soon.
|
19 June 2005/15.00 UTC - Meteosat 8 Airmass RGB image (WV6.2-WV7.3, IR9.7-IR10.8 and WV6.2i)
|
19 June 2005/15.00 UTC - Meteosat 8 Severe Convection RGB image (WV6.2-WV7.3, NIR3.9-IR10.8 and NIR1.6-VIS0.6)
|
|
|
In the Airmass RGB, above left, a dark WV red stripe is recognised over the Netherlands, Belgium and further south into France. Several convective cells have developed on the boundary of the red stripe over the southern French coast. Further North a second area with deepening of stratospheric air is seen over England. Also in this case a large convective system is identified on the boundary of the reddish area.
In the Severe Convection RGB, above right, both convective systems in France and England appear yellow indicating that they consist of small iceparticle and further development may be expected. The areas with low tropopause are recognised by its purple colouring.
|
23 June 2006/10.00 UTC - Meteosat 8 WV 6.2 image; 10.00 UTC - 15.00 UTC half-hourly image loop
|
|
The satellite loop above shows a dark stripe over the Iberian peninsula. It can be seen that the cells grow from the WV boundary into the drier zone (WV Dark Stripe). By 12.00 UTC convective activity is taking place over Catalunya in Eastern Spain.
|
26 June 2006/10.00 UTC - Meteosat 8 WV 6.2 image; 10.00 UTC - 15.00 UTC half-hourly image loop
|
|
The WV image loop above shows a large number of developing convective cells over Austria, the Czech Republic and Poland. The cells develop on WV boundaries.