Table of Contents
Cloud Structure In Satellite Images
Convective activity in Fair Weather Conditions results in the typical life cycle of convective cells like Cb Clusters or MCS. The difference to other environments of convection can be found in the initial stage of the life cycle:
- In satellite images, convective cells are normally far away from frontal cloud bands as well as frontal circulations.
- In the IR10.8 and VIS0.6 images there are no significant pixel values within the affected area.
- In mostly all cases the convection starts within the small stripe-like area of the smooth transition zone between relatively high and low WV pixel values.
|
|
Appearance in METEOSAT 8 imagery:
- IR 10.8 imagery:
- Only a few nearly black pixels during the initial stage
- Developing Cb or Cb cluster with high pixel values or bright greyish to white pixels in a circular shape
- In a more mature stage developed Cb, Cb complexes and MCS can be observed
- WV 6.2 imagery:
- WV structures such as eddies, vortices, filaments and stripes can be seen
- Near a smooth transition zone between darker and brighter WV pixels, deep convection will be indicated by grey Cb's or a MCS
- VIS0.6/HRVIS imagery:
- Like in the IR 10.8 imagery, no significant cloud pattern can be observed during the initial stage
- During the life cycle the growth of bright white circular clouds can be observed
|
28 July 2005/10.00 UTC - Meteosat 8 IR 10.8 enhanced image; 10.00 UTC - 18.00 UTC half-hourly image loop
|
28 July 2005/10.00 UTC - Meteosat 8 WV 6.2 image; 10.00 UTC - 18.00 UTC half-hourly image loop
|
|
28 July 2005/10.00 UTC - Meteosat 8 HRVIS image; 10.00 UTC - 18.00 UTC half-hourly image loop
|
|
The satellite image loops above show MCS development over the Northeastern part of Austria. In the enhanced IR 10.8 image, as well as in the other two satellite channels, the first cells can be identified early that day. In the WV 6.2 image loop over Austria a dark stripe can be recognised. The first cell develops on the Northern border of this stripe. Further cell developments to the South also occur within the transition zone from dark to bright area.
In the HRVIS image loop multiple small convective developments over the Northwestern part of Austria can be seen during the initial stage. As has been described above, the WV boundaries are preferred areas for initiation of convection.
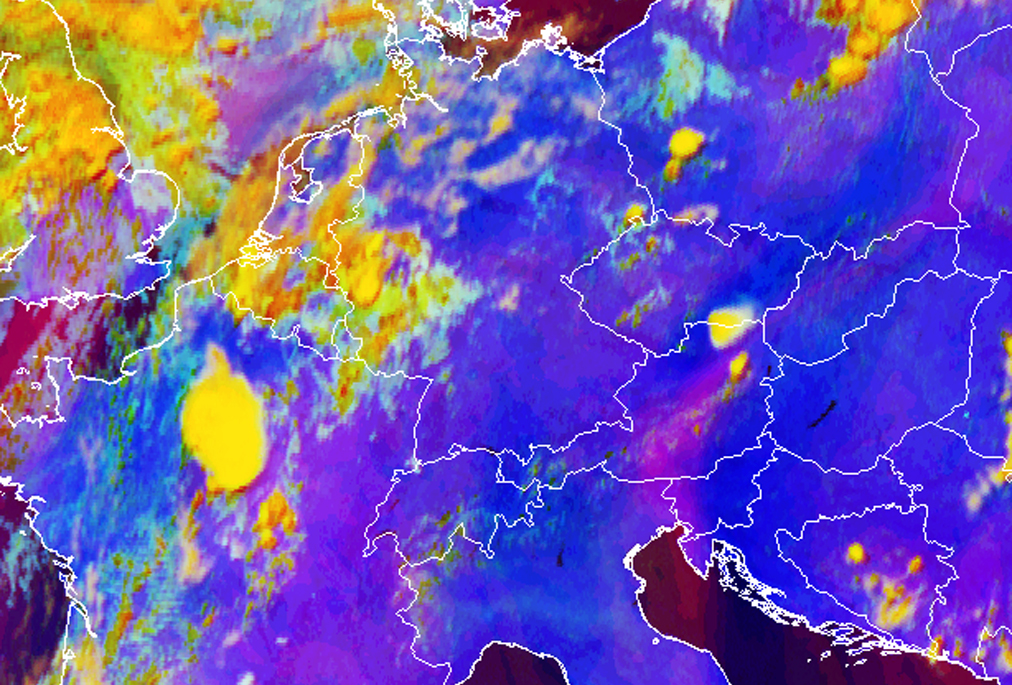
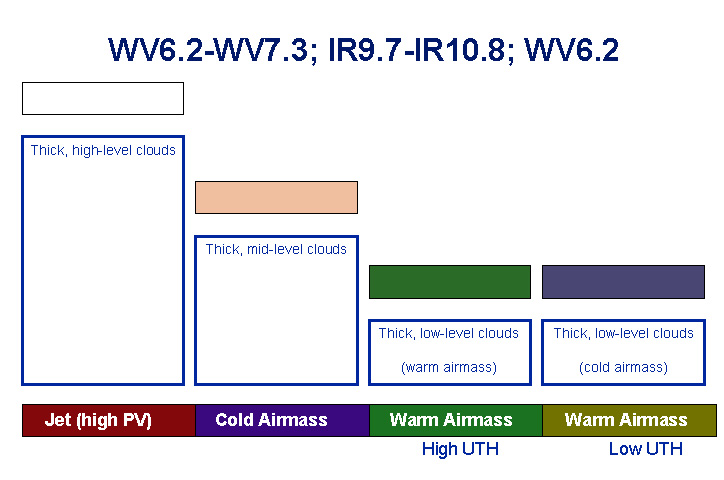
An artificial composite of the infrared and water vapour channels of Meteosat 8 is called the Airmass RGB. The Airmass RGB consists of the WV6.2 - WV7.3 Brightness Temperature Difference (BTD, on red), the IR9.7 - IR10.8 BTD (on green) and the WV6.2 channel (on blue). A particular feature of this RGB is that dry descending stratospheric air is marked by a reddish colour. Details on the representation of other colours can be found here .
In the image below left the Airmass RGB for 28 July 2005 is given. The image shows clearly the WV red stripe extending over the border of Italy and Slovenia and then turning anticyclonically over Austria into Slovakia. On the border of this red stripe a convective cell develops in Lower Austria.
|
28 July 2005/15.00 UTC - Meteosat 8 Airmass RGB image (WV6.2-WV7.3, IR9.7-IR10.8 and WV6.2i)
|
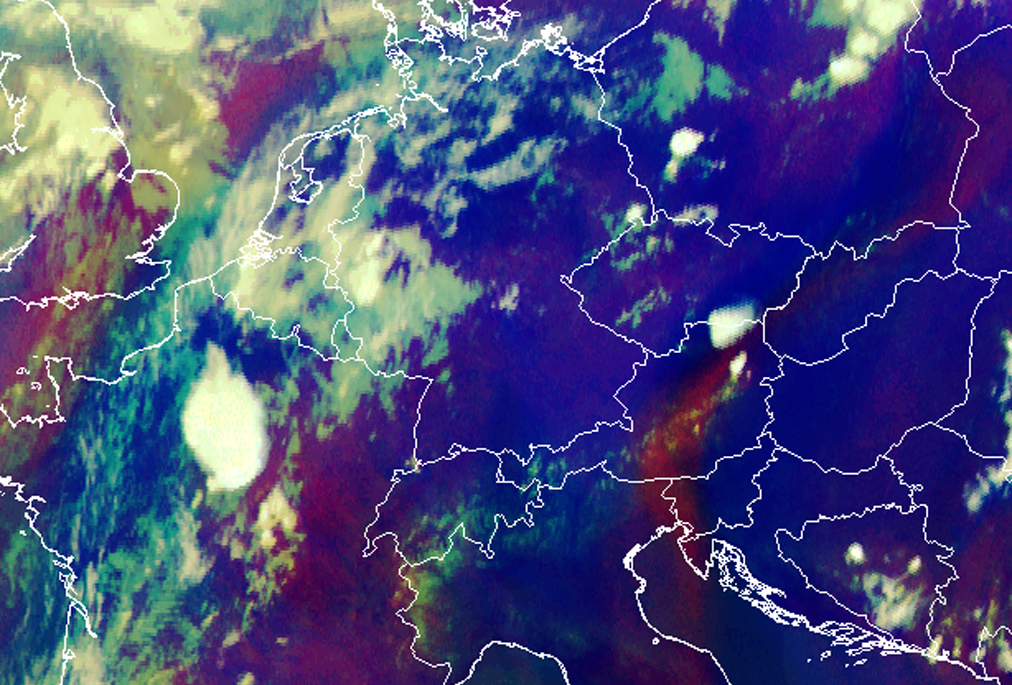
28 July 2005/15.00 UTC - Meteosat 8 Severe Convection RGB image (WV6.2-WV7.3, NIR3.9-IR10.8 and NIR1.6-VIS0.6)
|
|
|
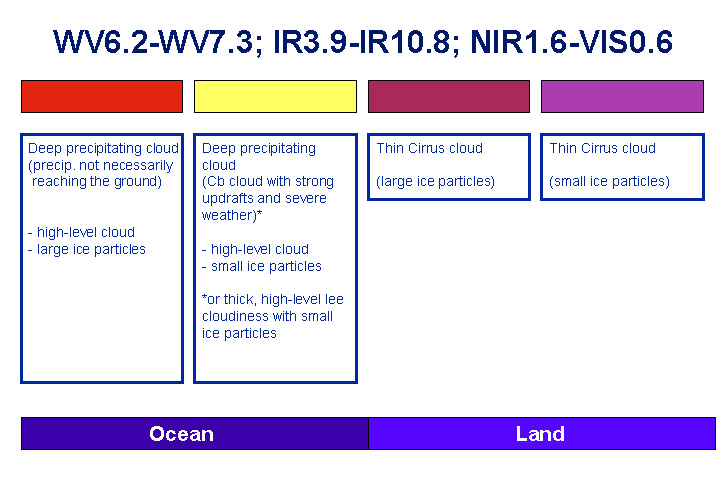
A second RGB usefull to detect convection is the Severe Convection RGB. An example of this RGB is shown in the image above right. The RGB which is build up of the composite of the BTD of WV6.2-WV7.3 on red, the BTD of IR3.9-IR10.8 on green and the BTD of NIR1.6-VIS0.6 on blue. In the image two cells are recognised: a yellow northern cell and a more orange southern cell. The colours of these cells explain the physical content. Whereas the northern cell in yellow is mainly consisting of very small iceparticles, the southern cell has further developed and already consists of larger ice particles. The presence of the BTD of the two water vapour channels on the red beam is clearly visible as the previously WV dark stripe appears in purple in this RGB. More information about the different colours observed in this Severe convection RGB can be found here .
|
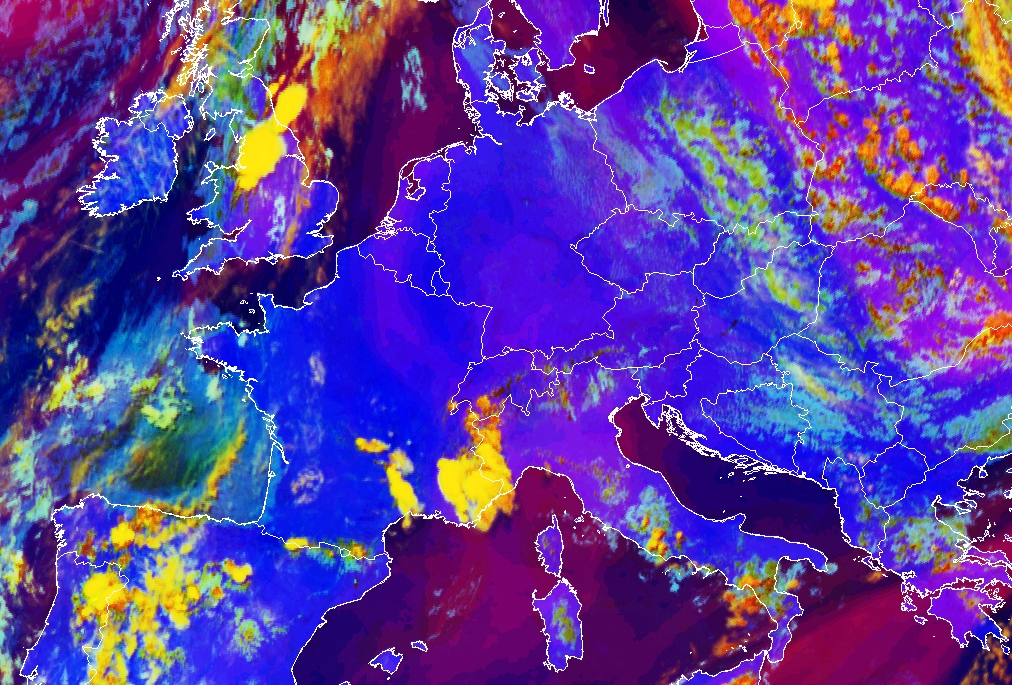
19 June 2005/10.00 UTC - Meteosat 8 WV 6.2 image; 10.00 UTC - 18.00 UTC half-hourly image loop
|
|
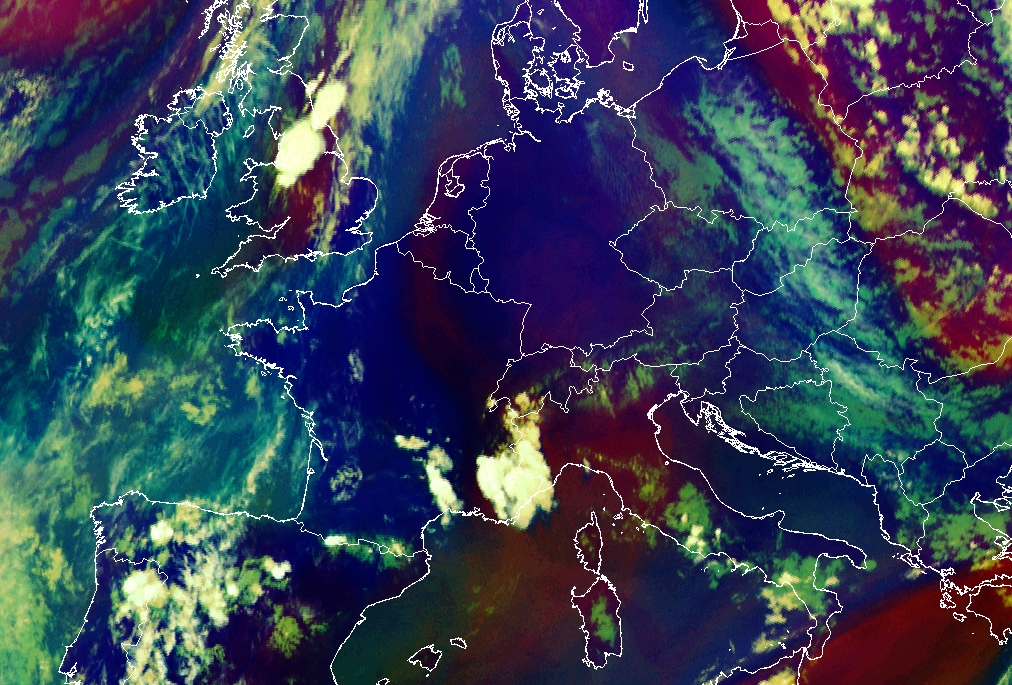
The above image loop, for 19 June case, shows two regions with development of deep convection: first over the UK and second over the Alps appearing at noon over Southern France, Switzerland and northern Italy. Again the development starts within or next to the WV dark stripe. MCS development follows soon.
|
19 June 2005/15.00 UTC - Meteosat 8 Airmass RGB image (WV6.2-WV7.3, IR9.7-IR10.8 and WV6.2i)
|
19 June 2005/15.00 UTC - Meteosat 8 Severe Convection RGB image (WV6.2-WV7.3, NIR3.9-IR10.8 and NIR1.6-VIS0.6)
|
|
|
In the Airmass RGB, above left, a dark WV red stripe is recognised over the Netherlands, Belgium and further south into France. Several convective cells have developed on the boundary of the red stripe over the southern French coast. Further North a second area with deepening of stratospheric air is seen over England. Also in this case a large convective system is identified on the boundary of the reddish area.
In the Severe Convection RGB, above right, both convective systems in France and England appear yellow indicating that they consist of small iceparticle and further development may be expected. The areas with low tropopause are recognised by its purple colouring.
|
23 June 2006/10.00 UTC - Meteosat 8 WV 6.2 image; 10.00 UTC - 15.00 UTC half-hourly image loop
|
|
The satellite loop above shows a dark stripe over the Iberian peninsula. It can be seen that the cells grow from the WV boundary into the drier zone (WV Dark Stripe). By 12.00 UTC convective activity is taking place over Catalunya in Eastern Spain.
|
26 June 2006/10.00 UTC - Meteosat 8 WV 6.2 image; 10.00 UTC - 15.00 UTC half-hourly image loop
|
|
The WV image loop above shows a large number of developing convective cells over Austria, the Czech Republic and Poland. The cells develop on WV boundaries.
Meteorological Physical Background
Strong convection and severe thunderstorms can be observed within specific synoptic situations:
- Associated with fronts or frontal zones
- Under "fair weather" conditions
Analyses of satellite images and loops show that the first appearance of deep convection in "fair weather" conditions can be associated with the transition zone between relatively high and relatively low pixel values in the WV satellite imagery. This boundary represents the transition between relatively humid and dry air at levels above 600 hPa.
In general the onset of deep moist convection (DMC, above 600 hPa) can be observed in Meteosat 8 WV6.2 images. It is also possible to derive
information about the atmospheric flow within this layer of the troposphere even when clouds are absent. Features in the WV image like grey and
white zones and Dark Stripes are caused by processes including differential advection in both the horizontal and vertical direction.
The preferred area for the first appearance of DMC, associated with the transition zone between moist and dry upper air, is called "WV -
Boundary".
The physics behind convective development at a WV-Boundary can be best described from the hydrostatic point of view.
Convective activity can appear in different synoptic environments:
- Fronts or Convergence Lines associated with upper level troughs or lows and the intrusion of cold dry air from higher levels of the troposphere or even the stratosphere (mostly seen as a dark zone in WV images) behind a Cold Front.
- At the leading edge of frontal cloud bands. Advection of cold and dry air at higher levels overrunning a frontal cloud band can also be observed as a dark zone in the WV image. This mechanism can cause severe storms for instance within prefrontal squall lines.
All these mechanisms are well indicated by typical parameters used in numerical weather prediction models, where the synoptic scale environment for convection can also be easily determined.
The type of deep moist convection under discussion is clearly not associated with a frontal cloudband and frontal dynamics. The typical synoptic environment is an isobaric ridge at 500 hPa and a ridge or a maximum of the thickness (500 - 1000 hPa). Because of the absence of a frontal cloudband or any extensive cloud area this type of convection is called convection under "fair weather conditions".
In numerous "fair weather" cases over Europe cells have been investigated with respect to their first appearance in WV imagery. However, shallow convection often occurs over mountainous terrain (over 400 meters above MSL) and can be found in visible and infra red images even before their appearance in the WV imagery:
- The first appearance of deep convection happens in 66% of the investigated cases, at the WV Boundaries.
- Convective cells within a dry or humid area of a WV structure generally appear somewhat later in time.
- About 22% of the cells appear first at weaker boundaries within a more humid area.
- About 12% of the cells appear first within a dry area.
- Nearly all cells seen first within a humid or dry area grow above mountainous terrain higher than 400m MSL which likely indicates orographic triggering.
- 24 % of all cells appearing first at a WV - Boundary are not connected with orography.
- There is no indication of the exact location where DMC appears at the WV - Boundary.
This suggests that the development of deep convection can also depend on the special physical environment at the WV - Boundaries.
Possible reasons for the preferred location of deep convection at the WV - Boundary
DMC depends on the available moisture, conditional instability and a source of lift. This lift needs to be sufficient in order to move an air parcel to its level of free convection, initiating the process of deep convection.
Dynamic initiation
Some of the WV structures resemble cyclonic eddies associated with vorticity and vorticity advection. However, DMC under "fair
weather" does not show any remarkable cyclonic vorticity. Even if numerical models (global or LAM) would be wrong, or would not resolve
the structures in this area (WV features are of a rather extended scale) this would not explain the first appearance of deep convection at the
narrow zone of the WV - Boundaries.
Here, processes at a much smaller scale, namely the narrow transition zone between dry and moist areas in water vapour imagery, seem to be of
importance.
The following aspects have been observed:
- Convection under "fair weather" shows a distinct diurnal cycle of development and decay.
- The cells of DMC are initiated in the lower levels of the troposphere.
- Deep convection develops and decays much faster than the WV structures they are embedded in.
Incoming solar radiation and diabatic heating
One source of initiation of convection is the diabatic heating of the surface and adjacent air layers by incoming solar radiation during the daytime. An absolutely unstable shallow layer near the surface will develop, where spontaneous convective overturning becomes likely. If enough lifting energy is provided the rising air parcel might reach condensation leading to strong deep moist convection at the level of free convection in the case of conditional instability. If the lifted parcel starts from higher surfaces, e.g. mountain slopes, less energy is needed to reach the level of free convection. This implies that shallow convection will start earlier from elevated surfaces.
The schematic above shows, that incoming solar radiation is differently affected in the area with dry or moist upper level humidity. The visible part of the solar radiation (also known as "atmospheric window") is not weakened remarkably by water vapour. Water vapour is the primary absorber in the near - IR, which contains about 50% of the incoming solar energy and, consequently, the reduction of solar energy reaching the surface is higher below a humid area than below the dry area.
The vertical stratification of the air column
The area under consideration is a widespread conditionally unstable region in the low and middle troposphere, which can also be seen in the vertical cross sections (see schematic below).
Near the surface a shallow layer of absolute instability can be found in nearly all cases. Often the high reaching conditional instability in the layer above is interspersed with very thin stable layers or capped inversions.
This can be demonstrated with the example from 19 June 2005. The radio sonde station in Nimes-Courbessac, France is indicated in the WV 6.2 image by the red circle. This station measurement is closest to the development, both in distance and time of the day. The image below right, shows the situation when the development of the cell is completed.
|
19 June 2005/12.00 - Meteosat 8 WV 6.2 image; location of radiosonde stations indicated
|
19 June 2005/14.00 UTC - Meteosat 8 WV 6.2 image
|
|
|
The corresponding radiosounding is shown below. The vertical stratification displayed here is, in general, representative for all investigated cases. From the ground up to about 820 hPa the stratification is absolutely unstable. Spontaneous convective overturning is highly likely within this layer. At 820 hPa an exceptionally strong capped inversion is recognised. This capped inversion hampers further convective development as it prevents air parcels to rise further. From 820 hPa upward the air column is conditionally unstable except for interruptions by thin inversions and stable layers.
|
19 June 2005/12.00 UTC - Skew-T diagram of Nimes-Courbessac radio sounding
|
|
|
The great amount of moisture at low levels, with a maximum around 800 hPa, and the distinct gradient between about 550 hPa and 500 hPa is a typical condition observed throughout all cases of deep convection at WV Boundary.
Horizontal gradients in potential instability will develop in areas with a homogeneous distribution of humidity at low levels having inhomogeneous distributions of humidity above (shown in the WV imagery), (see Basics - Numerical parameters for small scale convective cloud systems: Convection and instability). Higher potential instability is achieved when there is a higher vertical gradient of humidity. Consequently between these two regions there is a horizontal gradient in potential instability which corresponds to the WV Boundary.
When a deep convective cell grows, the strong upward motion will cause turbulent entrainment at the boundary of the cloud. The evaporation of cloud droplets and the resulting negative buoyancy counteracts convection. When DMC grows into the dry upper layer, there would be a stronger effect of entrainment than in a humid upper layer. The first cells at the WV Boundary tend to grow in the humid region of the boundary. Consequently a certain supply of humidity at middle and upper levels seems to be favourable for the further growth of cells as soon as shallow convection changes into deep convection.
It can be concluded that because of the small scale of the phenomena, observations from soundings have limited use. Therefore only differences between areas with dry and humid upper layers, seen in WV Boundary regions, are significant for DMC development.
In the dry zone of the WV Boundary, surface heating is stronger than under the humid region. Therefore DMC might be initiated earlier and the water vapour supply above is still sufficient. Although potential instability is higher within the dark area of the WV image, the missing upper level humidity supply restricts growth of deep convection. It seems that the combination of these effects is necessary for DMC development in the transition area of the WV Boundary.
Key Parameters
- Height contours 1000 hPa and 500 hPa:
- In contrast to front related convection, development can take place within a low and upper level ridge
- Weak pressure gradient
- No large scale upward motion or forcing within the ridge
- Thermal front parameter (TFP) and equivalent thickness:
- Initiation of convection in clear weather is not related to a significant gradient of equivalent thickness nor any distinct Thermal Front Parameter
- Equivalent potential Temperature at 850 hPa:
- Ridge and/or a maximum of ThetaE 850 hPa
- Showalter Index:
- Unstable stratification over the area of interest indicated by the Showalter Index 500/850 hPa
- The diurnal variation of the instability indicated by the Showalter index is a result of the diurnal cycle of the available insolation.
Height contours 1000 hPa and 500 hPa
|
|
28 July 2005/12.00 UTC - Meteosat 8 IR 10.8 image; magenta: height contours 1000 hPa, cyan: height contours 500 hPa
|
|
|
Thermal Front Parameter (TFP) and Equivalent Thickness
|
|
28 July 2005/12.00 UTC - Meteosat 8 IR10.8 image; blue: thermal front parameter (TFP) 500/850 hPa, green: equivalent thickness
500/850 hPa
|
|
|
Equivalent Potential Temperature at 850 hPa
|
|
28 July 2005/12.00 UTC - Meteosat 8 IR10.8 image; magenta: equivalent potential temperature 850 hPa
|
|
|
Showalter Index
|
|
28 July 2005/12.00 UTC - Meteosat 8 IR10.8 image; yellow: Showalter index 500/850 hPa
|
|
|
Parameters computed and shown in Meso-Scale
ALADIN model forecast fields
ALADIN model fields are computed with a higher spatial resolution (average distance between grid points is about 10km than ECMWF model fields (about 40km. Therefore, meso-scale dynamics of convection can be shown in more detail.
Fields of divergence and vertical motion show a diurnal life cycle:
Divergence
No significant convergence or weak divergence at low levels and weak convergence at higher levels at morning hours. With beginning of convection, there is distinct convergence at lower levels and divergence at higher levels.
|
28 July 2005/12.00 UTC - Meteosat 8 WV 6.2 image; red dashed: convergence 850 hPa, blue dashed: convergence 700 hPa
|
28 July 2005/18.00 UTC - Meteosat 8 WV 6.2 image; red dashed: convergence 850 hPa, blue dashed: convergence 700 hPa
|
|
|
In the upper picture the WV6.2 satellite image is superimposed with the convergence/divergence at 850 (red) and 700 (blue) hPa. At 12UTC the convection developing on the WV boundary is about to start. The LAM model characterises the area of interest with convergence at 850 hPa (red dashed) and diverging motions at 700 (blue) hPa.
Six hours later (image above), as the cells have already reached mature stage and are dying out due to the subsidence, the opposite is observed. At 850 hPa now divergence is observed (red) and at 700 hPa convergence (blue dashed lines) is observed.
Vertical motion
A strong upward motion at lower levels (for instance 850 hPa) indicates convection.
|
28 July 2005/12.00 UTC - Meteosat 8 WV 6.2 image; cyan:wind vectors at 850 hPa
|
|
|
In the LAM model at 12.00 UTC strong converging wind-vectors resulting in vertical upward motion can be seen in the vicinity of the WV dark stripe. In this location in three hours the convection will start.
Although the above model fields show a good correspondence with the convective activity observed in the satellite images that is about to start here, there is unfortunately no indication of the time when convection might start. The initiation of convection still seems best indicated by the WV features described above (see Cloud structure in satellite images).
Typical Appearance In Vertical Cross Sections
- Isentropes:
In vertical cross sections from the ECMWF model the isentropes of equivalent potential temperature show a super adiabatic stratification in the mid levels of the troposphere in all stages of the life cycle of convection. This is clearly a good indicator for strong convection. - Relative humidity:
As convection appears near the boundary between moist and dry WV features, two indicators are of interest in vertical cross sections of the relative humidity:- the representation of the dry and moist zones in WV images
- the development of the CBs
|
|
19 June 2005/18.00 UTC - Meteosat 8 WV 6.2 image; position of vertical cross section indicated
|
|
|
Isentropes
|
|
19 June 2005/18.00 UTC - Vertical cross section; black: isentropes (ThetaE)
|
|
|
Relative humidity
|
|
19 June 2005/18.00 UTC - Vertical cross section; black: isentropes (ThetaE), blue: relative humidity
|
|
|
Weather Events
In the case of no orography, cloudiness in middle and high levels dominates with slight to moderate rain or drizzle
| Parameter | Description |
| Precipitation |
|
| Temperature | Diurnal heating at the surface |
| Wind (incl. gusts) | Variable, gusty local winds in connection with convective activity |
| Other relevant information | Small scale convective cells and cell complexes |
|
|
|
19 June 2005/12.00 UTC - Meteosat 8 WV 6.2 image; weather events (green: rain and showers, blue: drizzle, cyan: snow, red:
thunderstorm, yellow: fog, black: no precipitation)
|
19 June 2005/18.00 UTC - Meteosat 8 WV 6.2 image; weather events (green: rain and showers, blue: drizzle, cyan: snow, red:
thunderstorm, yellow: fog, black: no precipitation)
|
|
|
|
|
|
28 July 2005/12.00 UTC - Meteosat 8 WV 6.2 image; weather events (green: rain and showers, blue: drizzle, cyan: snow, red:
thunderstorm, yellow: fog, black: no precipitation)
|
28 July 2005/15.00 UTC - Meteosat 8 WV 6.2 image; weather events (green: rain and showers, blue: drizzle, cyan: snow, red:
thunderstorm, yellow: fog, black: no precipitation)
|
References
General Meteorology and Basics
- BANTA, R.M., (1990): The Role of Mountain Flows in Making Clouds, Met. Monographs, 23, 229pp
- KRENNERT, T., 2001: Tracking of convective cells, Diploma thesis, University of Vienna
- PISUTOVA, Z., (1997): "Introduction and main ideas of the project ":Verification of ALADIN pseudo-TEMPs (VaPT)", Proceedings of the 3rd RC LACE/ALADIN workshop on the use of ALADIN products in forecasting practise and verification matters, BUDAPEST, 16-18 June, 1997
- PRUPPACHER, H.R., KLETT, J.D., (1978): Microphysics of Clouds and Precipitation. Reidel PUBL., Dortrecht
- RASMUSSEN, EN., BLANCHARD, D.O., (1998): A Baseline Climatology of Sounding - Derived Supercell and Tornado Forecast Parameters, AMS, Weath. a. Forec., 13, 1148pp
- SEIDL, H., (1997): "Verification of pseudo-TEMPs in Austria by means of VApT software and other tools", Proceedings of the 3rd RC LACE/ALADIN workshop on the use of ALADIN products in forecasting practise and verification matters, BUDAPEST, 16-18 June, 1997
- STEINACKER, R., (1977): Möglichkeiten von Gewitterprognose im Gebirge, Wetter und Leben, Jg28, 150pp
- WILSON, J., et al., (1998): Nowcasting Thunderstorms: A status report. Bull. Amer. Soc., 79, 2079pp
Specific Satellite Meteorology
- BROWNING, K.A., Harrold, T.W., 1970: Air Motion and Precipitation Growth at a Cold Front. Q. J. R. Meteorol. Soc., 96, 369pp
- BLUESTEIN, H.B., Jain, M.H., 1985: Formation of Mesoscale Lines of Precipitation: Severe Squall Lines in Oklahoma During Spring. J. Atmos. Sci., 42, 1711p
- DOSWELL, C.A. III, 1987: The Distinction between Large -Scale and Mesoscale Contribution to Severe Convection: A Case Study Example. Weath. a. Forec., 2, 3pp.
- GEORGIEV C. G., 1999: Quantitative Relationship between Meteosat WV Data and Positive Potential Vorticity Anomalies: A Case Study over the Mediterranean. Meterol. Appl., 6, 97pp
- KRENNERT, T., Zwatz-Meise, V., 2003: Initiation of convective cells in relation to water vapour boundaries in satellite images, Atmos. Res., Vol 67-68C pp 353-366
- LIOU, K.N., 2002: An Introduction to Atmospheric Radiation. Second edition, Academic Press, p87.
- MADDOX, R.A., Doswell, C. A. III, 1982: An Examination of Jet Stream Configurations, 500 mb Vorticity Advection and Low Level Thermal Advection Patterns During Extended Periods of Intense Convection. Mon. Wea. Rev. 110, 184 pp.
- MARTIN, F., Elizaga, F., Riosalido, R., 1999: The Mushroom Configuration in Water Vapour Imagery and Operational Applications. Meteorol. Appl., 6, 143 pp.
- PIELKE, R.A., Segal, M., 1986: Mesoscale circulations forced by differential terrain heating. Mesoscale Meteorology and Forecasting, AMS, Ch.22.
- RASMUSSEN, E.N., Blanchard, D.O., 1998: A Baseline Climatology of Sounding - Derived Supercell and Tornado Forecast Parameters. AMS, Weath. a. Forec., 13, 1148pp.
- SZOKE, E.J., Weisman, M. L., Brown, J. M., Caracena, F., Schlatter, T.W., 1984: A Subsynoptic Analysis of the Denver Tornadoes of 3 June 1981. Mon. Wea. Rev. 112, 790 pp.
- WANDISHIN, M.S., Nielsen-Gammon, J.W, Keyser, D., 2000: A Potential Vorticity Diagnostic Approach to Upper Level Frontogenesis within a Developing Baroclinic Wave. Journ. Atmos. Sci., 57, 3918pp
- WEISMAN, M.L., KLEMP, J.B., 1984: The Structure and Classification of Numerically Simulated Convective Storms in Directionally Varying Wind Shears. Mon. Wea. Rev. 112, 2479 pp
- WERNLI, H., Dirren, S., Liniger, M.A., Zillig, M., 2002: Dynamical Aspects of the Life Cycle of the Winterstorm Lothar (24-26 December 1999). Quart. Journ. Roy. Met. Soc., 128, 405pp
- ZWATZ-MEISE, V., Krennert T., Winkler, R., Zeiner, B., 2002: Manual of Synoptic Satellite Meteorology. ZAMG, CD-ROM, V4.0