Table of Contents
Cloud Structure In Satellite Images
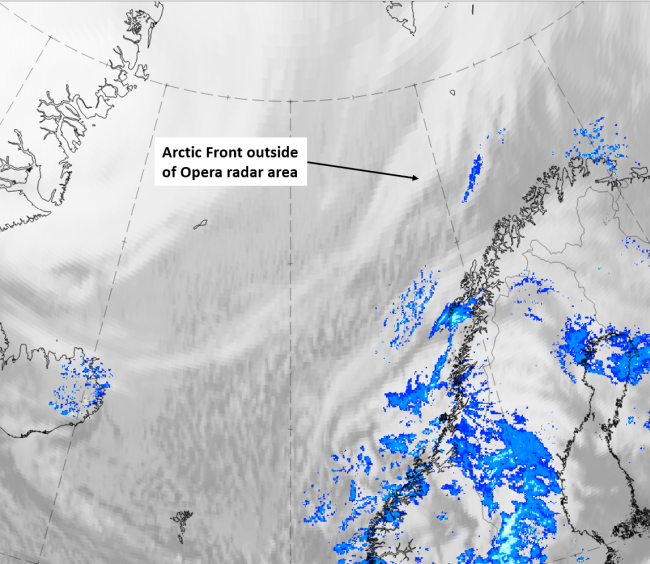
Arctic Fronts form in the Arctic region, and move southwards. When they reach northern Europe, they have usually travelled over an open sea, and convective clouds have developed. The appearance of an Arctic Cold Fronts is, then, essentially the same as that of a shallow Cold Front.
Arctic Cold Fronts are usually so far north that Meteosat images alone are inadequate to recognize them. Moreover, the following conceptual models may look like Arctic Cold Fronts: polar Cold Front, Polar Low and Comma. The final check is best made using a loop of AVHRR images with the help of numerical model parameter fields.
Appearance in the basic channels:
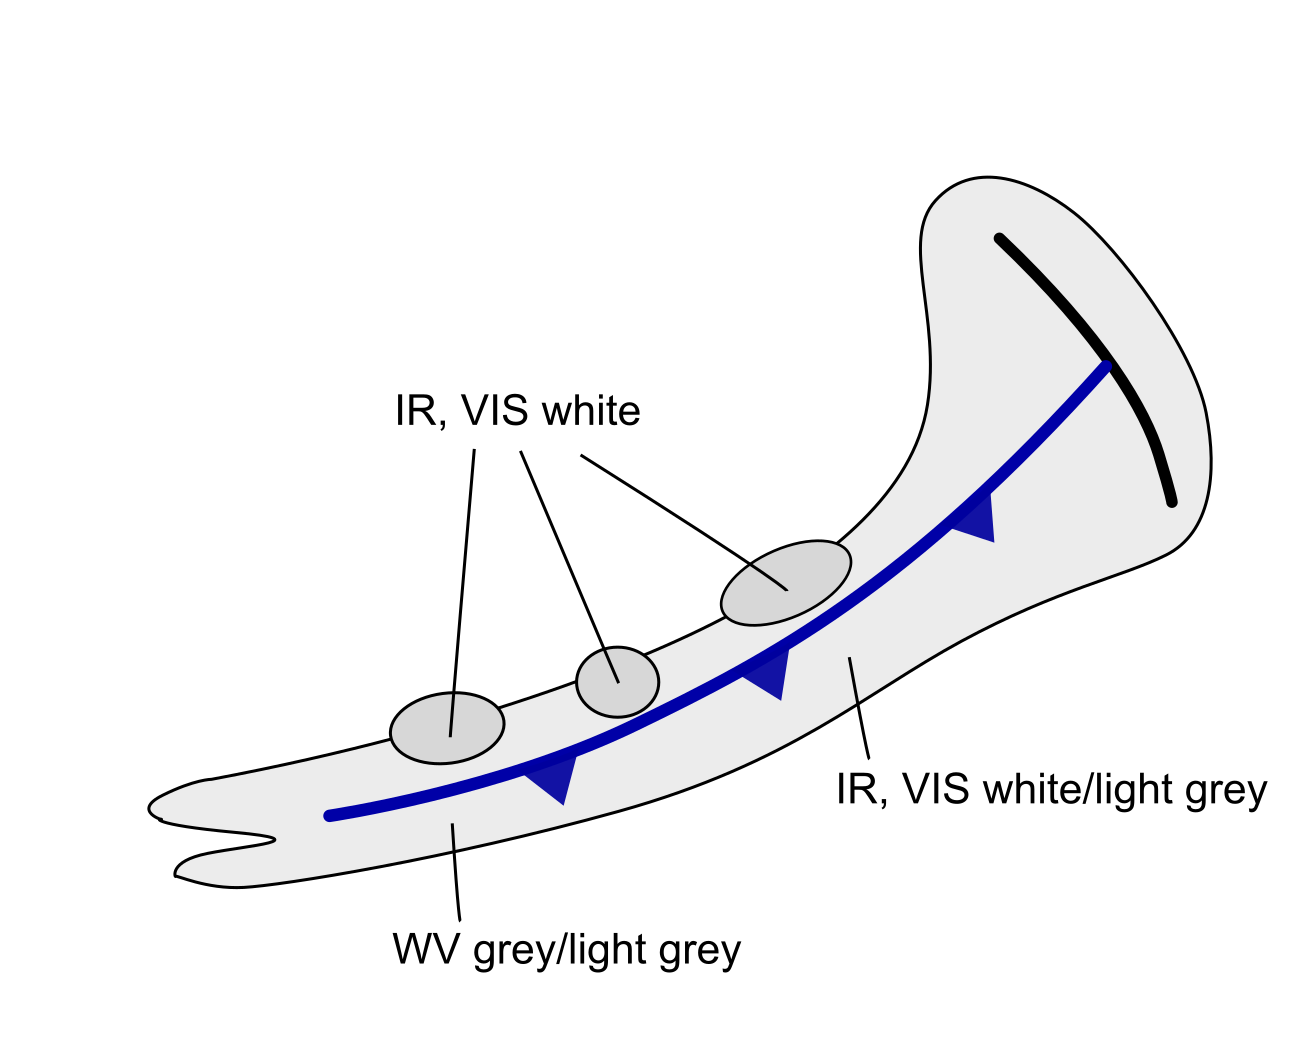
- light grey to white band in IR and VIS images
- light grey to grey band in WV images
|
Appearance in the basic RGBs:
For this kind of front the rear side of the cloud band is of particular interest.
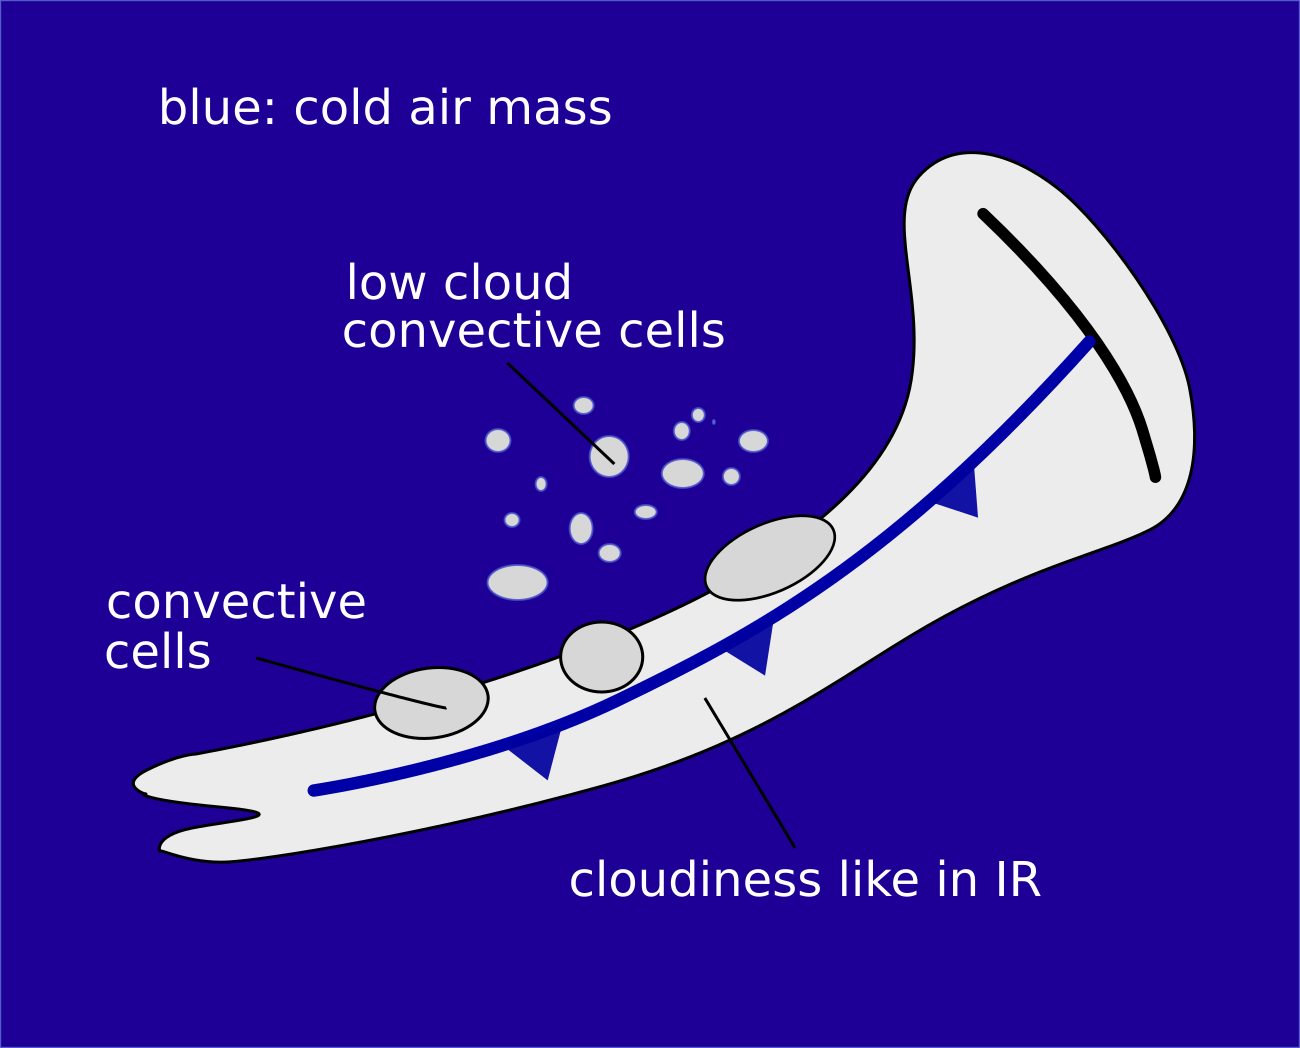
Airmass RGB:
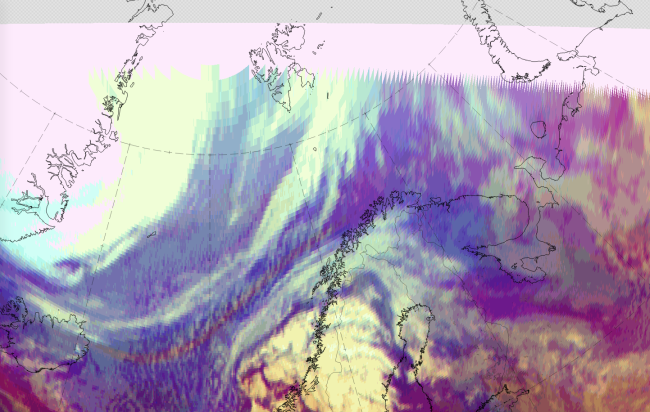
At the rear side of an Arctic Front, arctic cold air protrudes southward. Consequently, most of the cases show dark blue colours. Occasionally dark brown colours also occur, indicating very dry air.
The cloud band itself appears very similar to that in the IR image.
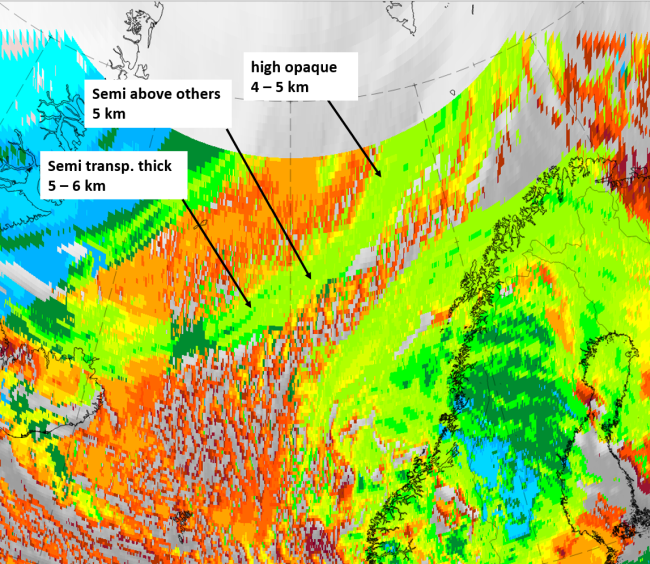
Dust RGB:
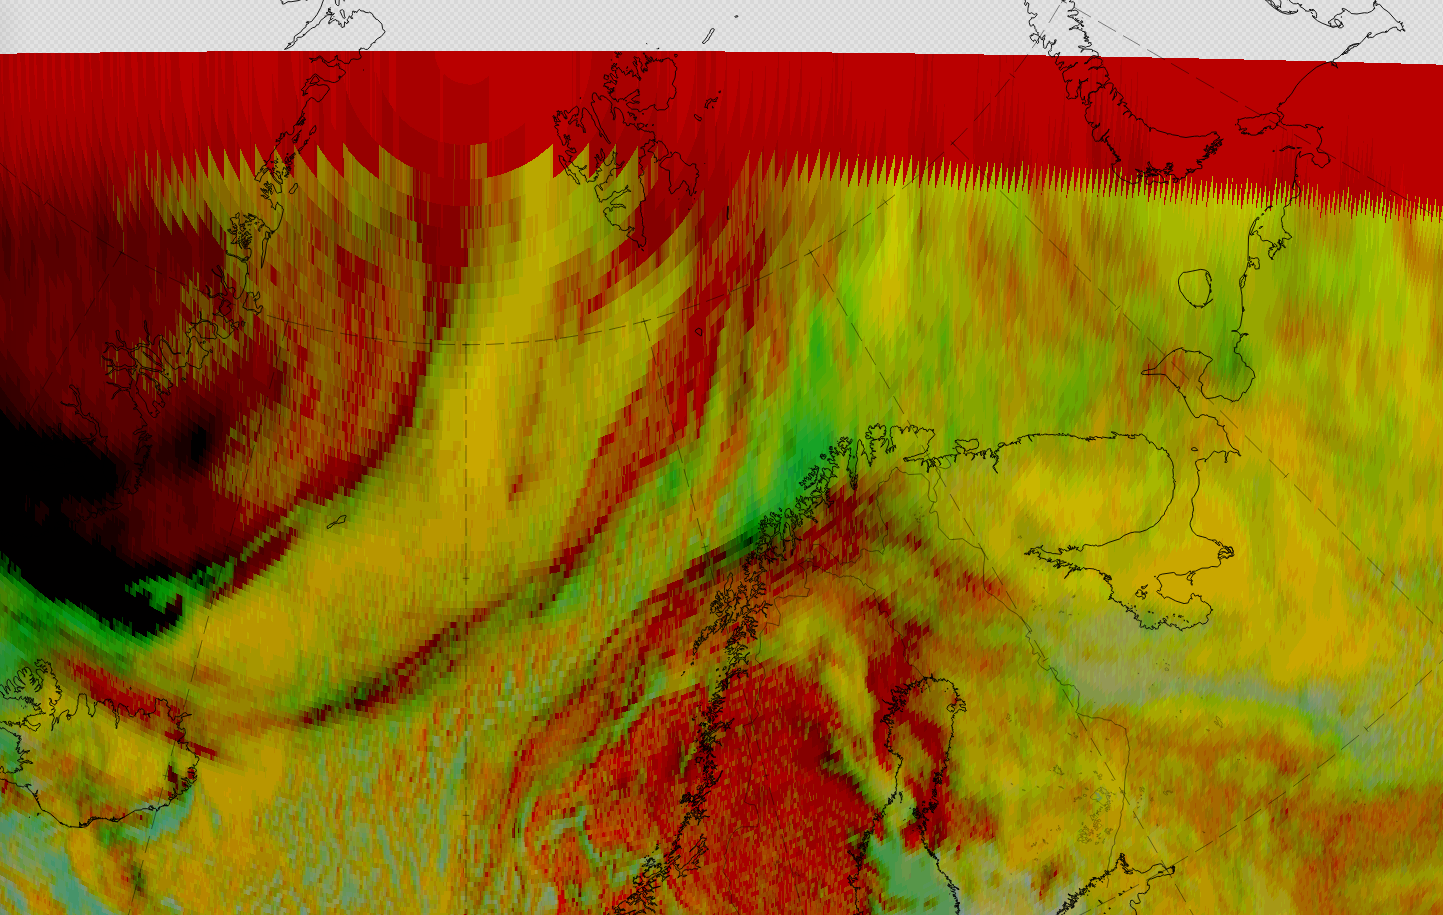
At the rear side of an arctic front, green and yellowish colours predominate. The yellowish colours represent extended low water cloud and the green colours represent semi-transparent mid-level cloud.
Dark red colours indicate areas with thick ice cloud; they mostly appear as small lines above ochre colours, which indicate the lower cloud. There is quite often no visible boundary between the low cloud of the frontal band and the low cloud at the rear.
 |
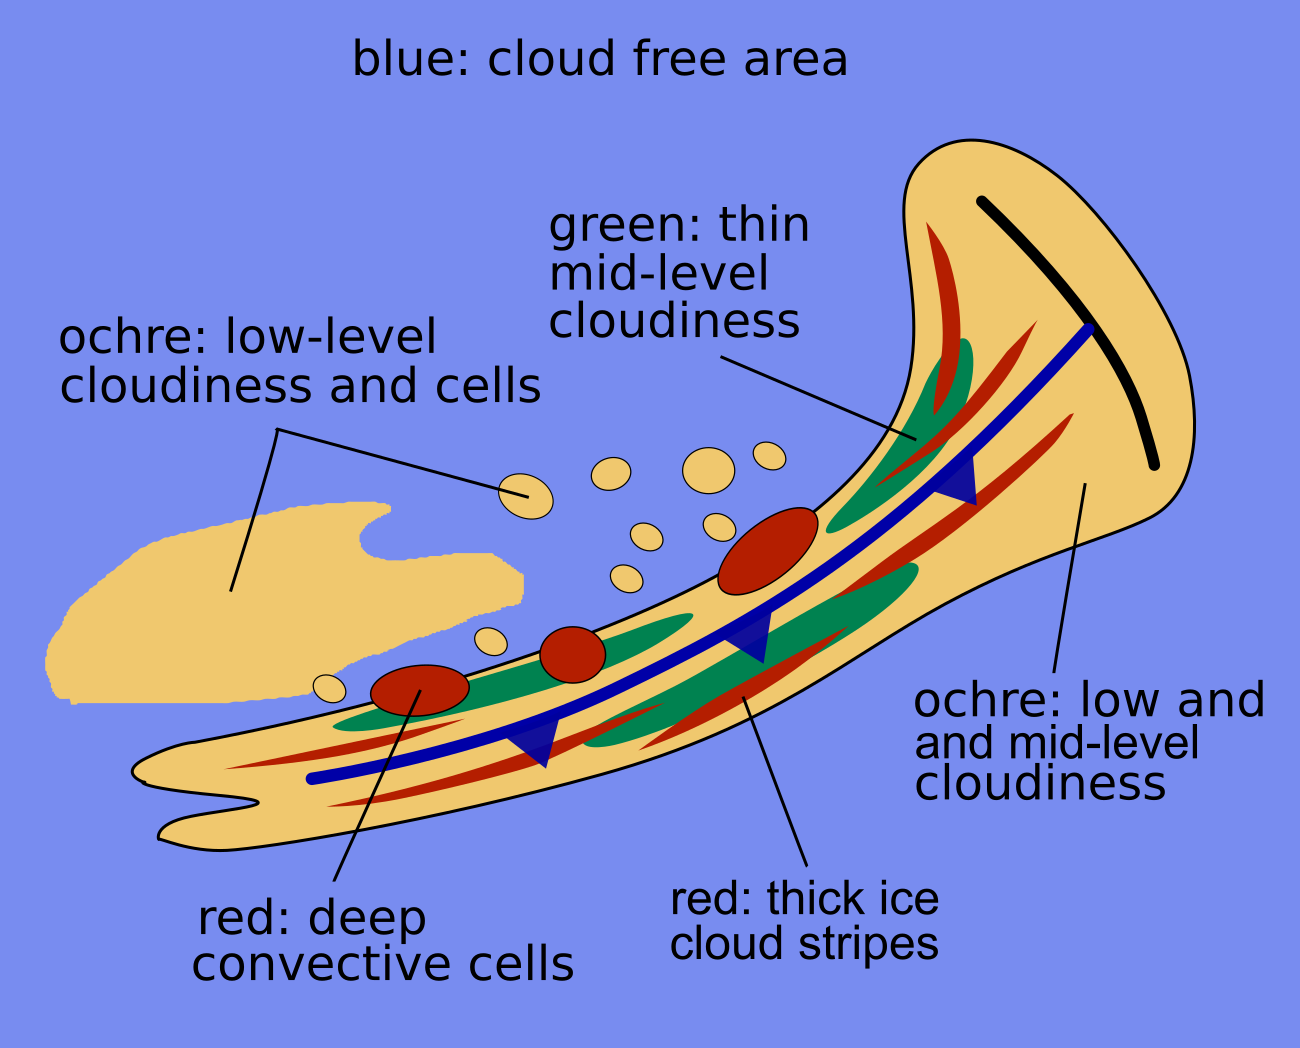 |
Legend: basic RGBs schematics. Left: Airmass RGB; right: Dust RGB.
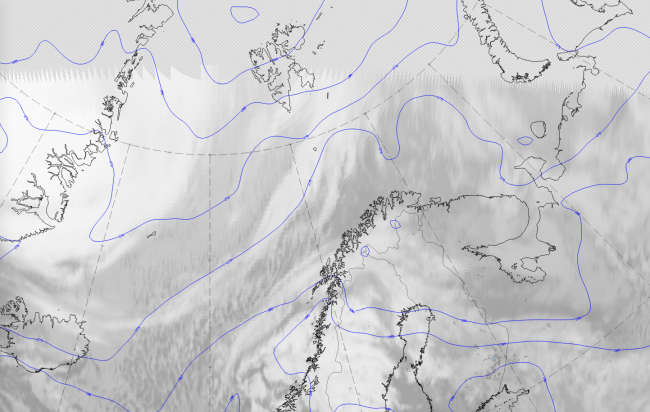
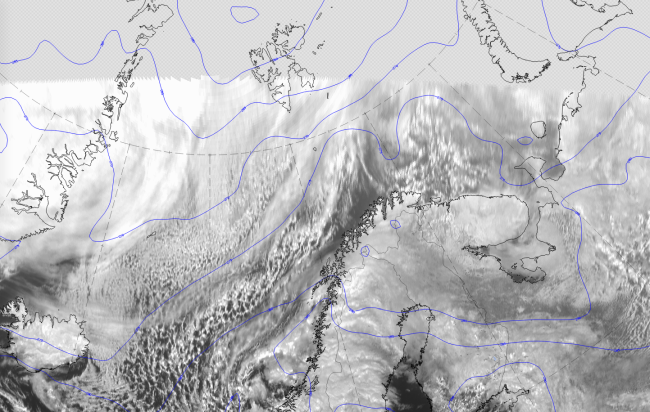
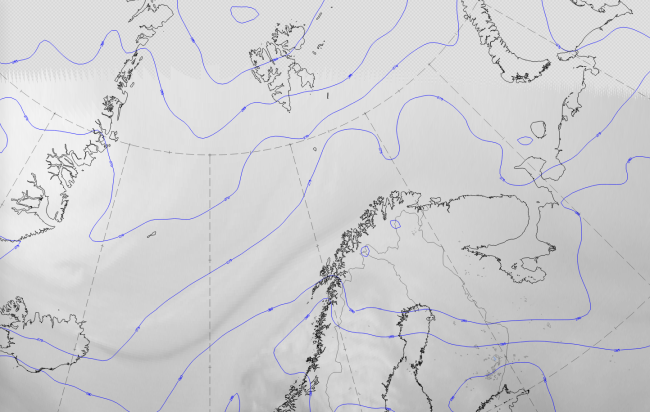
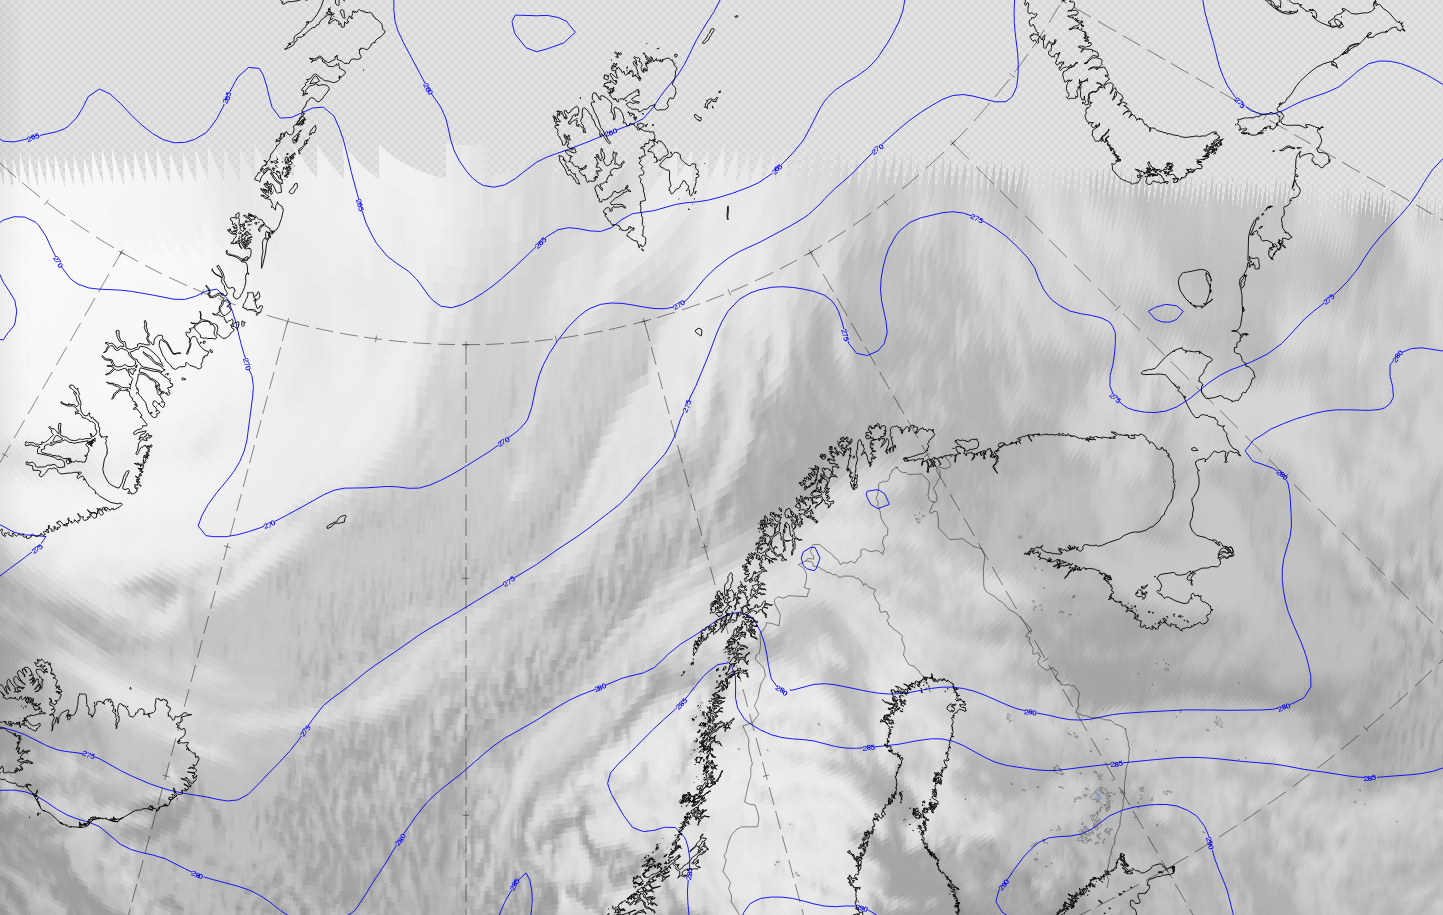
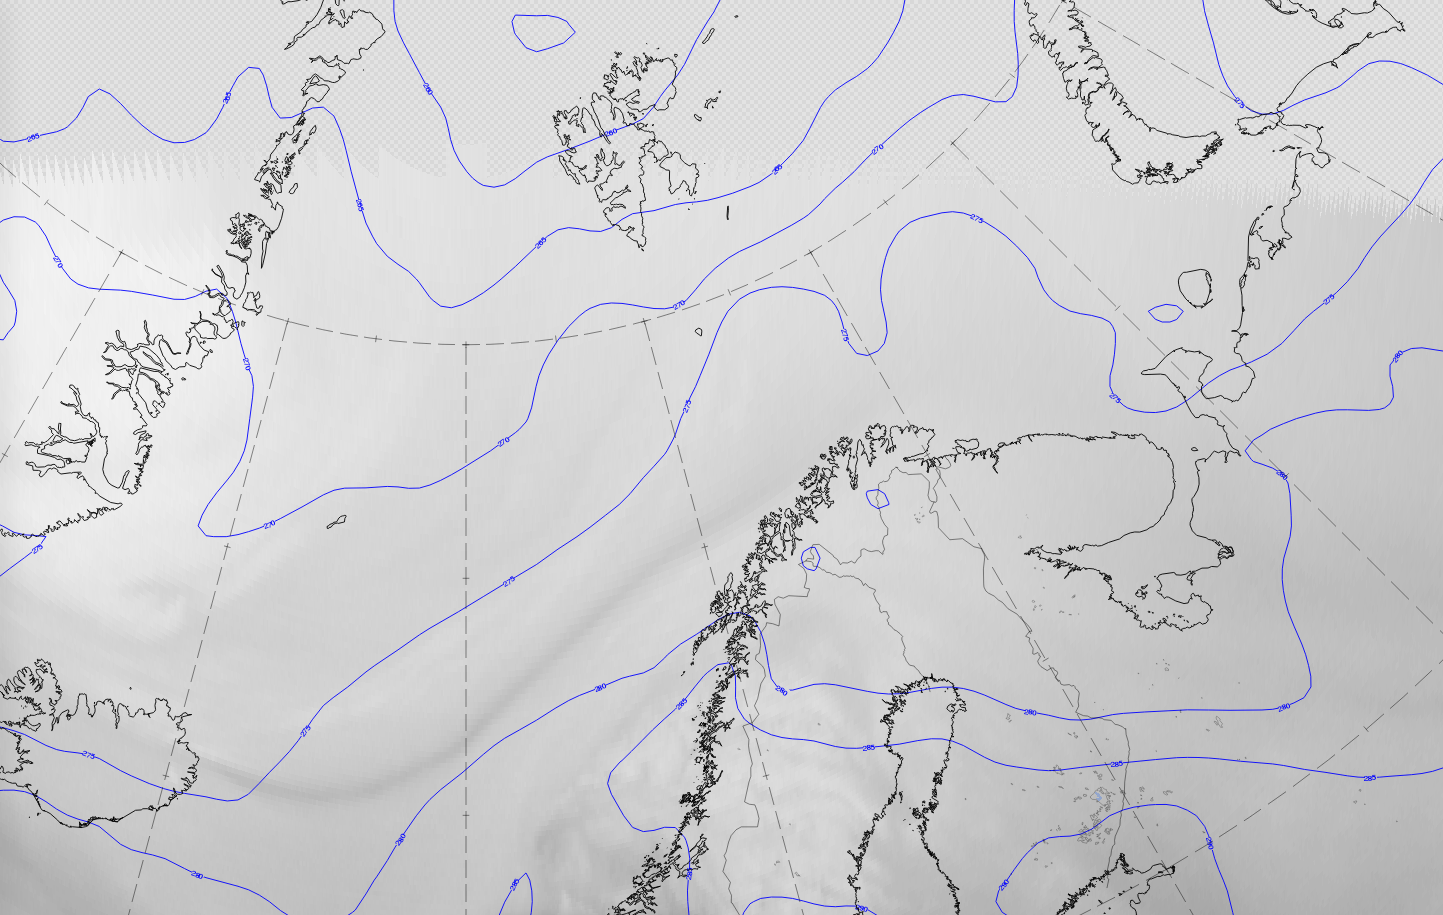
The case from 2 April 2020 at 12 UTC is a good example of an Arctic front at the leading side of a polar cold air outbreak. Such a polar outbreak is a very important condition for an Arctic cold front, so isolines of equivalent potential temperature (Theta E) at 850 hPa are superimposed as blue lines. The cloud band of the Arctic front is in front of a cold air trough with its centre north of Svalbard extending across the Arctic ocean south-westward to about 70 N.
|
|
|
|
Legend:
2 April 2020, 12UTC: 1st row: IR (above) + HRV (below); 2nd row: WV (above) + Airmass RGB (below); 3rd row: Dust RGB + image gallery.
*Note: click on the image to access the image gallery (navigate using arrows on keyboard)
| IR | Grey colours with a dark grey area behind. This is typical for mid-level cloud. |
| HRV | Dark grey colours, partly translucent. |
| WV | Broad dark grey area. |
| Airmass RGB | Blue colours in front of and behind the cloud band. This represents cold air. |
| Dust RGB | Dark red cyclonically curved band, partly fibrous. This reflects the areas with higher ice cloud. In front of and behind the cold front band, ochre and green colours prevail. The ochre represents the mid-level cloud, the green represents translucent mid-level clouds. |
Meteorological Physical Background
An Arctic Cold Front is a boundary between arctic and polar air masses. An Arctic air mass forms, when the air above a snow/ice covered surface cools down due to very low solar heating and strong heat emission from the surface. Consequently, it is only found above the polar ice areas. The Arctic Cold Fronts come to Northern Europe only during the winter season, from October to March.
It can be stated that the air mass is arctic, when the 850 hPa temperature is -18°C or lower. The corresponding threshold value for Θe at 850 hPa depends slightly on the humidity of the air mass, but is usually around -4°C. The temperature at 500 hPa is -40°C or lower.
Using this threshold, the image below shows the mean position of the arctic air mass in January.
|
The mean location of Arctic air mass in January (1971-2000); blue: temperature range 254K to 256K
|
|
We can clearly see that the effect of warm sea currents (particularly the Gulf Stream) pushes the arctic air on an average near to the 75th northern latitude, whereas over the cold continental area in North America and Siberia the Arctic air mass extends even to 50thnorthern latitude.
As stated in Common Remarks, the Arctic Cold Fronts are classified into two categories:
- Baroclinic front
- A Wave with a Warm and a Cold Front forms in a thermal gradient zone accompanied by a weak arctic jet found at 700-500 hPa. It can develop into an Occlusion, or disappear.
- The systems come to Northern Europe within a cold flow, therefore, the Warm Front is very weak and disappears quickly.
- A Back Bent Occlusion often forms in mature systems.
- Most arctic fronts are of this type.
- The difference between Polar and Arctic Cold Fronts:
- Arctic frontal zones are restricted to the lower troposphere
- In arctic situations the tropopause is higher than the top of the front, and often difficult to detect
- There is no jet at 300 hPa over Arctic Fronts
- With Arctic Fronts the only precipitation is in the form of snow
- Arctic systems occlude faster
- Ice/sea boundary front
- The front is formed over the boundary between the relatively warm sea and cold ice and is advected south with the basic flow.
- There is only a Cold Front present.
- Small scale convective cells form immediately behind the front.
Key Parameters
- Θe 850 hPa
The air mass behind an Arctic Cold Front is -4°C (269K) or colder. - Temperature Advection 850 hPa
The Arctic Cold Front is partly or entirely within cold advection. - Height Contours 700 hPa
There is a trough on the top of the arctic frontal zone. - PVA 700 hPa
PVA connected to the upper trough
Θe 850 hPa
|
23 March 2009/12.00 UTC - Meteosat VIS 0.6 image; magenta: θe 850 hPa. The location of the Arctic Front is shown.
|
|
|
|
Temperature Advection 850 hPa
|
23 March 2009/12.00 UTC - Meteosat VIS 0.6 image; red dashed: temperature advection - CA 850 hPa, red solid: temperature advection -
WA 850 hPa
|
|
|
|
Height Contours 700 hPa
|
23 March 2009/12.00 UTC - Meteosat VIS 0.6 image; red: height contours 700 hPa
|
|
|
|
PVA 700 hPa
|
23 March 2009/12.00 UTC - Meteosat VIS 0.6 image; green: PVA 700 hPa
|
|
|
|
Typical Appearance In Vertical Cross Sections
- Isentropes
- A shallow frontal zone in the lower troposphere
- The tropopause often unclear
- Temperature advection
Cold advection within and behind the frontal zone - Divergence
Convergence within the frontal zone and divergence above it - Vertical Motion (Omega)
Ascending motion ahead of the frontal zone and descending motion behind it
|
23 March 2009/11.29 UTC NOAA 18 VIS0.6; VIS0.9; IR10.9 RGB image; position of vertical cross section indicated
|
|
Temperature advection
|
23 March 2009/12 UTC - Vertical cross section; black: isentropes (θe), red thick: temperature advection - WA,
red thin: temperature advection - CA
|
|
|
|
Divergence
|
23 March 2009/12 UTC - Vertical cross section; black: isentropes (θe), magenta thick: convergence, magenta thin:
divergence
|
|
|
|
Vertical Motion (Omega)
|
23 March 2009/12 UTC - Vertical cross section; black: isentropes (θe), cyan thick: vertical motion (omega) - upward
motion, cyan thin: vertical motion (omega) - downward motion
|
|
|
|
Weather Events
The precipitation connected with Arctic Cold Fronts is in the form of snow.
| Parameter | Description |
| Precipitation |
|
| Temperature |
|
| Wind (incl. gusts) |
|
| Other relevant information |
|
|
|
|
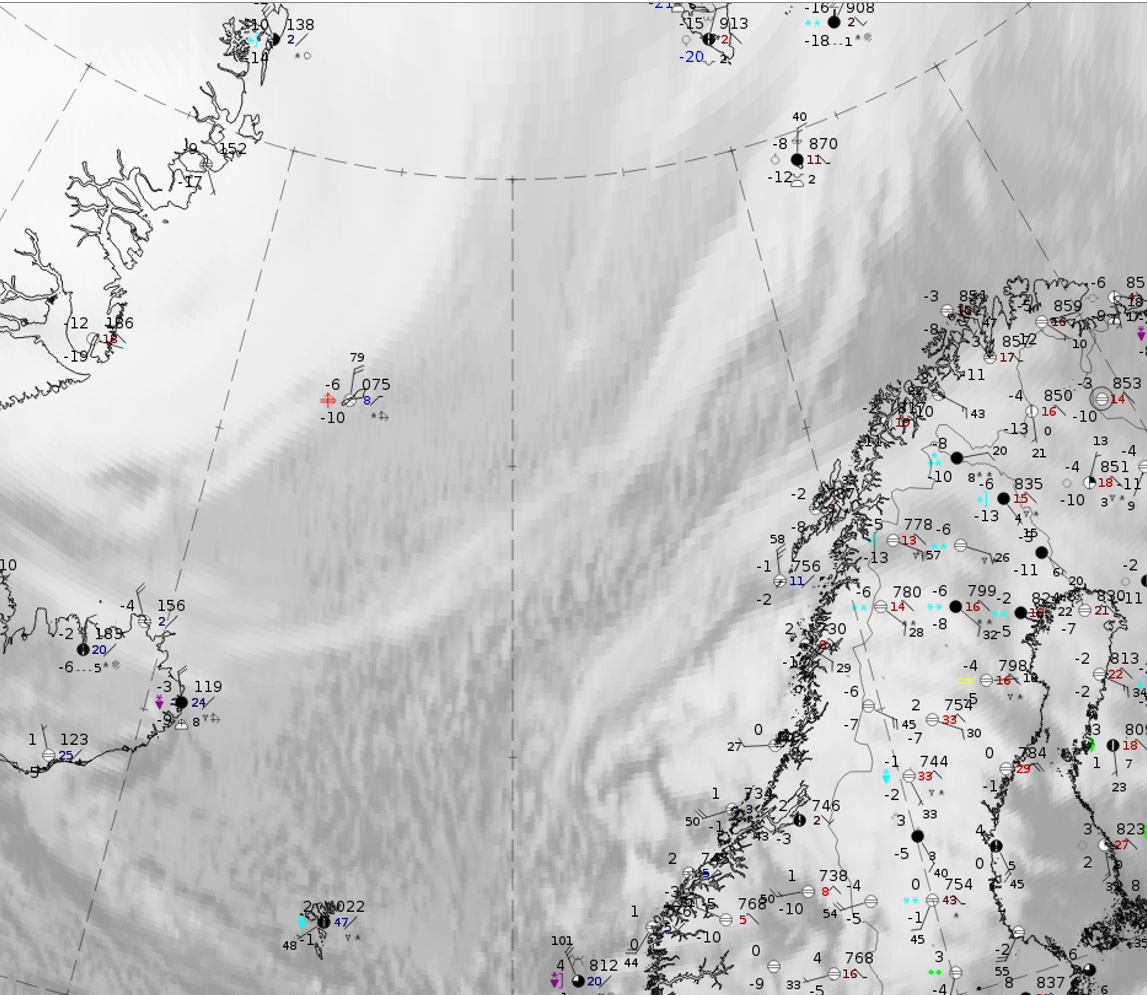
Legend:
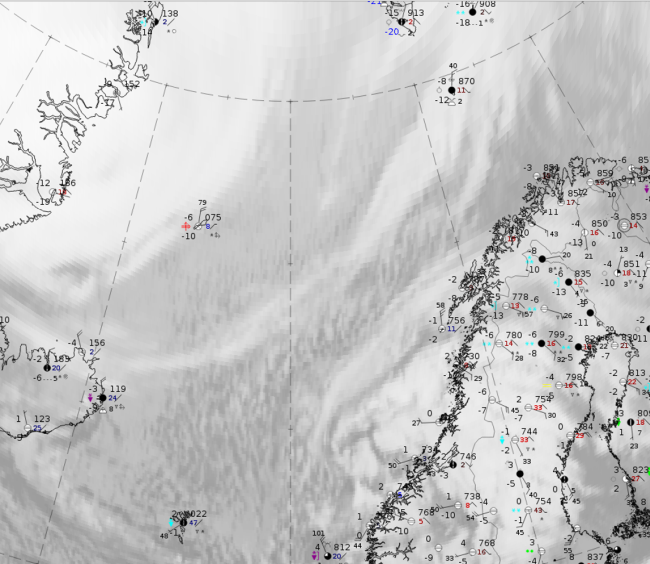
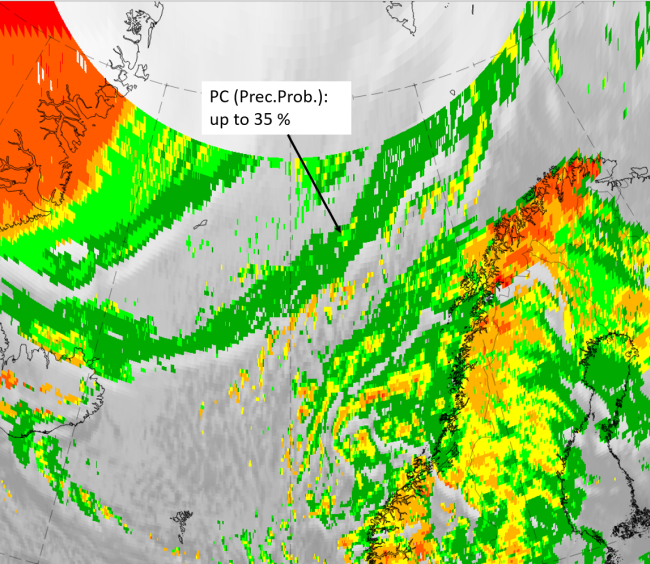
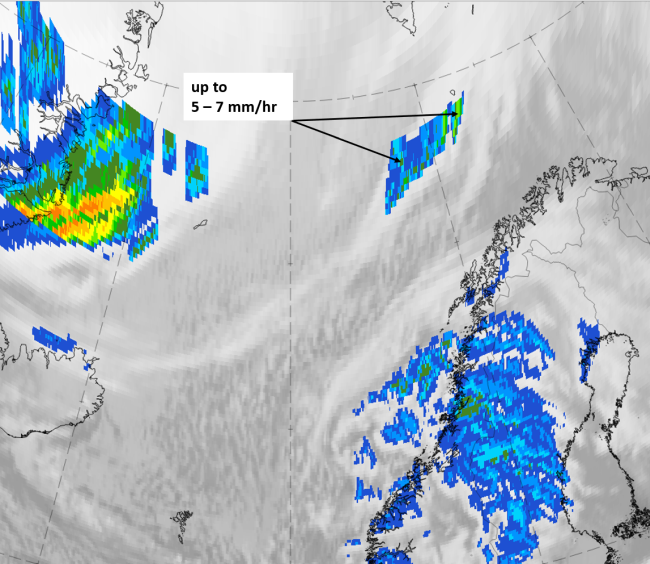
2 April 2020 at 12UTC: IR + synoptic measurements (above) + probability of moderate rain (Precipitting clouds PC - NWCSAF).
Note: for a larger SYNOP image click this link.
Because of the geographical location of Arctic Cold Fronts, there are not many synoptic stations available to demonstrate the typical weather features. In the case from 2 April at 12 UTC, snowfall can be detected in the northern part and convection with showers in the southern part. The probability of moderate precipitation, computed from the NWCSAF only for geographical latitudes < 75 N, is very low, with values up to 35 %.
|
|
|
|
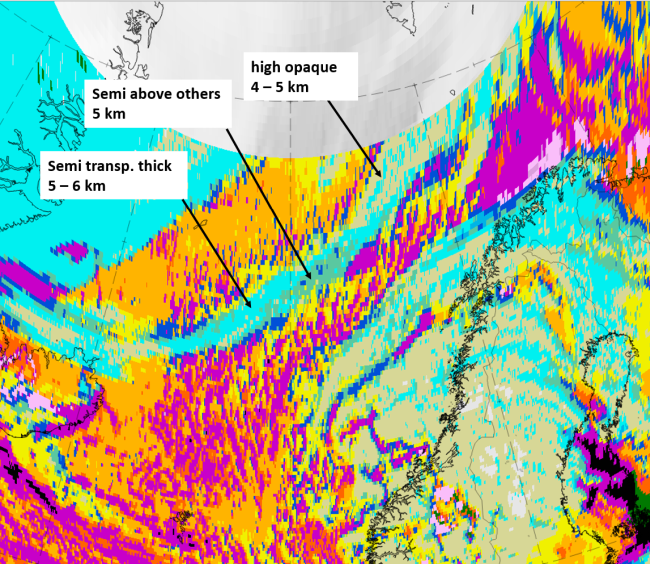
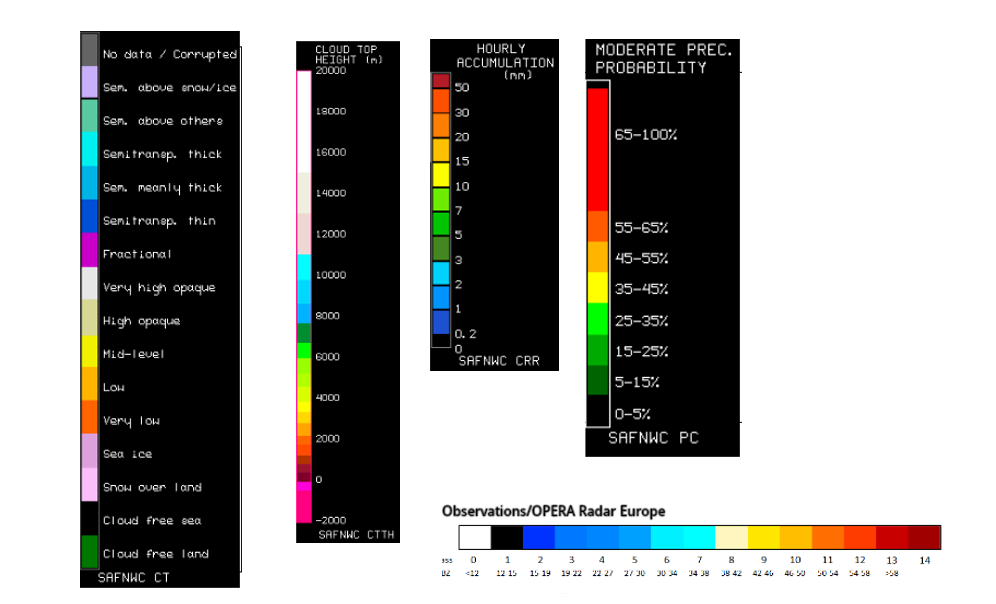
Legend:
2 April 2020 at 12 UTC, IR, with the following fields superimposed:
1st row: Cloud Type (CT NWCSAF) (above) + Cloud Top Height (CTTH - NWCSAF) (below); 2nd row: Convective Rainfall Rate (CRR NWCSAF) (above) + Radar intensities from Opera radar system (below).
For identifying values for Cloud type (CT), Cloud type height (CTTH), precipitating clouds (PC), and Opera radar for any pixel in the images look into the legends. (link)
References
General Satellite Meteorology
- BADER M. J., FORBES G. S., GRANT J. R., LILLEY R. B. E. and WATERS A. J. (1995): Images in weather forecasting - A practical guide for interpreting satellite and radar imagery; Cambridge University Press
Specific Satellite Meteorology
- AMAP (Arctic Monitoring and Assessment Program) 1998 Oslo, Norway
- Comet web site http://meted.ucar.edu/
- PELKONEN A (2002): Arktinen Rintama, Helsingin Yliopisto
- PELKONEN, A (2004): European forecaster newsletter, Volume, 10, http://www.euroforecaster.org/newsletter10/finland.pdf