Table of Contents
Cloud Structure In Satellite Images
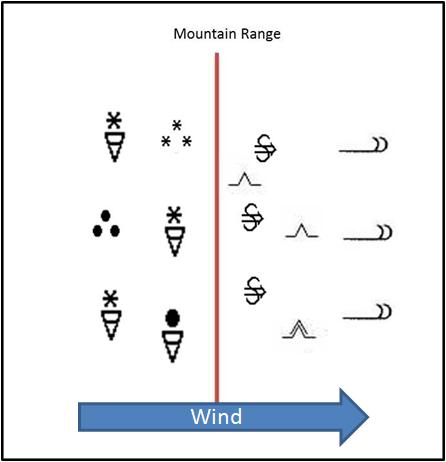
The mountain waves that accompany Zonda events can be identified by certain distinct characteristics. These traits are commonly observed around the world in places where downslope windstorms develop.
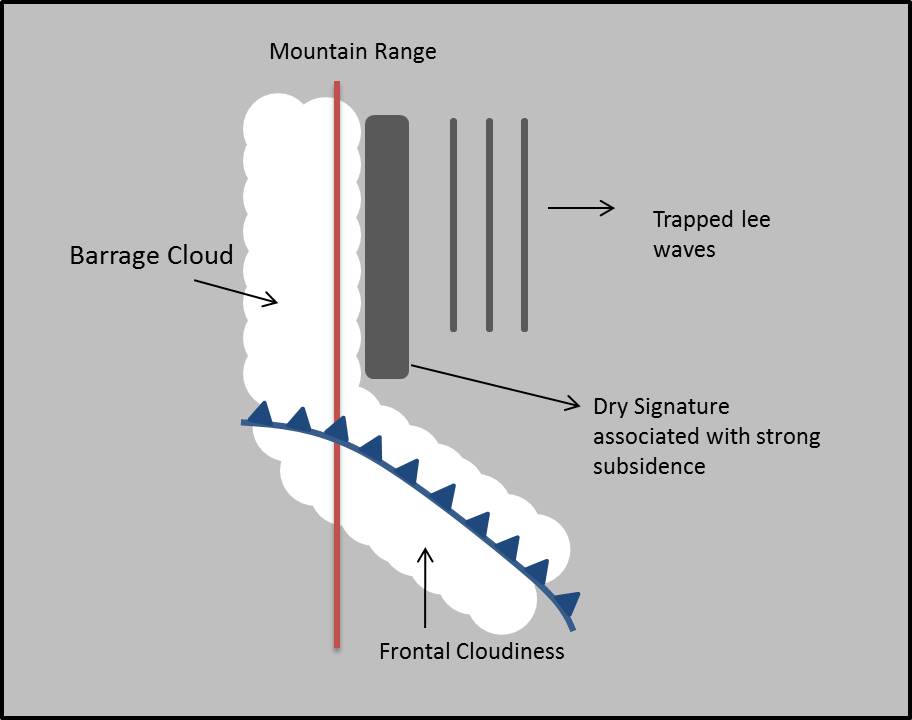
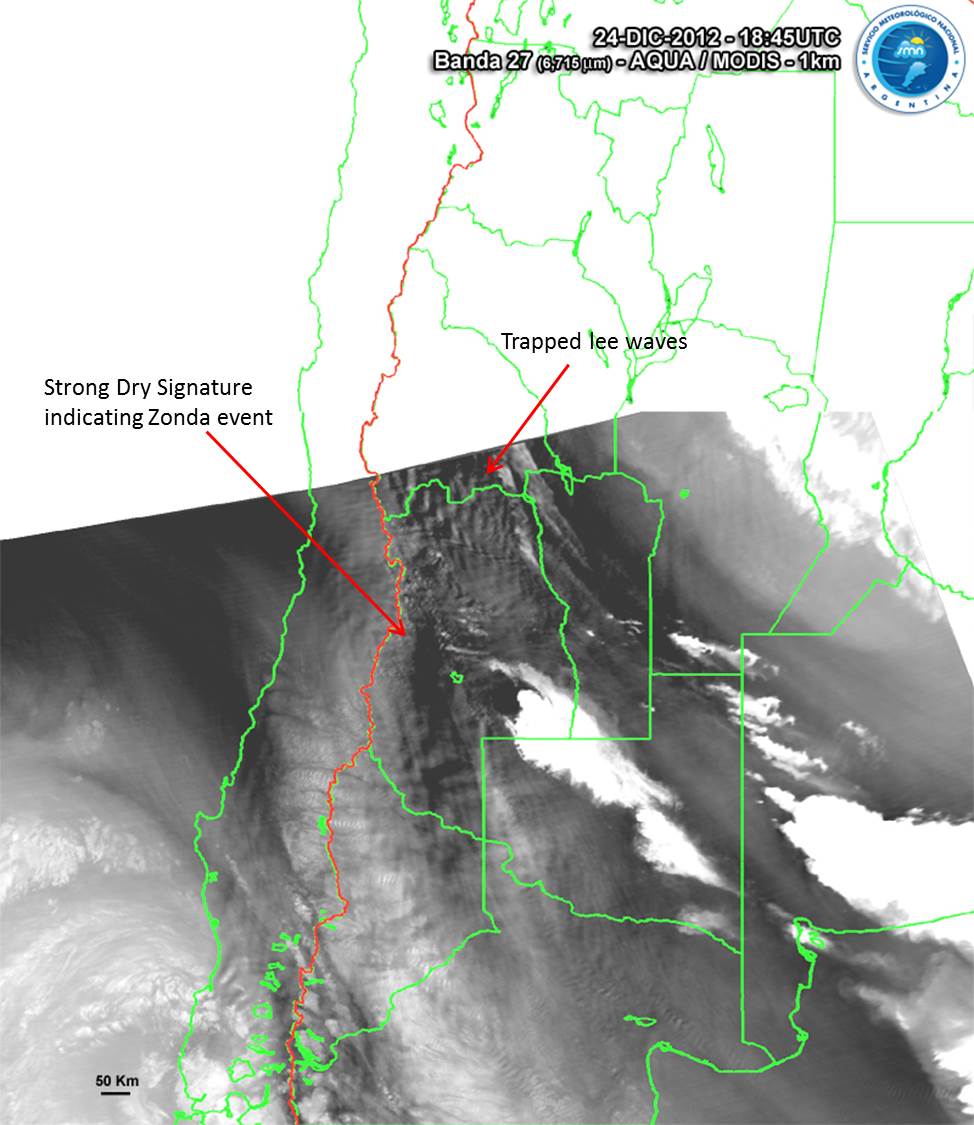
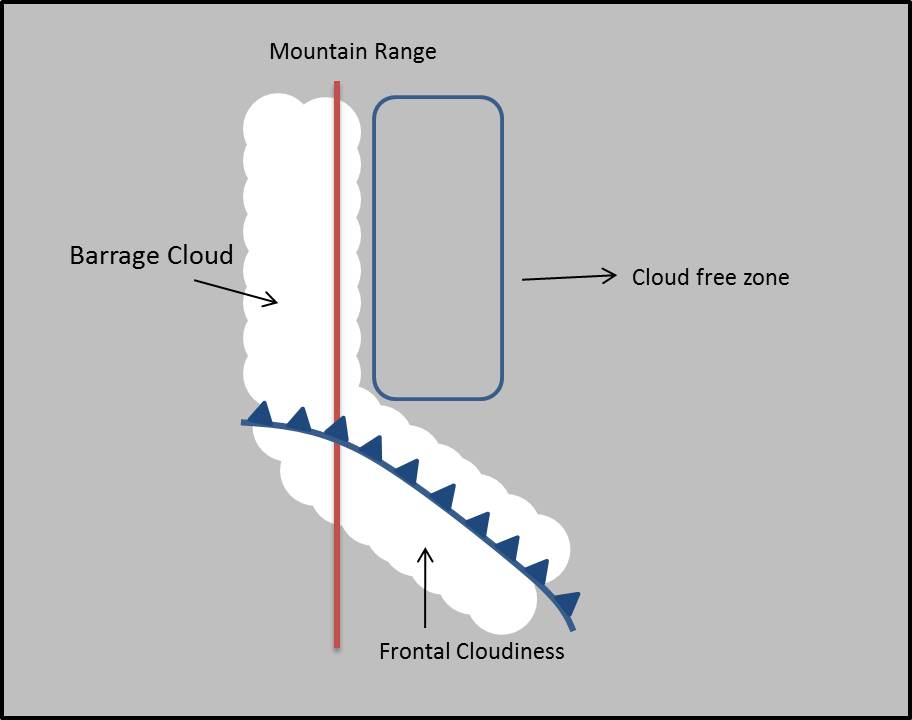
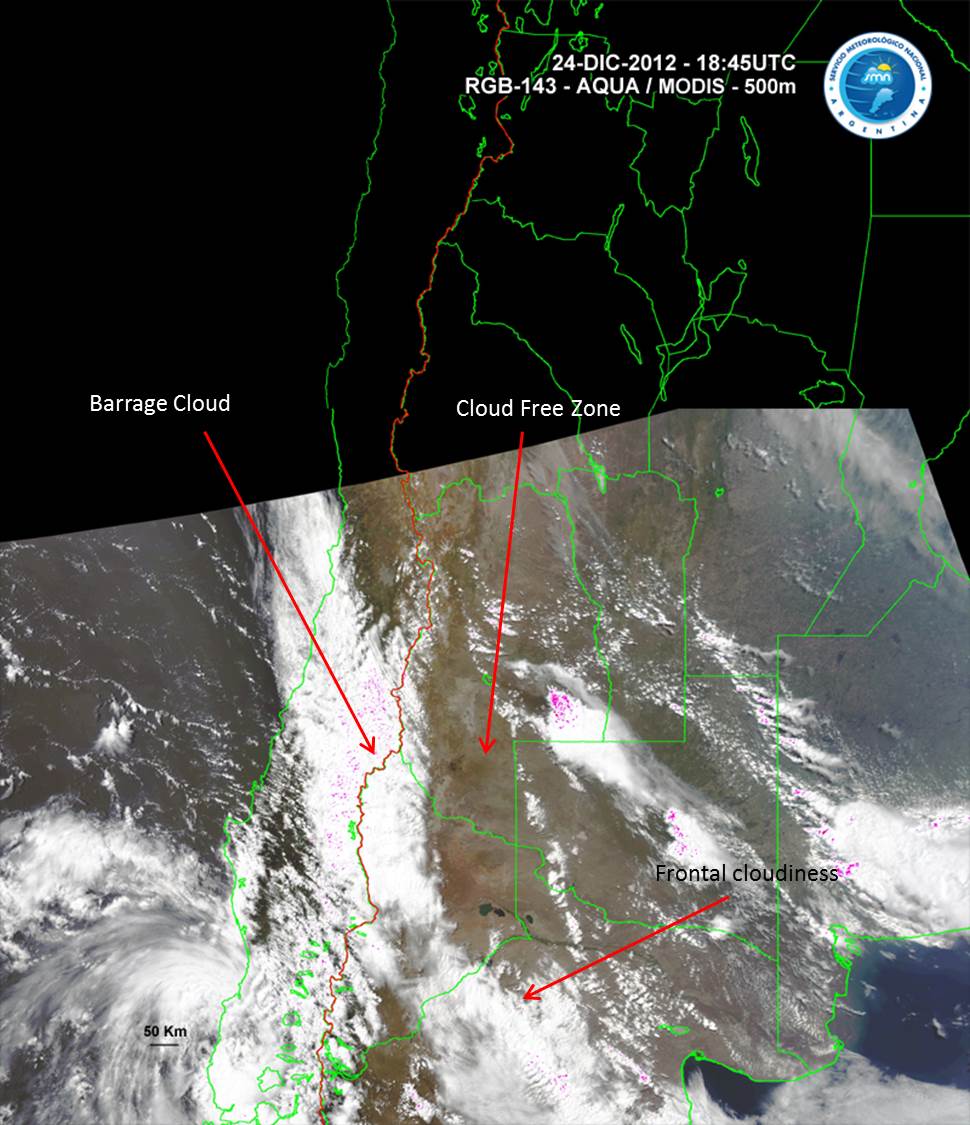
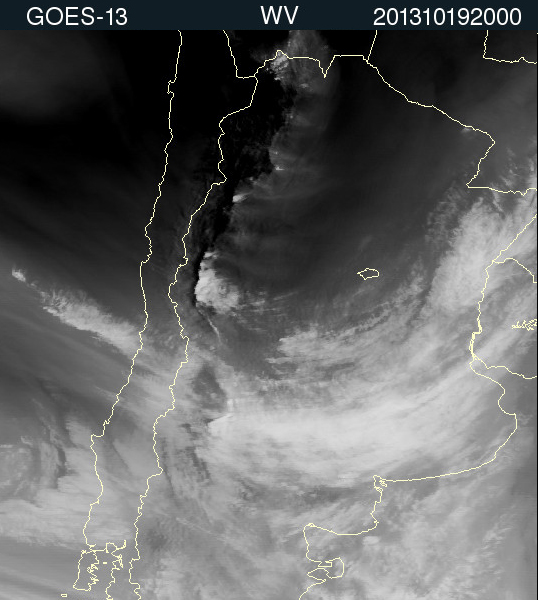
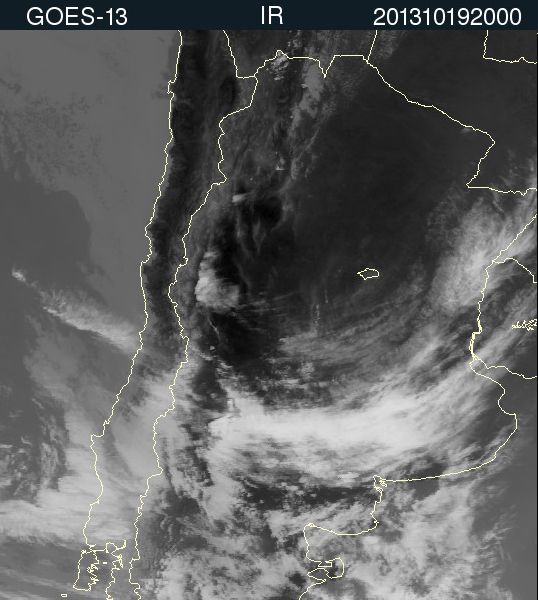
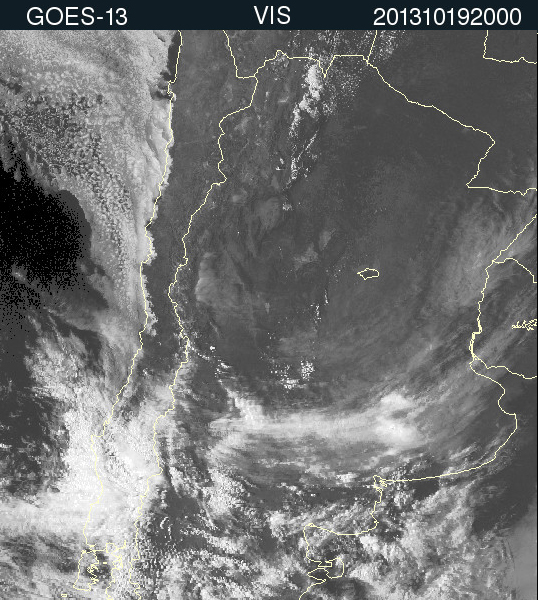
The most distinctive characteristic of this phenomenon is the presence of a very dry zone on the lee side of the mountain range, associated with sinking motion and adiabatic warming. This feature is usually clearly seen in water vapor imagery, while in infrared and visible images it only appears as a cloud-free zone. Forced ascent on the windward side generates an area of cloudiness over the mountain slope, the so-called 'barrage cloud'.
A series of trapped lee waves occasionally develop and spread east of the mountain range. This feature can be seen in the IR and VIS images only if there is enough humidity for the formation of clouds. These clouds typically form long, parallel bands. The descent region of these lee waves can be seen in WV imagery, even if there is no cloud formation. Dust lifted by wind is sometimes observed in visible imagery and RGB composites, indicating strong winds near the surface.
|
Schematic of water vapor satellite imagery during a Zonda event.
|
24 December 2012/18:45 UTC - AQUA/MODIS Band 27 (WV-6.715) image.
|
|
|
|
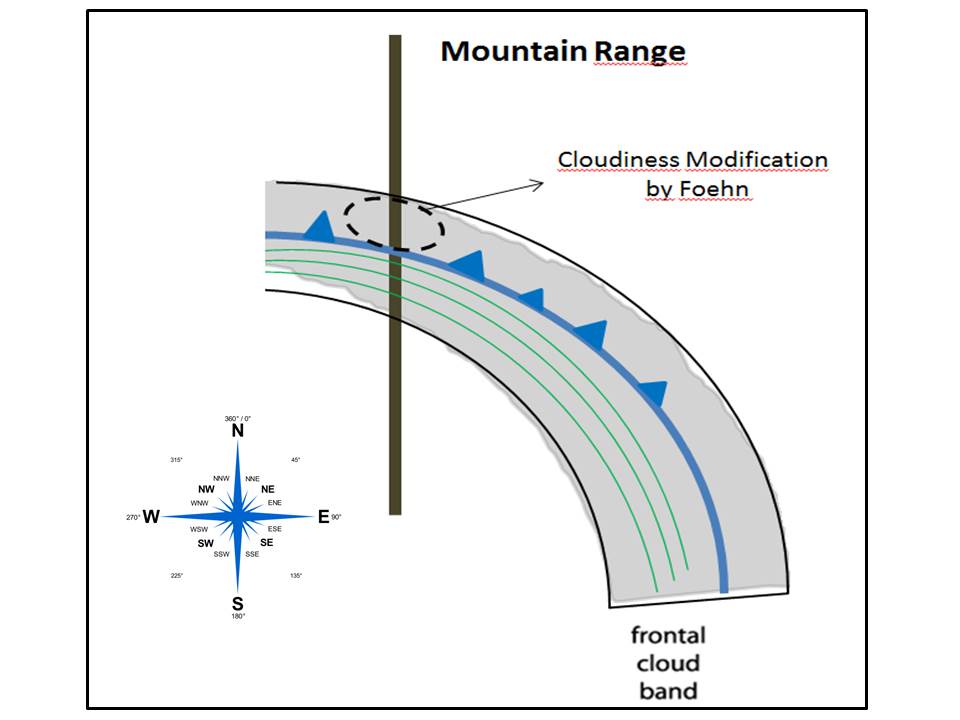
Schematic of the visible or true color satellite imagery during a Zonda event.
|
24 December 2012/18:45 UTC - AQUA/MODIS RGB 143 (true color) image.
|
|
|
GOES Imagery Examples
The following GOES 13 images show a Zonda event on 19-20 October 2013. This event was accompanied by wind gusts above 70 km/h, which resulted in fires and fallen trees in Mendoza and San Juan provinces.
|
19 October 2013/20.00 UTC - GOES 13 WV 6.5 image
|
19 October 2013/20.00 UTC - GOES 13 IR 10.7 image
|
|
|
|
19 October 2013/20.00 UTC - GOES 13 VIS 0.65 image
|
|
|

Press "Play Button" for 19 October 06 UTC to 20 October 23:30 UTC loop - GOES 13 WV 6.5 image |
Meteorological Physical Background
Zonda events are the result of mountain-induced waves which produce downslope windstorms and turbulence. They have been widely studied with numerical models in the past, and several theories have been produced to explain them. Certain environmental conditions are favorable for the development of these waves, although it is important to note that given the complexity of the interactions among them, different combinations of parameters may lead to different results. However, the principal environmental features common to mountain wave formation are the following:
- A flow near-perpendicular to the mountain range at its top, with velocities above 15m/s.
- A stable layer near the top of the mountain range on the windward side.
- A "critical layer", that is, an upper layer where the flow is inverted.
- A low level pressure gradient that favours cross-mountain flow.
This mesoscale phenomenon is related to the proximity of a cold front accompanied by an upper-level trough, a strong cross-barrier mid-level flow, and depressions that cross the Andes further south.
| Spatial extent: | generally confined to the proximity of the mountains. |
| Duration: | sudden development, short duration (a few hours). |
| Intensity: | max winds = 50 km/h, gusts = 100 km/h in severe cases. |
Broad Overview
The three main physical mechanisms which generate high amplitude waves are:
- Hydraulic jump mechanism.
- High-amplitude vertically propagating mountain waves.
- High-amplitude breaking waves and self-induce critical-layers.
1. Hydraulic jump
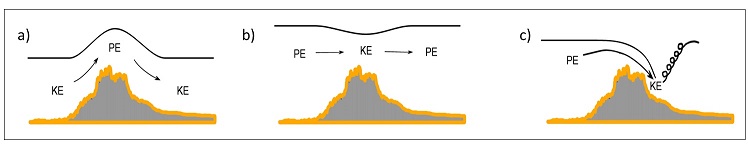
This theory assumes the hydrostatic flow of a homogeneous fluid bounded by a free surface that passes over a barrier. This approximation leads to a balance between nonlinear advection, the pressure gradient forces caused by changes in the thickness of the fluid, and the gravitational force. It can be shown that the relative contribution of the first two terms can be quantified by using the Froude number (Fr2=U2/gD, where U is the fluid's velocity and D its thickness), and that advection always opposes the pressure gradient force.
If Fr>1 (supercritical flow), nonlinear advection is stronger than the pressure gradient force, and the balance is satisfied when the flow accelerates in the same direction as the gravitational force. This causes the fluid parcels to decelerate as they ascend, converting kinetic energy (KE) into potential energy (PE), and to accelerate as they descend, reconverting PE into KE.
If Fr<1 (subcritical flow), the pressure gradient term dominates, and the balance is satisfied when the fluid parcels accelerate in the direction opposite the gravitational force. That is, acceleration in the ascent - PE to KE as a result of the free surface drop - and deceleration in the descent - KE to PE.
If there is acceleration along the entire path overpassing the mountain,the air flow undergoes a transition from subcritical to supercritical, and very high downslope velocities are produced.This is achieved when there is enough acceleration during ascent; therefore the air flow eventually recovers the ambient downstream conditions.This turbulent process is called hydraulic jump. The high velocity is the result of a continuing conversion of potential energy into kinetic energy.
|
Schematic of: a) supercritical flow, b) subcritical flow and c) hydraulic jump. Adapted from Durran (1986).
|
|
2. Vertically propagating mountain waves
When the troposphere is divided into several layers with constant stability and wind shear within each layer, the small-amplitude hydrostatic waves may be partially reflected at the interfaces of the layers, resulting in the waves being amplified and when resonance is achieved windstorms down the slope occur. This energy reflection depends on the characteristics of each layer, although one of the most important features needed for generating high-amplitude waves and strong downslope winds is the presence of a stable layer near the top of the mountain range.
This method reproduces a more realistic environment than the hydraulic jump theory, and the observed data from radiosondes show directly when the conditions are favorable for the development of mountain waves.
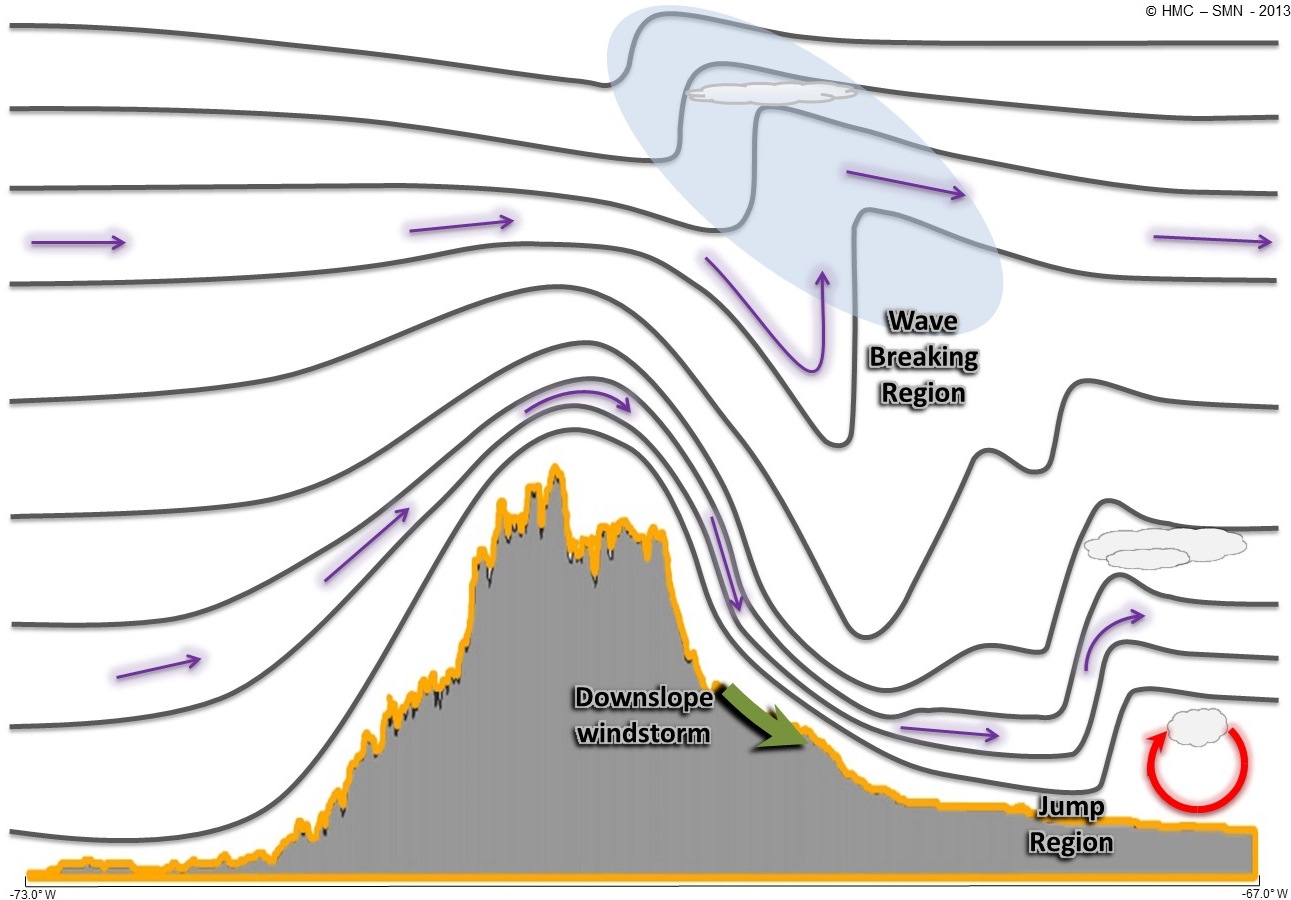
3. High-amplitude breaking waves and self-induced critical layers
Another mechanism that can explain downslope windstorms is related to wave breaking and downward energy propagation.
The waves increase in amplitude considerably when there is an overturning in the streamlines (or isentropes). These statically unstable regions (in which potential temperature decreases as height increases) are characterized by strong turbulent mixing and a reversal of the wind's direction. The layer where this takes place is known as a "self-induced critical layer", and the energy of the wave remains trapped below it, creating a favorable environment for high-amplitude waves.
The existence of an environmental critical layer may also contribute to wave amplification, and it is a feature that can be diagnosed using radiosonde data.
This mechanism explains the clear air turbulence (CAT) above the mountains. It can also be applied in the case of high mountains, unlike the previous hydrostatic case, which is valid only for lower mountains.
|
Schematic of a mountain wave in the Andes showing the wave-breaking region and the similarity with a hydraulic jump.
|
|
Geographical Location
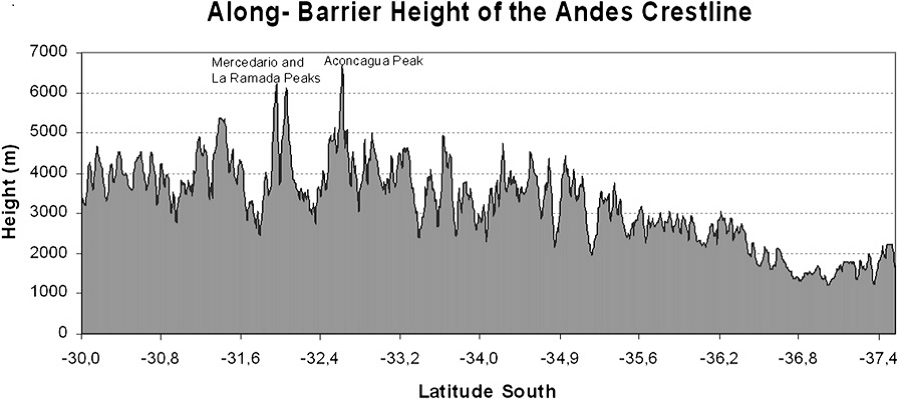
The extratropical Cordillera de los Andes runs meridionally from about 25°S to 37°S, with a variable width of 200-300 km and steep slopes on both sides. The height varies latitudinally, and the highest elevations are found around 32.5°S - 33.5°S, where the mean altitude is 4500 m; further south they get lower until the tops do not exceed 2500 m.
Zonda events are more intense where the mountains are higher and steeper. They occur more frequently between 35°S and 30°S, but the phenomena may extend further north up to 23°S. Further south, where the mountain range is considerably lower, zonda winds are rare events.
|
Latitudinal profile of the Andes between 30°S and 37.5°S. From Viale (2011).
|
|
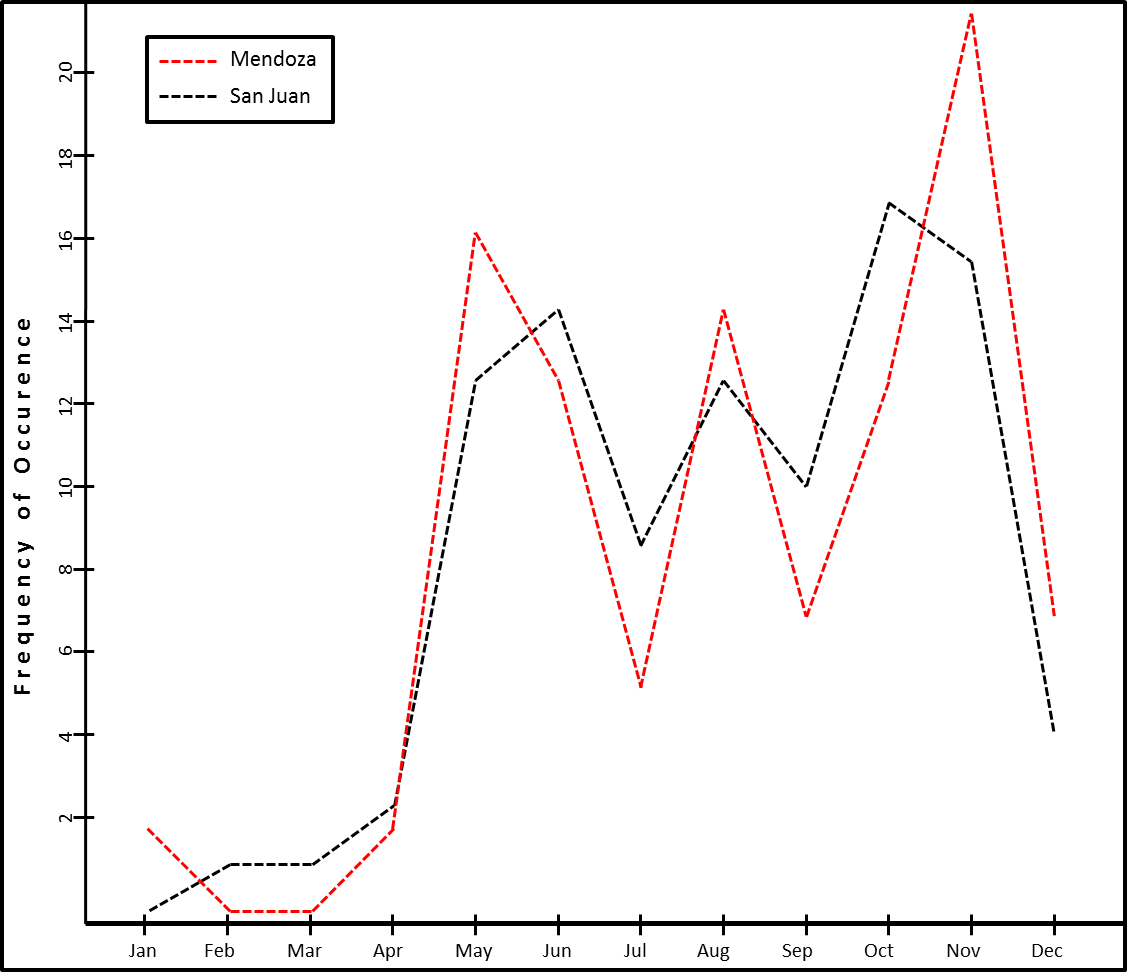
Seasonal variety
Zonda events are more frequent from May to November, when the conditions are more favorable for trough propagation towards lower latitudes, where the highest mountains are.
|
Monthly Zonda occurence frequency for San Juan (black) and Mendoza (red) stations. Adapted from G. Rolón (1977).
|
|
Key Parameters
The following NWP variables are the most used in practice for the identification of Zonda wind events. However, it's important to keep in mind that a better spatial resolution could represent the small scale features of the phenomena in a much more accurate way. An accurate representation of smaller-scale features requires a model resolution of 4 km or less.
-
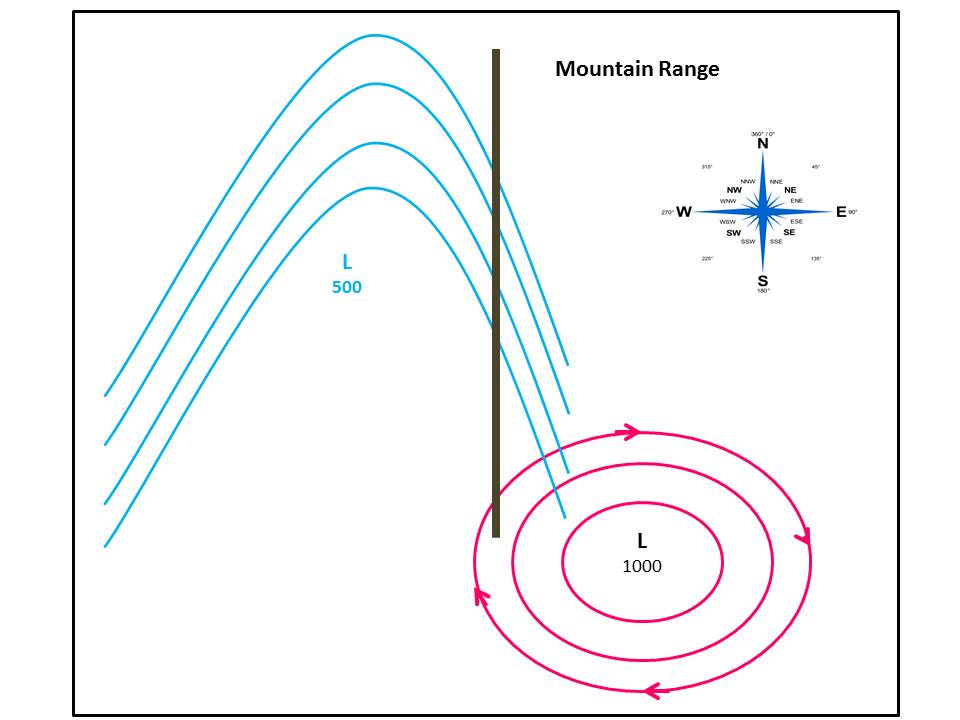
Height contours at 1000 and 500 hPa:
Zonda events: well-developed mid-level trough west of the mountain range. Surface low southeast of the barrier, near the extreme south of the continent. -
Height contours and wind velocity at 500 hPa:
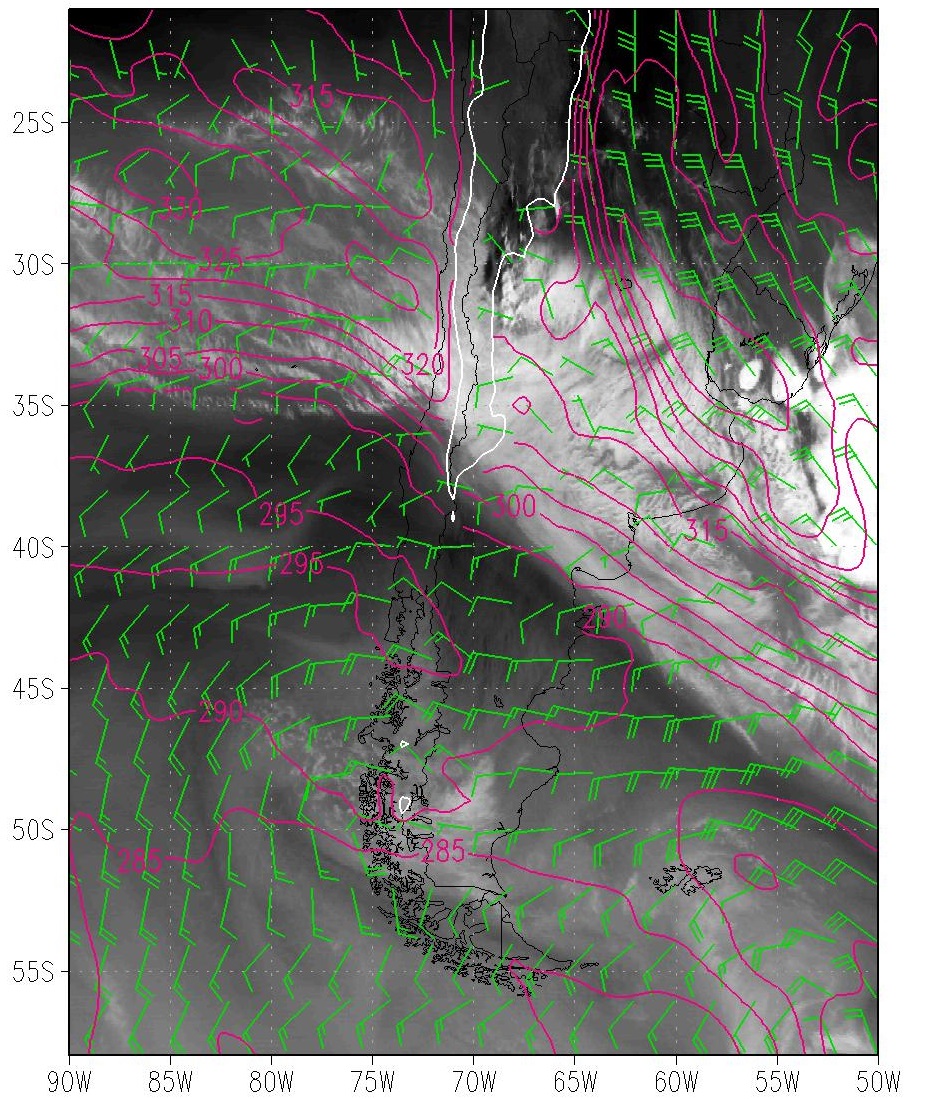
A well-developed mid-level trough and a strong upper-level jet west of the mountain range. Zonal wind velocity at 500 hPa (near the mountaintops of the Andes) generally greater than 15 m/s. -
Equivalent potential temperature at 850 hPa:
Frontal cloud band related to a strong gradient of equivalent potential temperature south of the Zonda occurrence region. The warm edge of the gradient is near the barrier in the area affected by Zonda wind. -
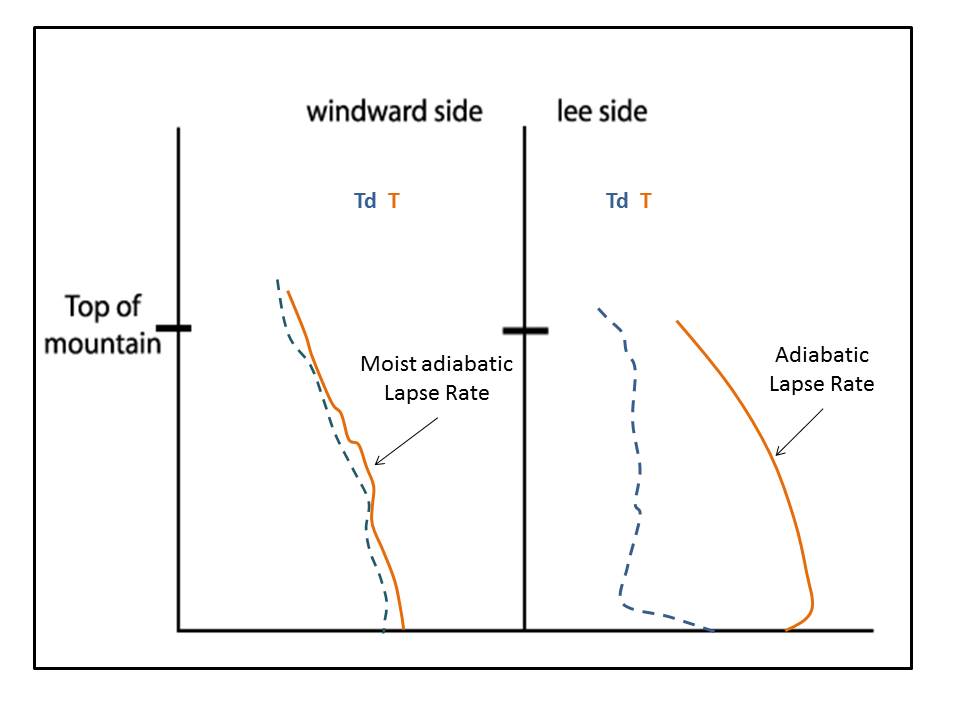
Stability:
Vertical stability, and particularly the presence of stable layers upstream near the top of the mountain barrier, favors Zonda events. An unstable low-level layer downstream brings the Zonda closer to the surface. Once the Zonda has developed, a nearly dry adiabatic lapse rate is established and the troposphere becomes unstable.
|
Height contours at 1000 and 500 hPa.
|
28 August 2010/18 UTC - Goes WV image; Magenta: Geopotential Height at 1000hPa (mgp), cyan: Geopotential Height at 500hPa (mgp).
|
|
|
|
Height contours and wind jet streak at 500 hPa
|
28 August 2010/18 UTC - Goes WV image; cyan: Geopotential Height at 500hPa (mgp), blue: wind magnitude > 35 m/s.
|
|
|
|
Equivalent Potential Temperature at 850hPa
|
28 August 2010/18 UTC - Goes WV image; Magenta: Equivalent Potential Temperature at 850 hPa (K) and wind barbs.
|
|
|
|
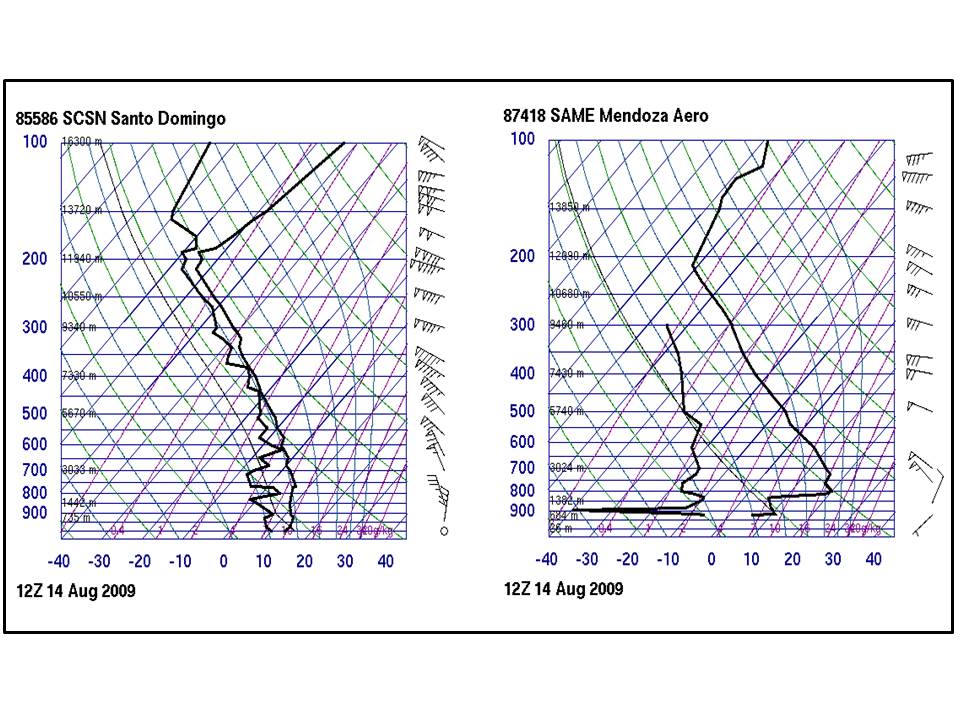
Stability: Typical vertical profiles of Temperature and Humidity during a Zonda event
|
14 August 2009/12 UTC - Radio soundings at Santo Domingo (west side of Andes) and Mendoza (East side).
|
|
|
Typical Appearance In Vertical Cross Sections
Regarding the following NWP vertical cross sections, it should be noted that the low resolution of NWP models simplifies topographical shapes and how they influence the tropospheric flow.
-
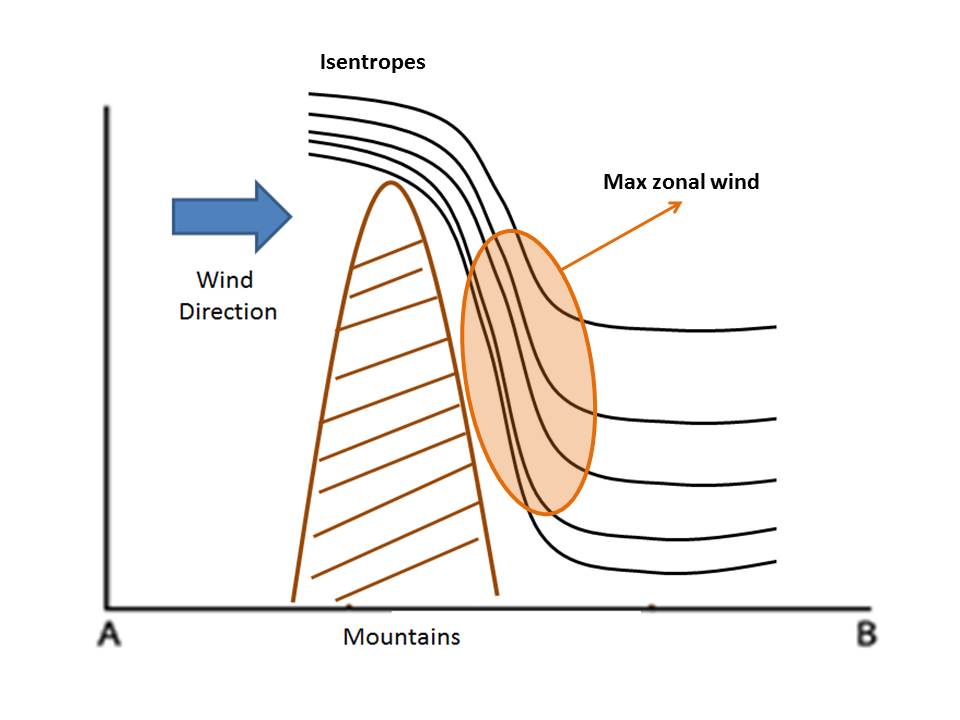
Potential Temperature:
The potential temperature field shows a stable layer on the windward side, near the mountain top. On the lee side the troposphere is less stable, with strongly tilting isentropes. -
Zonal Wind:
Areas of maximum velocity of winds at high levels descend on the lee side. -
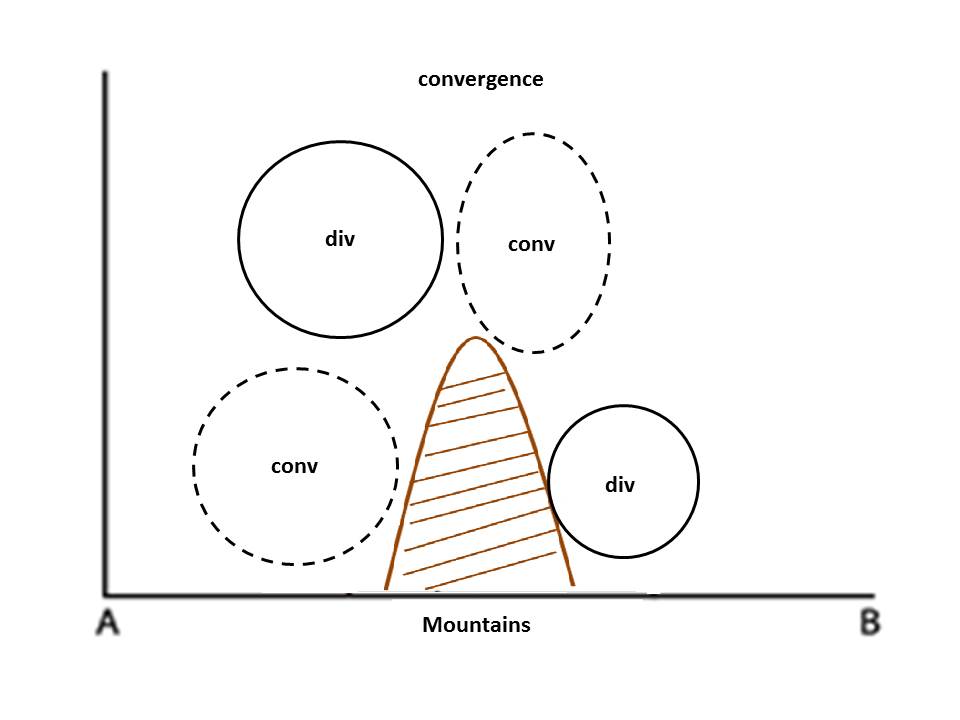
Divergence:
On the windward side, strong convergence from the ground to the mountain top level and divergence above it. On the lee side, convergence at high levels and divergence below it (not quite reaching the ground level). -
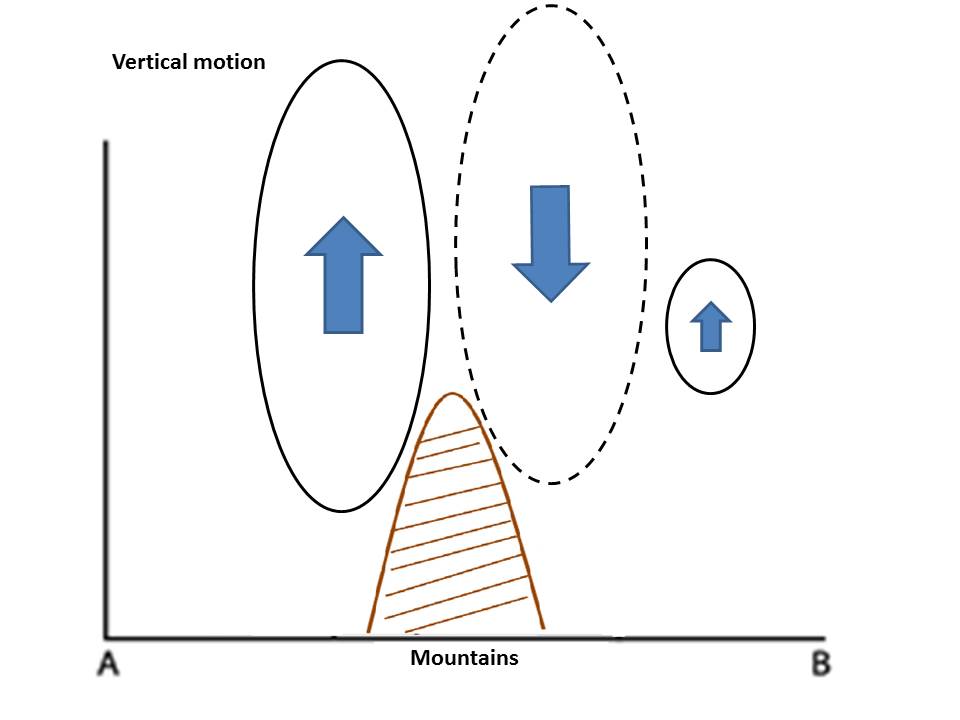
Vertical Velocity:
Maximum upward motion on the windward side and maximum downward motion on the lee side. -
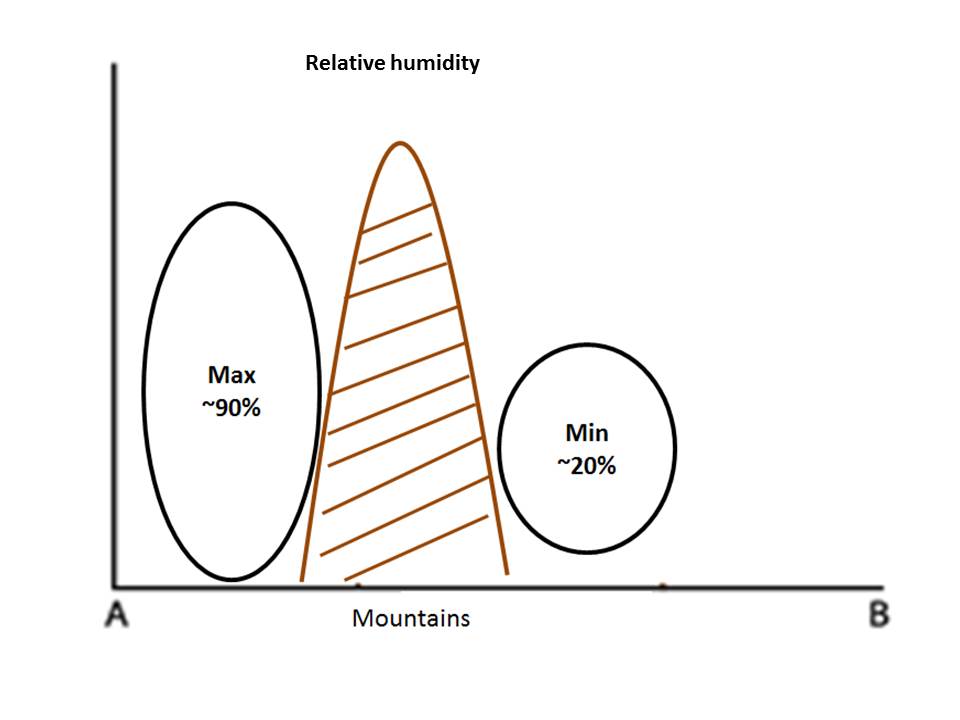
Relative Humidity:
This field resembles the differential vertical motions and the different cloud structures at both sides of the mountains. Thick humid layer on the windward side, dry layer on the lee side.
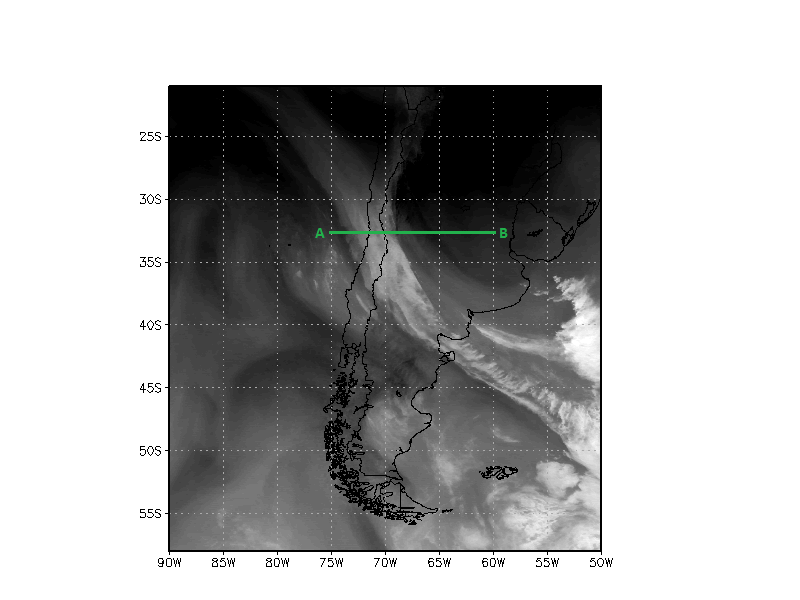
Cross sections are taken along 32.5°S (green line) on 12. July 2006 at 06 UTC:
|
Potential Temperature and Zonal Wind
|
Vertical cross section along 32.5°S. Zonal wind velocity (shaded); black: isentropes (theta-e) on 12 Jul 2006 at 06 UTC.
|
|
.gif)
|
|
Divergence
|
Vertical cross section along 32.5°S. Divergence (shaded); black: isentropes (theta-e) on 12 Jul 2006 at 06 UTC.
|
|
|
|
Vertical Velocity
|
Vertical cross section at 32.5°S. Vertical velocity (omega, shaded); black: isentropes (theta-e) on 12 Jul 2006 at 06 UTC.
|
|
|
|
Relative Humidity
|
Vertical cross section along 32.5 °S. Relative humidity (shaded), black: isentropes (theta-e) on 12 Jul 2006 at 06 UTC.
|
|
|
Weather Events
The table below shows the main features of Zonda wind events. The differences in observed weather on the windward and lee sides of the Andes are emphasized.
| Parameter | Description |
|---|---|
| Precipitation |
|
| Humidity |
|
| Temperature |
|
| Wind (incl. gusts) |
|
| Cloud |
|
| Other relevant information |
|
|
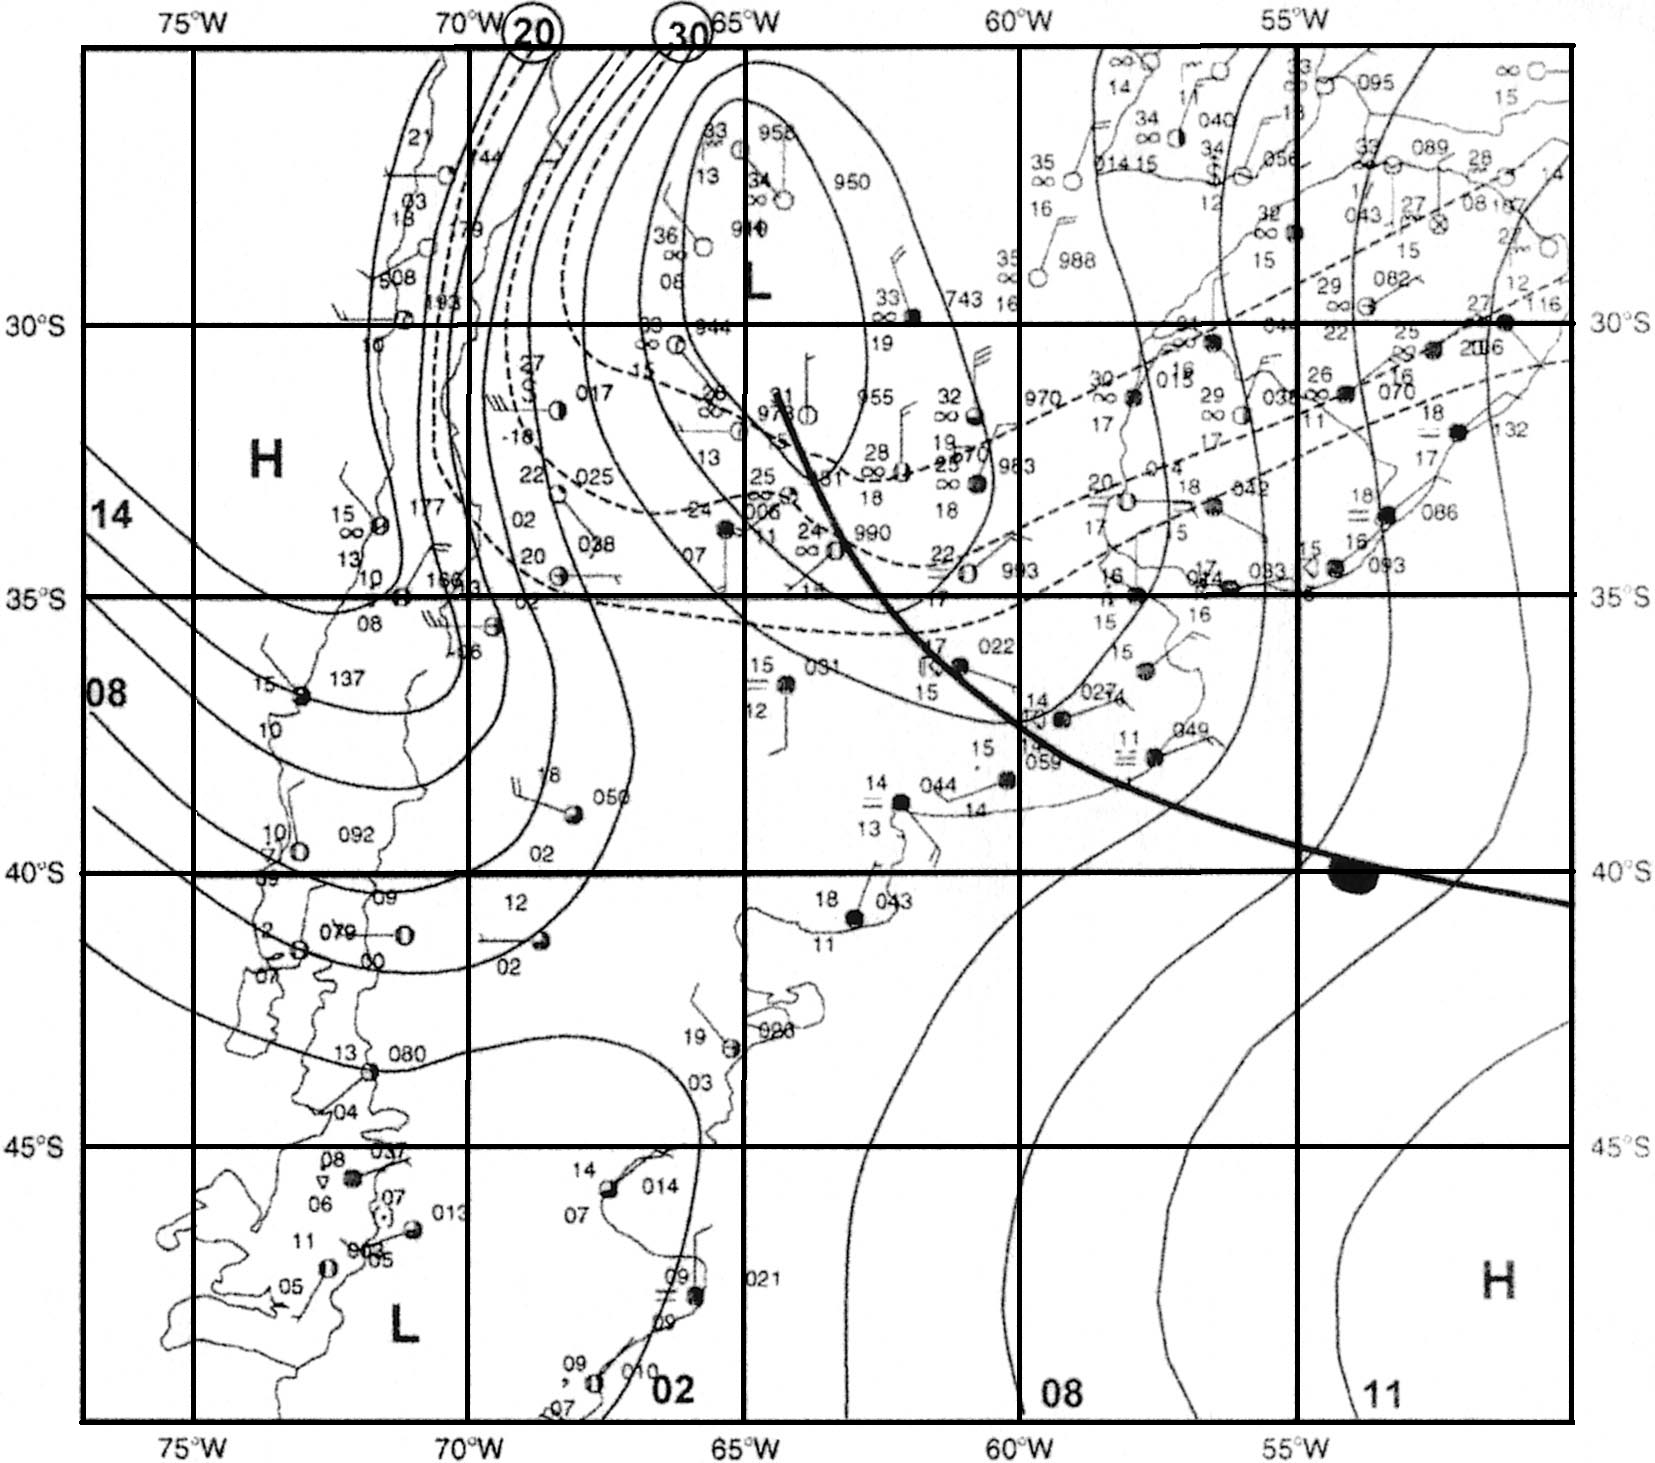
Schematic of synop observations and turbulence reports during Zonda events.
|
Surface analysis of 18 UTC 30 Aug 1999. Isobars (solid, hPa), isoterms (dashed, °C) and synop observations. From Seluchi (2003).
|
|
|
|
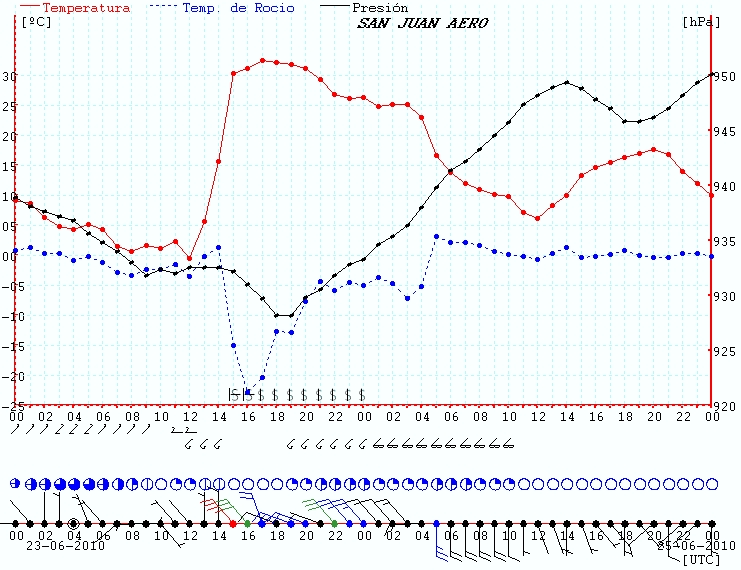
Time series of surface observations at San Juan airport during the 23-24 June 2010 Zonda event. Temperature (red), dewpoint (blue) and surface pressure (black). Temperature increase over 30°C and dewpoint decrease about 25°C in 3 hrs period. 35 kt winds and 53 kt gusts caused severe damage to buildings, widespread power outages and wildfires in the region.
|
|
References
- Rolón, G., & Afonso, J. (1977). Aspectos estadísticos y sinópticos del viento zonda. Meteorológica.
- Durran, D., 1986: Another look at downslope windstorms. Part I: The development of analogs to supercritical flow in an infinitely deep, continuously stratified flow. J. Atmos. Phys., 43, 2527-2543.
- Feltz, W. F., Bedka, K. M., Otkin, J. A., Greenwald, T., & Ackerman, S. A. (2009). Understanding Satellite-Observed Mountain-Wave Signatures Using High-Resolution Numerical Model Data. Weather & Forecasting, 24(1).
- Klemp, J. B., & Lilly, D. R. (1975). The dynamics of wave-induced downslope winds. Journal of the Atmospheric Sciences, 32(2), 320-339.
- Lilly, D. K., & Zipser, E. J. (1972). The Front Range Windstorm of 11 January 1972 a Meteorological Narrative. Weatherwise, 25(2), 56-63.
- Norte, F. A. (1988). Características del viento zonda en la región de Cuyo. PhD Thesis, University of Buenos Aires (UBA).
- Norte, F. A., Ulke, A. G., Simonelli, S. C., & Viale, M. (2008). The severe zonda wind event of 11 July 2006 east of the Andes Cordillera (Argentine): a case study using the BRAMS model. Meteorology and Atmospheric Physics,102(1-2), 1-14.
- Seluchi, M. E., Norte, F. A., Satyamurty, P., & Chou, S. C. (2003). Analysis of three situations of the foehn effect over the Andes (zonda wind) using the Eta-CPTEC regional model. Weather and forecasting, 18(3), 481-501.