Resolution
A GEO satellite orbits at an altitude of approximately 36,000 km, allowing it to remain stationary over a specific longitude along the equator6. To ground observers, the satellite appears to be fixed in one position in the sky. The larger distance from the Earth's surface means that its sensors capture images with less detail. In addition to the increased distance, GEO satellites often observe objects on Earth at a slanted angle, resulting in further degradation of the resolution (Figure 3). Reduced resolution at high latitudes has many disadvantages: convection monitoring becomes more difficult, broken cloudiness is harder to observe during both daytime and nighttime and it can become impossible to discern some smaller scale features such as valley fog using, e.g., only geostationary data from the SEVIRI instrument. The newer FCI instrument on MTG (Meteosat Third Generation) has a higher resolution than that of SEVIRI and the difference between the old and new imagery is especially noticeable at high latitudes. The nominal spatial resolution of SEVIRI channels used in the Day Microphysics RGB is 3 km whereas with FCI it is 1 km.8 An example of this is presented in Figure 26, which depicts low-level clouds and fog over central Finland during the morning hours. The extent of the fog is more distinctly discernible in the FCI imagery. Furthermore, the movement of advection fog beneath overlying partial cloud layers may be traceable, providing potentially critical information for airport operations.
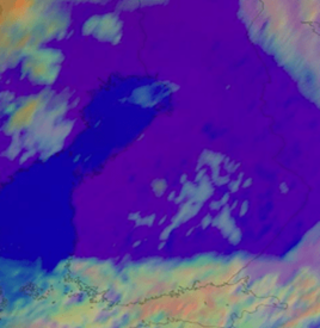
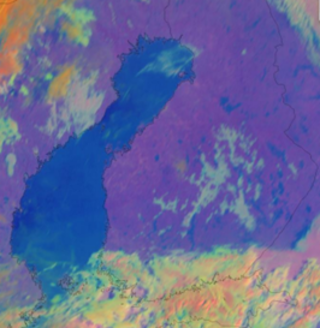
Figure 26: SEVIRI and FCI Day Microphysics RGB - 16 September 2024, 07:00 UTC
Polar satellites orbit at an altitude of approximately 800 km and are in constant motion relative to ground observers7. In polar satellite images, objects are closer to nadir than for GEO satellites, but the closer the objects are to the edge of an image swath, the poorer the resolution becomes. Polar satellites have higher spatial resolution, which is crucial for applications such as detailed environmental monitoring, land use mapping, and disaster management. In general, the choice between geostationary and polar satellites depends on the specific needs of the forecaster. GEO satellites are ideal for continuous, real-time monitoring of developing weather situations, despite their lower resolution.
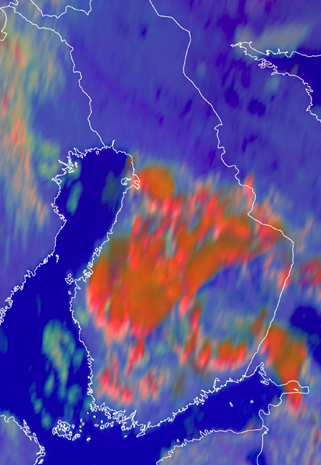
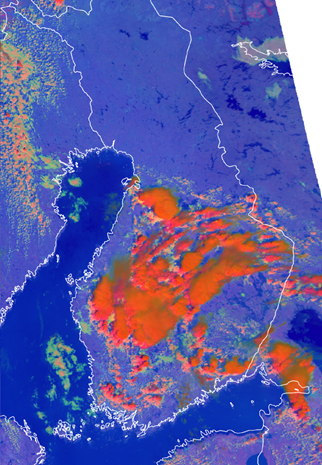
An illustrative example of resolution differences due to latitude can be seen below in Figures 27 and 28. In both cases convection is taking place, but only at lower latitudes it is possible to discern cloud top features using geostationary data from the SEVIRI instrument, which makes it harder for a forecaster to assess the severity of the developing weather situation. The approximate pixel sizes for the locations in this example are shown below in Figure 29.
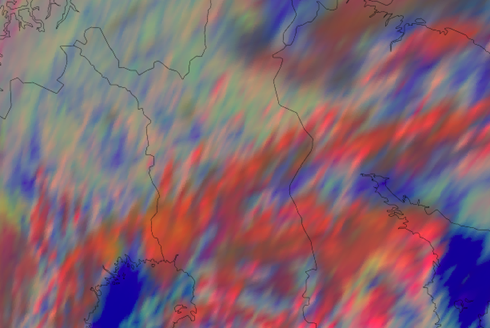
Figure 27: SEVIRI Day Microphysics RGB: 11 June 2024, (Northern Fennoscandia)
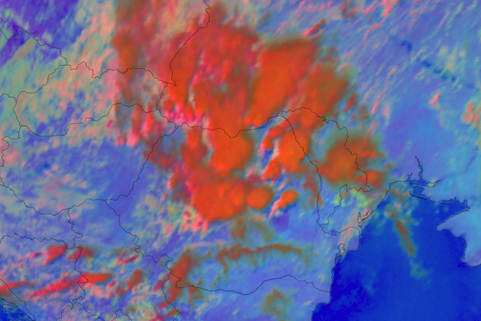
Figure 28: SEVIRI Day Microphysics RGB: 11 June 2024, 13:45 UTC (activity mainly over Romania and Ukraine)
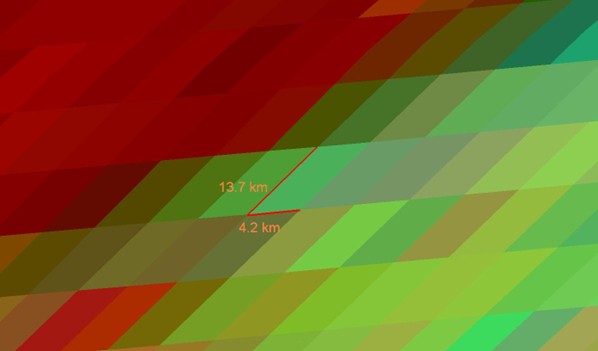
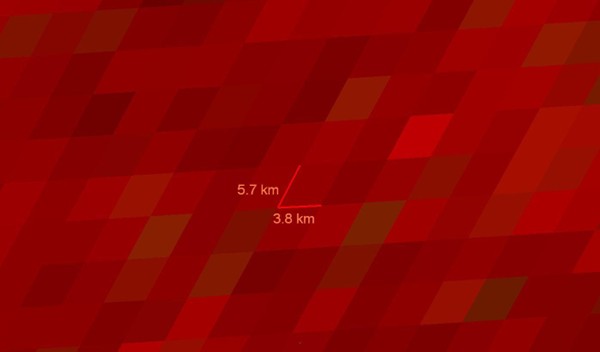
Figure 29: Comparison of SEVIRI pixel sizes (nominally 3x3km) in approximate locations of the convection in Figures 27 (Finland: 65.84N 24.13E) and 28 (Romania 46.10N 24.90E)
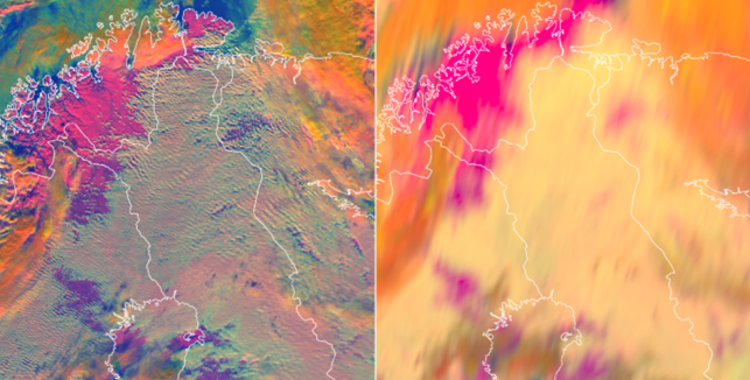
Figure 30: Day Microphysics RGB: 25 February 2024, VIIRS 11:38 UTC, SEVIRI 11:45 UTC (Northern Finland)
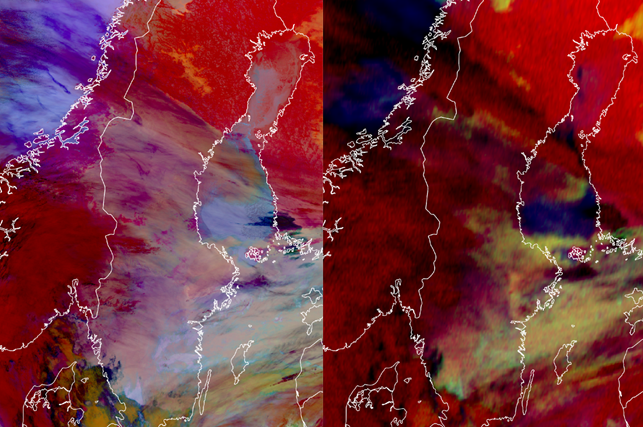
Figure 31: Night Microphysics RGB- 12, February 2024, VIIRS 01:42 UTC, SEVIRI 01:45 UTC (Central Sweden)
Another example illustrating resolution differences can be seen in Figure 30: looking at the clouds in the northeastern parts of Sweden, it is obvious that in this case it is difficult to tell where broken cloudiness is situated using only SEVIRI data, whereas in VIIRS data more exact locations can be observed. Observing broken cloudiness is especially important in winter when the road surface is at risk of freezing, because broken clouds lead to faster radiative cooling of a surface compared to overcast conditions. An example of this can be seen in Figure 31, where the lower cloud cover breaks in central parts of Sweden, but it is quite difficult to observe from SEVIRI data because the clear areas are quite small and there is also some higher cloud over the lower cloudiness.
Exercise 5
VIIRS has better spatial resolution than SEVIRI. Which cloud top features can be more easily distinguished using VIIRS imagery?
Use the slider.
|
|
Exercise 6
Scenario:
Imagine you receive a phone call in mid-September from a customer asking whether it is safe to drive from Destination A to Destination B the following night using summer tires.
Background:
Yesterday evening, a precipitation area passed over northern Sweden, causing widespread wet road surfaces. The NWP models are predicting minimum temperatures down to +2 degrees Celsius over higher terrain, together with light winds from the north. Accurate forecasting of cloud cover is crucial in this situation.
Task:
Using only SEVIRI satellite imagery, how would you assess the likelihood of:
- Broken cloud cover and freezing road surfaces during the night within the marked area?
Please explain your reasoning based on the satellite data available.
SEVIRI Night Microphysics RGB - 11th September 2024
Your answer:
How about now?
FCI Night Microphysics RGB - 11th September 2024
Your answer: