2.1 The Role of Parallax Shift in Satellite Image Interpretation
Parallax is the visual phenomenon whereby the position of an object in relation to a background appears to change depending on the viewer's position. Parallax shift can be easily demonstrated with a simple everyday exercise using your thumb and your eyes (Figure 7):
- Hold up your thumb at arm's length in front of you.
- Close your left eye and observe your thumb with your right eye.
- Now, switch eyes - close your right eye and open your left eye.
- Do this a couple of times and note how your thumb seems to shift position against the background. Even though your thumb hasn't moved, it looks like it has jumped sideways.
This phenomenon occurs due to the eyes being in slightly different viewing locations, causing a nearby object, your thumb, to appear to shift relative to the background. As well as in your everyday life, parallax shift is relevant in various fields, including meteorology. This chapter discusses its importance in satellite meteorology and why every forecaster should be aware of it.
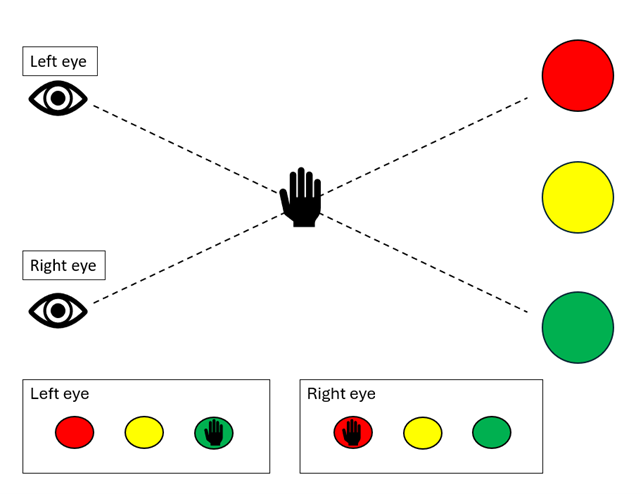
Figure 7: Simple example of parallax shift in everyday life.
In satellite meteorology, the parallax shift phenomenon occurs when the viewing angle of a satellite deviates from the sub-satellite point, also known as the nadir (Figure 8). This results in an object situated between the satellite and the Earth's surface appearing in an erroneous position in the satellite imagery, so that a meteorologist could produce an inaccurate analysis if relying solely on satellite images. It is therefore vital to understand and acknowledge parallax shift for accurate weather analysis and forecasting, and various parallax shift correction methods have been developed. It should be noted that this learning module will not present a detailed overview of these techniques, but further information can be found in the supplementary material provided at the end of the module.
Parallax shift increases with increasing distance from the satellite's nadir, both in south/north and east/west direction. Therefore, the effect is particularly pronounced in the Nordic countries but also near other edge areas of the satellite's full disk images. In addition, parallax shift is a function of the height of the feature, resulting in a greater shift for higher clouds. This is particularly important for meteorologists to consider during severe thunderstorms. The shift causes high-reaching clouds to appear further away from their actual position than low clouds. This feature can be demonstrated by a comparison of satellite and radar data (Figure 9), which illustrates cloud appearing shifted towards the north in comparison to the precipitation area.
Parallax shift has an impact on both GEO and LEO satellites. The orbit of polar satellites is considerably lower than that of geostationary satellites, which results in a notable enhancement of resolution at high latitudes. Moreover, cloud displacement is negligible near the nadir. It is, however, important to note that for lower orbits, the viewing angle and parallax displacement increases more rapidly with increasing distance from nadir (Figure 10).
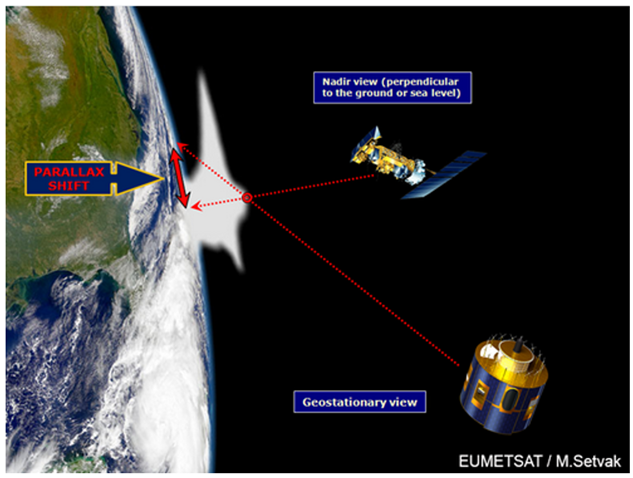
Figure 8: Illustration of parallax shift in satellite meteorology. 10
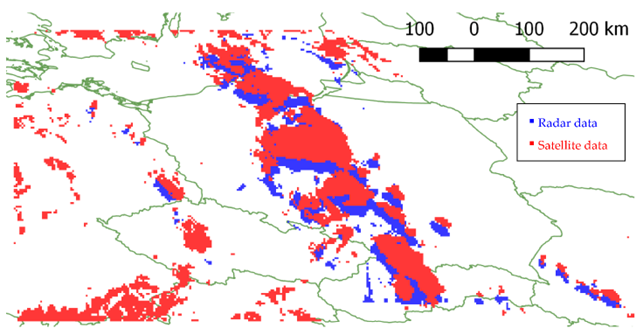
Figure 9: Illustration of parallax shift by comparing satellite and radar data. 3
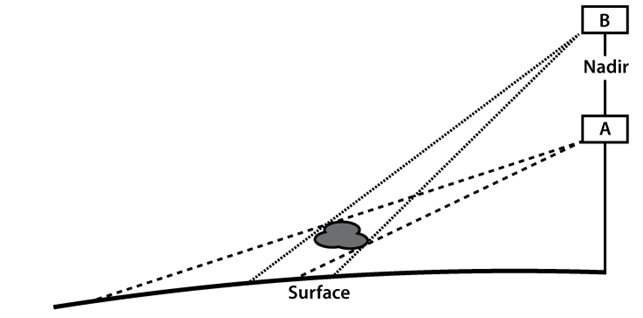
Figure 10: The viewing angle of the cloud from the LEO satellite (A) is greater than that of the GEO satellite (B). This leads to a larger displacement error for the cloud for the LEO satellite. 4
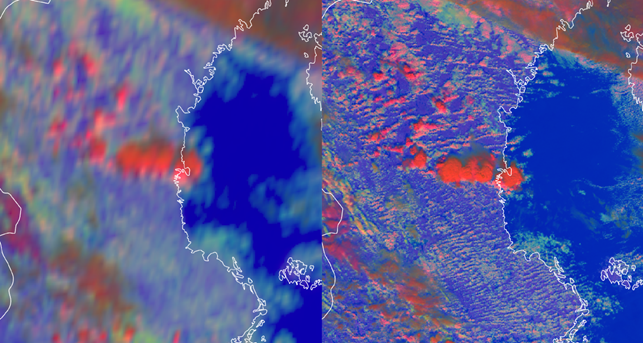
Figures 11, 12 and 13 illustrate the parallax shift phenomenon during the occurrence of a mesoscale convective system (MCS) in Finland in June 20215. Figures 11 and 12 compare the position of the cumulonimbus cloud as observed by a GEO satellite (SEVIRI, left image) and a LEO satellite (VIIRS, right image). The position of the cloud in the satellite images, taken approximately at the same time, varies due to its differing distance from the nadir. In the SEVIRI image, the position of the cumulonimbus cloud is shifted towards the northeast in comparison to the VIIRS image. Similarly, Figure 12 demonstrates a parallax shift of 45 km to the northeast.
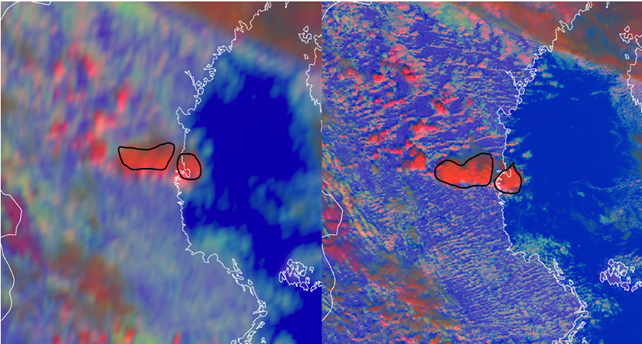
Figure 13 compares the position of the cumulonimbus cloud as observed by two different LEO satellites (VIIRS and MODIS). This figure provides a further comparison of the position of the cumulonimbus clouds near the middle (red) and towards the edge (blue) of a polar satellite swath. With polar satellite imagery, the parallax effect becomes more pronounced towards the edges of imaging swaths. In addition, VIIRS exhibits a significantly reduced pixel growth rate from nadir to the end of the scan in comparison with the MODIS instrument.
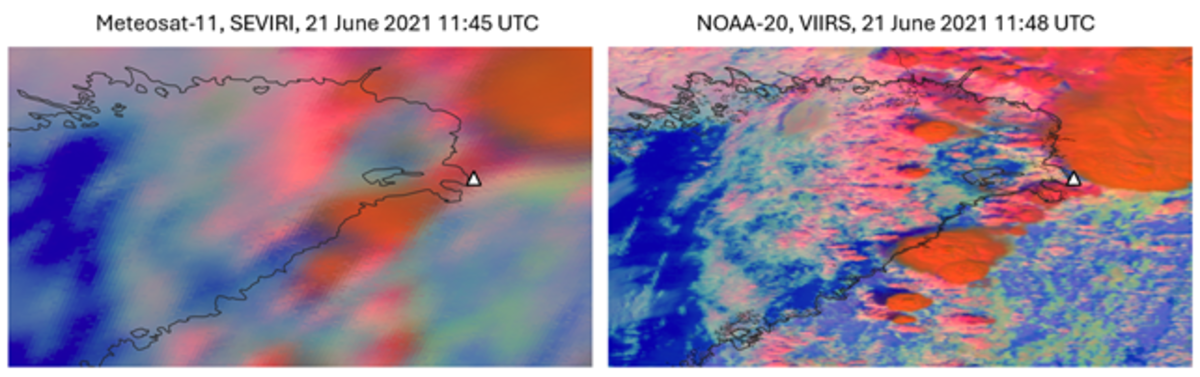
Figure 11: Day Microphysics RGB: 21 June 2021, around 11:45 UTC. Comparison between GEO (Meteosat-11, SEVIRI, left image) and LEO (NOAA-20, VIIRS, right image) satellite images. The city of Oulu is marked with a triangle.
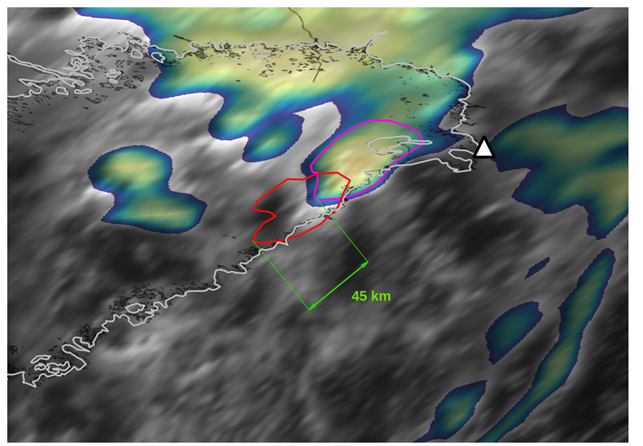
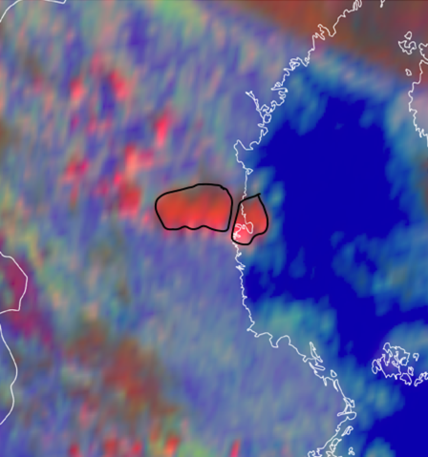
Figure 12: SEVIRI IR Sandwich product based on HRV channel: 21 June 2021, 10:00 UTC. The red contour shows the Cb cloud position in VIIRS (LEO satellite) and the magenta contour in SEVIRI (GEO satellite). The city of Oulu is marked with a triangle.
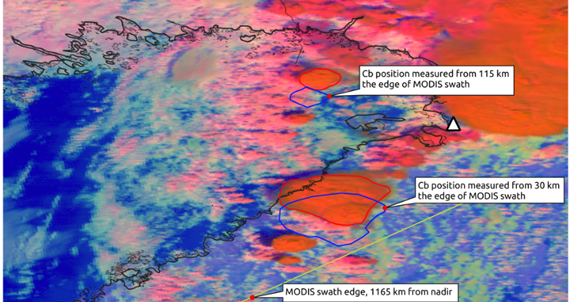
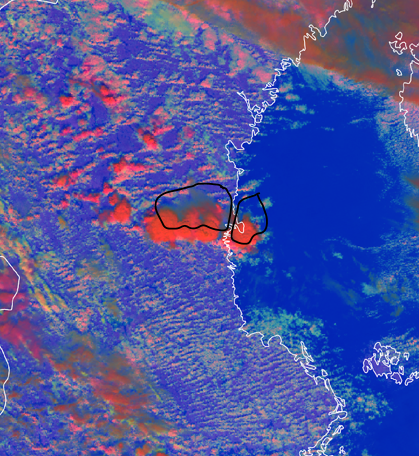
Figure 13: Day Microphysics RGB (NOAA-20, VIIRS): 21 June 2021, 11:48 UTC. Comparison of Cb clouds positions between the middle of a polar satellite swath (red lines) and the edge of a swath (blue lines). The city of Oulu is marked with a triangle.
The displacement due to parallax can also result in distortion of the shape of the original feature, whereby it is perceived to be larger or differently shaped than it actually is. Furthermore, the pixel size is relatively stretched in the scanning direction (Figure 14), which results in a feature appearing longer in the satellite image than it actually is in nature. As previously discussed, the satellite occasionally measures the sides of convective clouds rather than their tops at high latitudes, which can lead to inaccuracies in data interpretation. This is because the sides of clouds can present different characteristics from their tops, such as different temperatures.
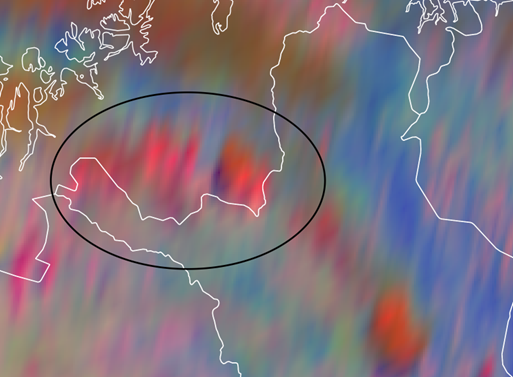
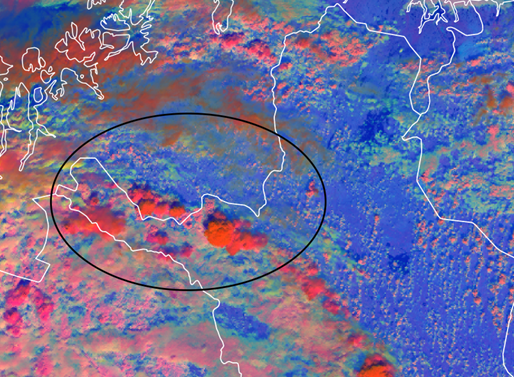
Figure 14: Day Microphysics RGB (SEVIRI and VIIRS): 29 June 2024, 09:45 UTC and 09:38 UTC
Exercise 2
Scenario
Consider a hypothetical work shift during the summer months, with the forecast indicating the possibility of convective showers in the central part of Sweden during the afternoon hours. Unfortunately, the radar is dysfunctional today, so for nowcasting the meteorologist has to rely on satellite imagery, SYNOP observations and NWP model data. The image below is a SEVIRI satellite image of a small convective cell.
Task:
1) Draw the border of the convective cell.
2) Do you recall the direction of the parallax, is it towards the south or towards the north?
Exercise 3
As we have discussed in this learning module, parallax shift is a problem in high-latitude regions. How can you explain the result shown in the figure below? Why is parallax shift larger in Brasília than in Cape Town, even though Brasília is closer to the equator?
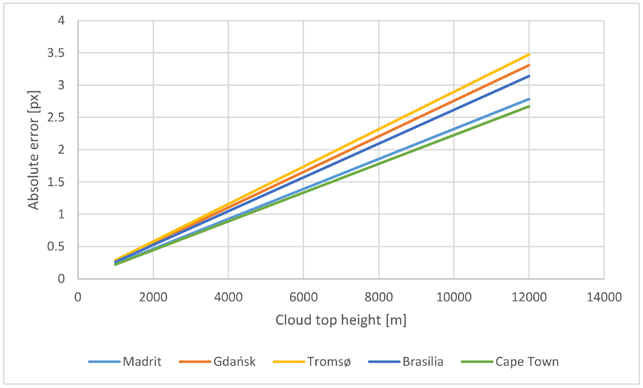
Your answer: