4. Issues related to using some RGB products at high latitudes
Some RGBs work better for monitoring a certain phenomenon at high latitudes than those that are usually used to monitor the same phenomenon at lower latitudes such as in the Mediterranean area. An example of this is monitoring volcanic ash. Usually, the Ash RGB is most appropriate for monitoring the movement of ash and SO2 plumes. However, it is advised that in high latitude regions the Dust RGB should be used for monitoring volcanic ash. For example, at high satellite viewing angles SO2 clouds are easier to distinguish in the Dust RGB. Recipes for the two RGBs are shown in Figure 21. In Figure 22 the Dust RGB provides better color contrast between an SO2 plume and the lower-level clouds. This is due to the different temperature ranges used for the green component in the two RGBs: the green component for both is IR10.8-IR8.7, and IR8.7 is more sensitive to the slanted angles than IR10.8 so that the difference between SO2 plume and low-clouds becomes clearer using the temperature range used in the Dust RGB. Looking again at Figure 22 it can be noted that the contrast between the SO2 plume and water clouds is small in the Ash RGB. In Figure 23 the green beam components for the two RGBs are shown and the larger contrast between the plume and lower clouds is evident in the green component of the Dust RGB.
On the far edges of MSG images, one should use the Dust RGB rather than the Ash RGB for ash and SO2 detection, while for all other areas the Ash RGB gives better contrast. An example from mid-latitudes is seen in Figure 24, where the color contrast between the SO2 plume and low clouds is good in the Ash RGB, and the signal from the plume itself is also stronger compared to that in the Dust RGB.
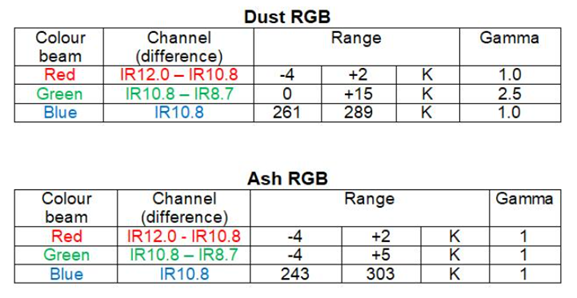
Figure 21: RGB recipes for Dust and Ash RGBs
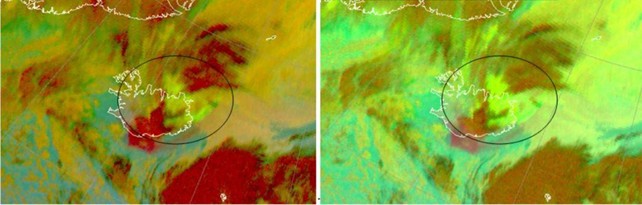
Figure 22: Volcanic eruption in Iceland, SO2 gas plume. Dust RGB (left), Ash RGB (right) for 22 May 2011, 06:55 UTC
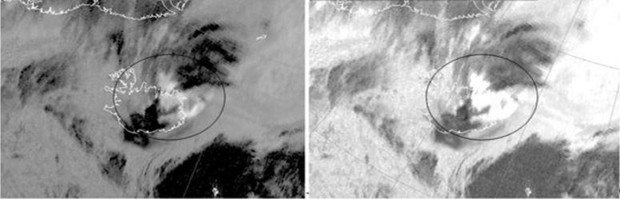
Figure 23: Green component of Dust RGB (left) and Ash RGB (right)
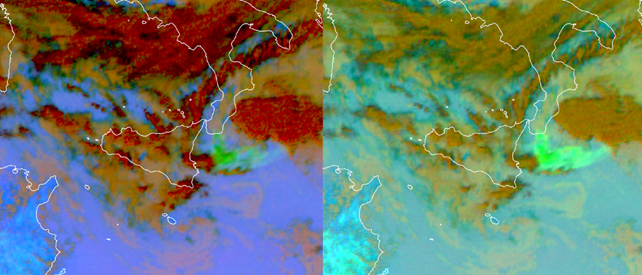
Figure 24: Volcanic eruption of Etna volcano in Sicily, SO2 gas plume. Dust RGB (left), Ash RGB (right) - 21 May 2023, 12:00 UTC
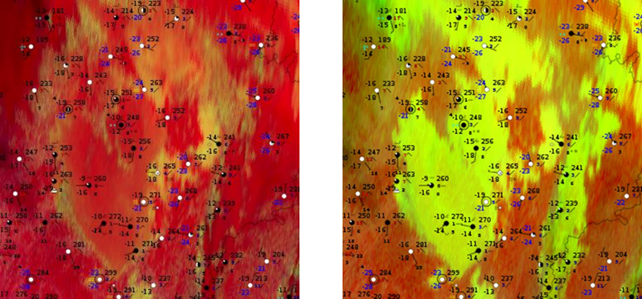
Figure 25: Night Microphysics RGB (left) and 24-hours Microphysics RGB (right) with SYNOPs, 17 February 2017, 00:00 UTC
Figure 25 shows an example of a very cold weather situation, which leads to an attenuated signal even from low level clouds when looking at the Night Microphysics RGB. This is because very small changes in detected radiance at cold temperatures cause very large changes in the 3.9 µm brightness temperature. The 3.9 µm band lacks precision compared to the other window channels, such as 10.8 or 8.7, for very cold temperatures. In the Night Microphysics RGB the green component is set to be IR10.8-IR3.9 whereas in the 24-hour Microphysics RGB it is IR10.8-IR8.7.
Exercise 7
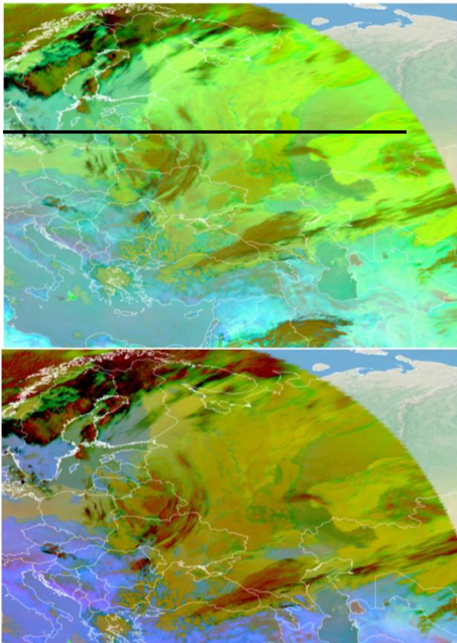
Slider: Scenario: Etna is erupting, and you are tasked to select the correct RGB image to monitor the situation. Draw a line above which latitude you would no longer use the Ash RGB for volcanic ash detection.
Hint: Where you would still expect to see a good enough contrast between the lower clouds and the volcanic ash plume. See the Quick guide for Ash RGB and Dust RGB.