Chapter I: Introduction
Table of Contents
- Chapter I: Introduction
- Introduction
Introduction
Cyclogenesis is a term used to describe the intensification or development of a cyclone, and is commonly used to describe the life cycle of a mid-latitude cyclone.
Extratropical cyclones are a very common feature in satellite images. We all intuitively analyze the boundaries of the different air masses around the center as cold and warm fronts or occlusions, from satellite images and model data.
Many National Weather Services issue synoptic charts several times per day, where surface fronts are plotted. Extratropical cyclones are routinely analyzed as Norwegian cyclones on weather charts by National Weather Services, not taking into account that some of the cyclones are of a different type with a different development.
|
|
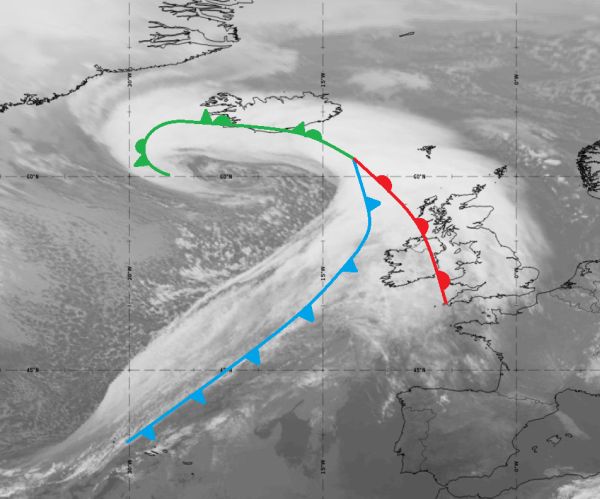
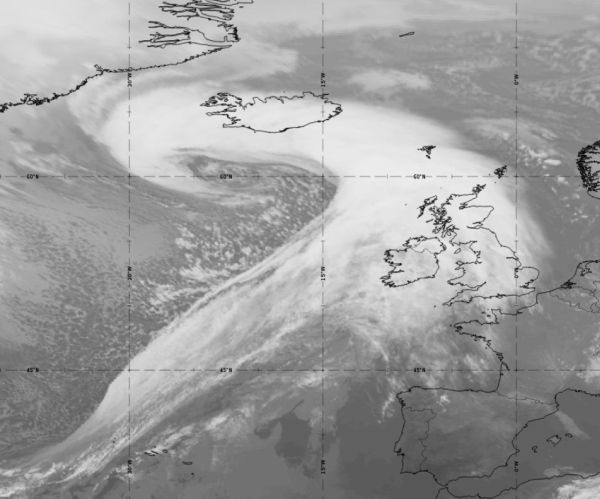
Figure 1: SEVIRI IR10.8 μm image from March 11, 2019 at 18:00 UTC. A mature extra-tropical cyclone formed by an Icelandic low and the corresponding frontal analysis (use the slider).
We will investigate in this module the main differences between the Norwegian and the Shapiro-Keyser cyclone types. They have many common features, but also reveal major differences over the course of their life cycle.
Quiz:
Let's start with a short quiz:
It is very difficult, if not impossible, to determine the cyclone type from satellite images alone. The next two examples are either a Norwegian cyclone or a Shapiro-Keyser cyclone. Just make a guess!
Example 1:
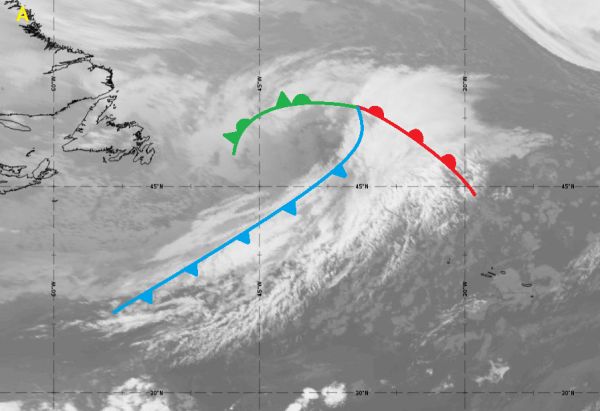
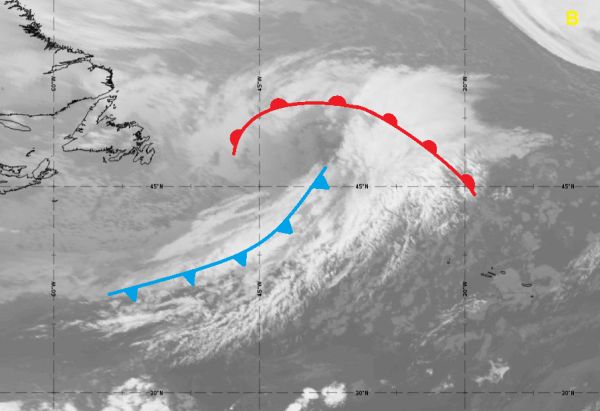
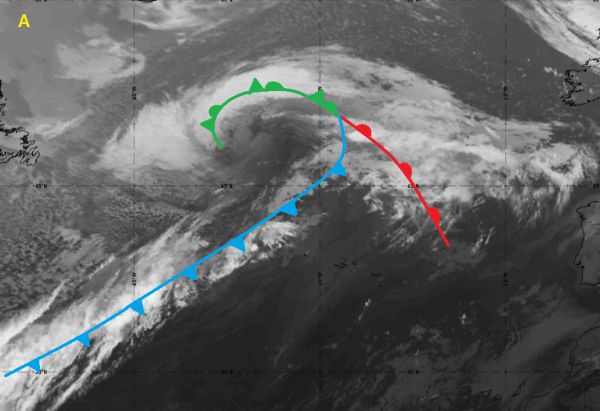
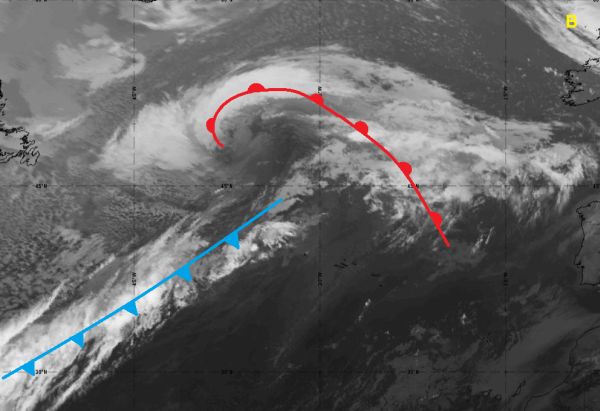
This cyclone was scanned over the Atlantic by the SEVIRI instrument on board Meteosat-11 on October 3, 2019 at 12:00 UTC. If you had to do a frontal analysis of this system, which of the two proposed surface analyses would you apply? It is of course only a first guess, as you have no numerical fields to confirm or reject the choice.
|
|
Identify the correct analysis (use the slider).
Example 2:
The next example is another cyclone over the Atlantic 3 days later (6 October 2019 at 00:00 UTC).
|
|
Identify the correct analysis (use the slider).
