The Sting Jet
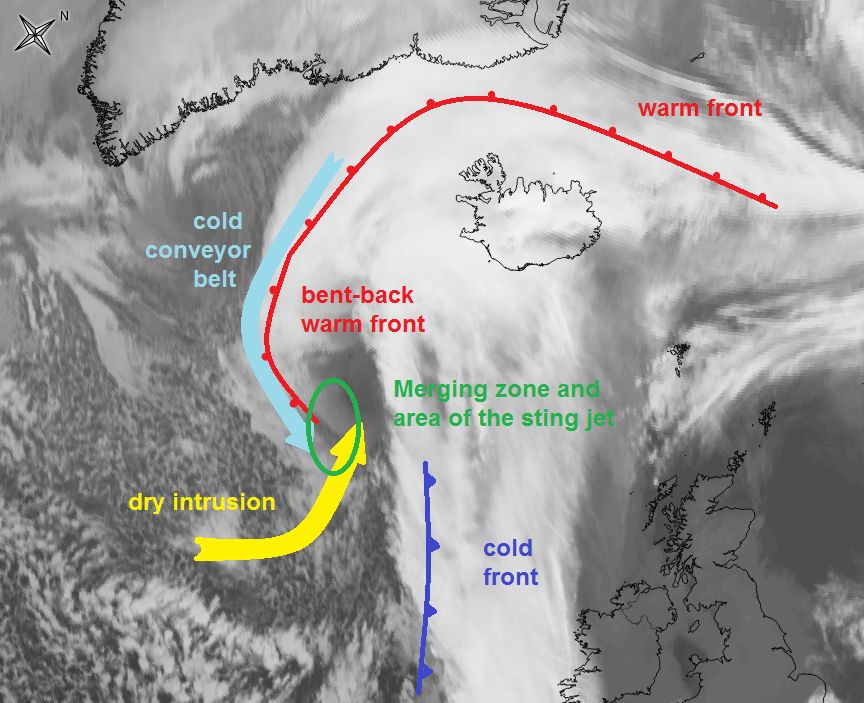
Sting jets are areas of high wind speed maxima descending from about 700 hPa to the surface level, located equatorward of the low center near the tip of the cloud head at the end of the bent-back warm front (see Figure 1). Sting jets are not observed exclusively with Shapiro-Keyser cyclones, but they are frequently linked to them. One hypothesis for the generation of sting jets is that when the cold conveyor belt, which wraps around the warm core of the cyclone, merges with the dry intrusion, cloud droplets from the southern tip of the bent-back warm front evaporate in the dry air and, by doing so, cool the ambient air. This cooling process leads to destabilization, which increases vertical momentum transport down to the surface (slantwise jet); this is the so-called sting jet.
Figure 1: Schematic showing the merging zone of the bent-back warm front with the dry intrusion. SEVIRI IR10.8 μm image from January 9, 2018, 00:00 UTC.
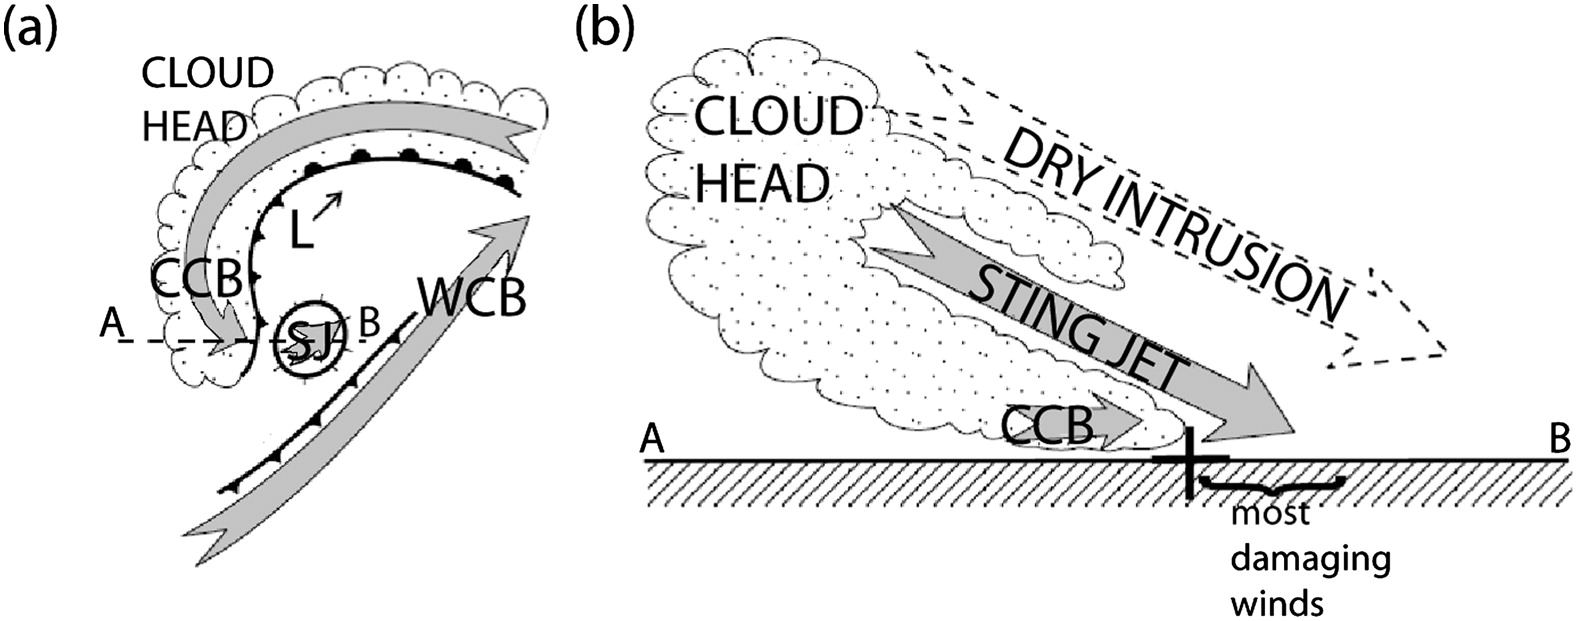
The acceleration of downdrafts associated with sting jets can be caused by the increase in horizontal pressure gradient when moving down to lower levels. The downdrafts can reach the ground with very high wind speeds that are among the strongest which occur in cyclonic systems.
Figure 2: Vertical cross section through the area of the sting jet. (CCB: Cold Conveyor Belt, WCB: Warm Conveyor Belt), © Schultz and Browning (2017).
Sting jets are difficult to predict using numerical models because of their limited temporal and spatial extent and the way each individual low-pressure system develops differently. A shift of 50 km in the forecast will impact a region that had previously been outside the danger zone. While conveyor belts have a lifetime comparable to the duration of the storm itself, sting jets are short-lived features subject to mesoscale processes with a duration on the order of hours.
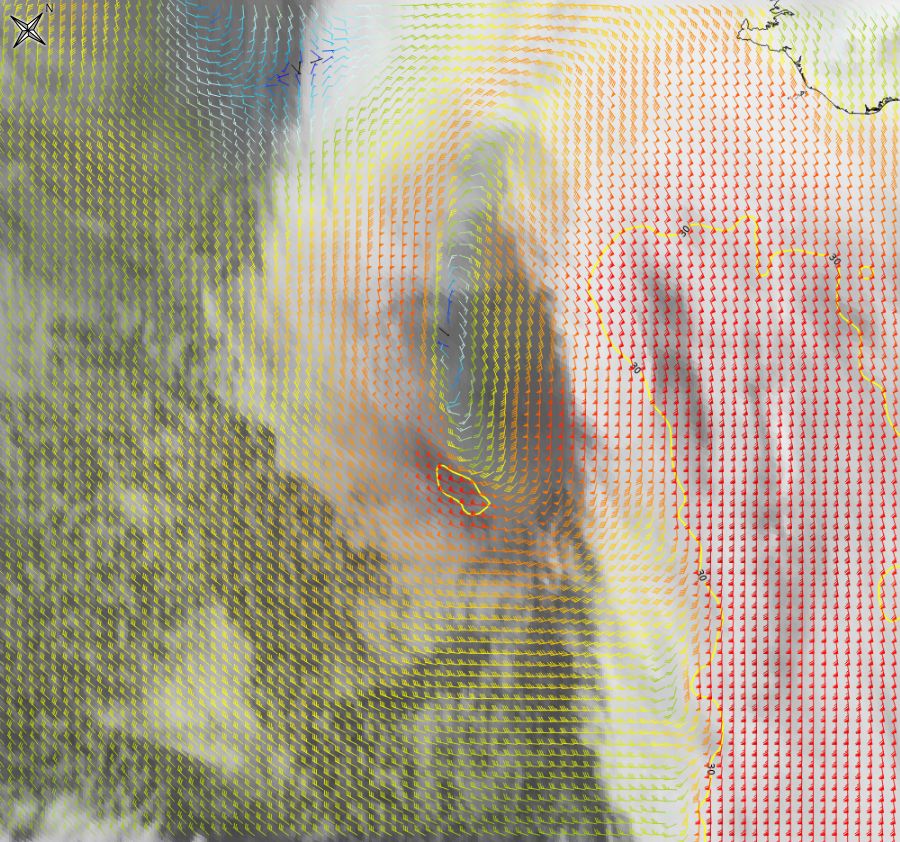
In the above example (9 January 2018, 00:00 UTC), ECMWF model parameters help us to identify regions with strong low-level winds. Model parameters are not considered here as proof of the presence of a sting jet; however, they are a clear sign of ongoing atmospheric processes that provide evidence of a sting jet.
In Figure 3, a clear wind maximum at 950 hPa can be identified in the region where a sting jet would be expected. The SEVIRI 10.8 μm image shows a darker area, which is an indication of sinking air.
Figure 3: SEVIRI IR10.8 μm image from January 9, 2018, 00:00 UTC. Wind barbs and isotachs (yellow) at 950 hPa.
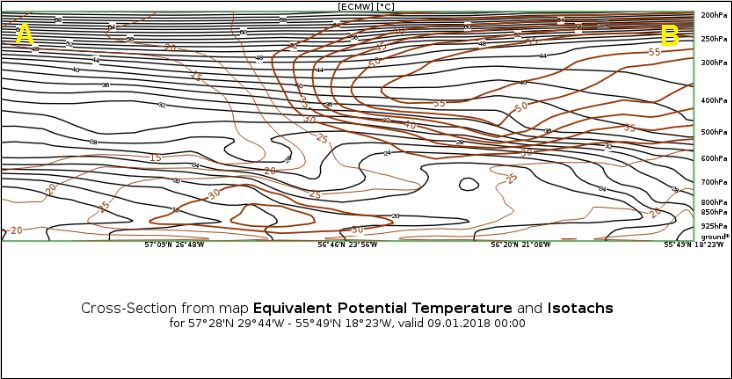
The vertical cross section through the area of the highest wind speed shows a maximum below 700 hPa sloping down towards lower levels.
Figure 4: SEVIRI IR10.8 μm image from January 9, 2018, 00:00 UTC. The green line (left) marks the position of the vertical cross section (right).


