Chapter III: Upper layer image
Upper layer image
The upper layer image is usually a colour-enhanced infrared (IR) window image, but not necessarily. In the chapter VI. examples of other combinations are shown. The first case discussed is when a colour-enhanced IR window channel is used as the upper layer image.
Spatial distribution of the storm top temperature contains useful information about the storm (see the details in the 'Which features might be seen in infrared (IR) window images?' sub-section).
First the IR window channel data has to be calibrated into brightness temperatures (BT). As the BT is a good approximation of the cloud top temperature in the thick, opaque parts of mature storms, the calibrated IR window BT images can be used as a good manifestation of spatial distribution of the storm top's 'real' (thermodynamic) temperature.
An appropriate colour enhancement aids better visualisation of BT spatial distribution in the cloud top region. Fig. 3.1 shows a SEVIRI IR10.8 (10.8 μm infrared) image visualised by:
- a black and white colour scale in a 'broad' BT region (200-305 K) in the left panel;
- a black and white colour scale in a 'narrow', coldest BT region (200-240 K) to highlight only the cloud tops;
- a partly black and white (240-305 K), partly continuous colour scale (200-240 K) in the right panel.
In the left panel the mature storm cloud tops are all white; we do not see any cloud-top structures in them. By narrowing the BT range (still in black and white scale, see the middle panel) we start to see the structures of the BT distribution on the cold cloud tops, but we get much a better result by using colour scale (right panel). Human eyes are more sensitive to variations in colour scale than to grey shades (within the same BT interval), so, it is much better to apply a colour scale instead of a black and white scale.
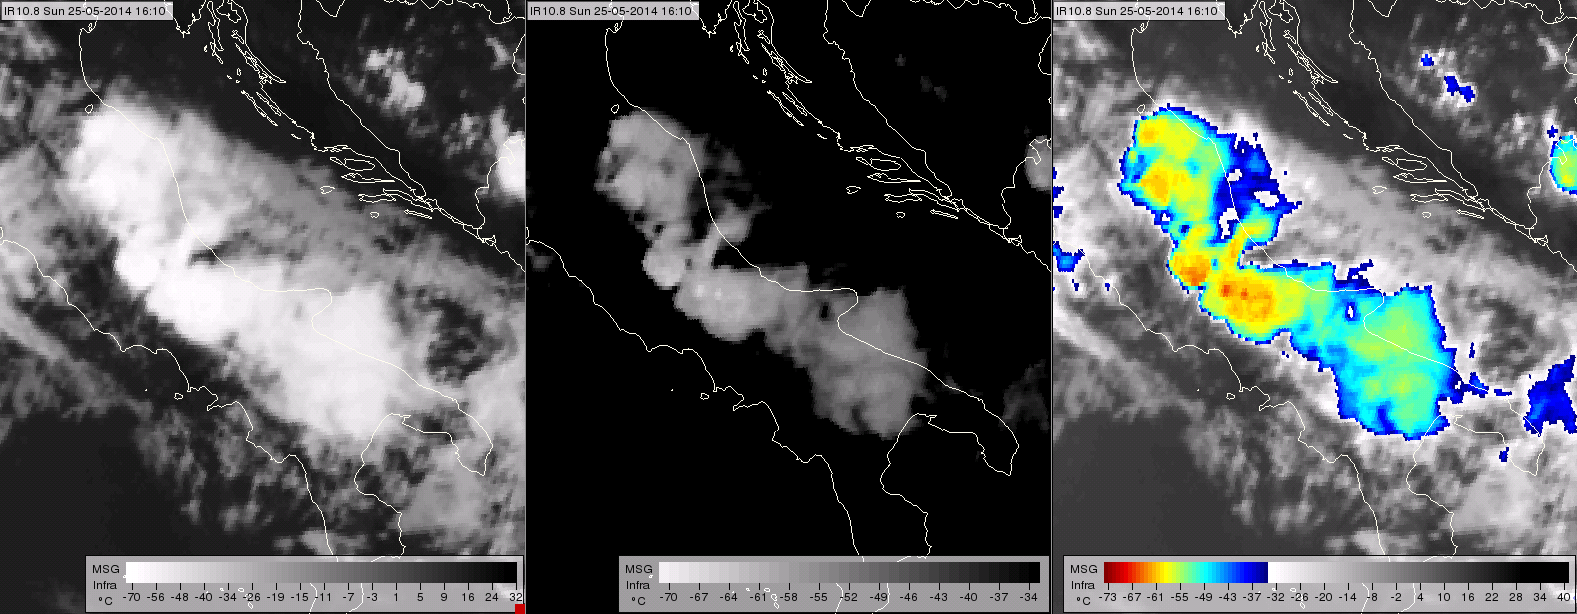
Figure 3.1: Meteosat SEVIRI IR10.8 image, taken on 25 May 2014 at 16:10 UTC, visualised with black and white colour scale (assigned to the 200-305 K BT range) in the left panel, black and white colour scale (assigned to the 200-240 K BT range) in the middle panel, and partly black and white, partly continuous colour scale in the right panel.
Note: one could use colours for the whole BT range as well, but for purposes of storm top analyses it is more beneficial to enhance only the coldest BT range with colours. In that way our attention will be attracted to the coldest parts of the storms.
The colour scale can be:
- 'smooth and continuous', using many colour shades assigned to fine BT steps with smooth interpolated transitions between the individual BT steps, (see e.g. Fig. 3.3 colour scale);
- a 'step-scale' using only limited number of discrete colours (each colour representing a broader BT interval);
- a combination of both, several continuous scales with 'colour jumps' on margins of the specific BT intervals (see the colour scale on the left panel of Fig 3.2.).
There are different colour scales for cloud top analysis used operationally at meteorological offices. The left panel of Fig. 3.2 shows an IR window image with the colour enhancement used in the US before the launch of GOES-R, while the right panel shows the same scene with a smooth colour 'blue-red' enhancement.
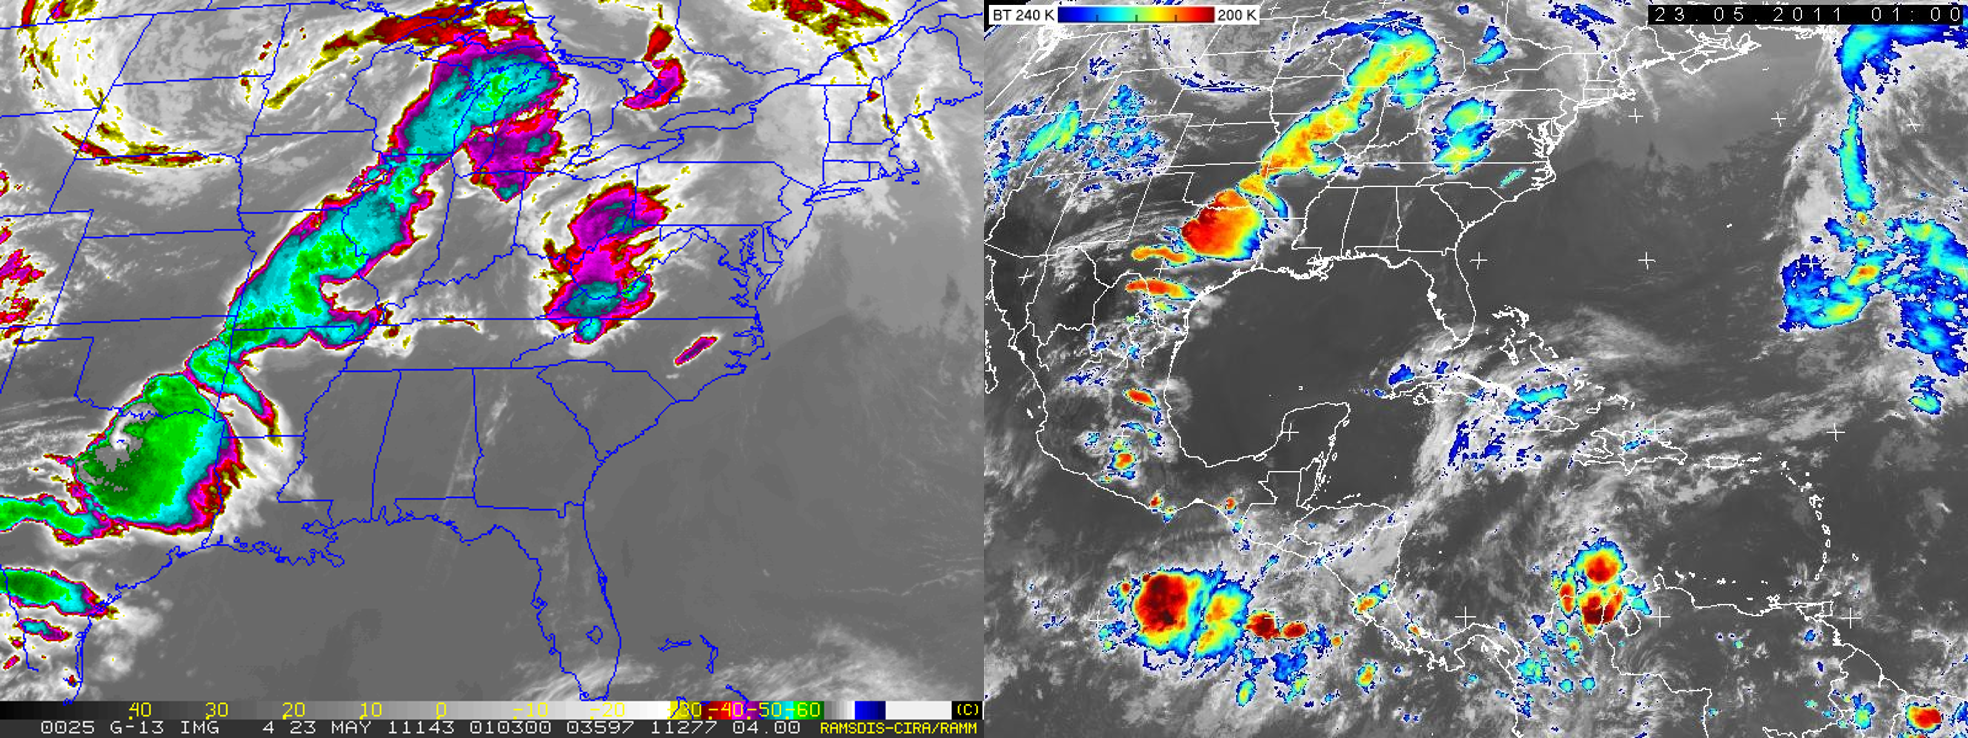
Figure 3.2: GOES IR image enhanced with the colour scale used for many years in the US (left), and with the (smooth and continuous) blue-red colour scale (right). GOES-13 IR image, taken on 23 May 2011 at 01:00 UTC. (Courtesy of NOAA, and Martin Setvák, CHMI)
The Convection Working Group (CWG) of EUMETSAT and the European Severe Storms Laboratory (ESSL), recommended in 2007 that European MSG users use a common 'smooth and continuous' colour scale (see Fig. 3.3) as standard. Using the same colouring has several benefits, e.g. people from different countries will need less time to interpret or get used to each other's colour-enhanced images.

Figure 3.3: Colour scale recommended to use for cloud top analysis on IR window images.
This specific colour enhancement is based on a standard 'blue-red colour table', used in various remote-sensing software packages or systems, in this case adopted from IDL/ENVI (https://www.harrisgeospatial.com/Software-Technology/ENVI). Further details on this topic, and downloadable colour tables for various systems, can be found here.
In this 'standard' colour scale the coldest colours are red. For a human, red is typically associated with some form of danger or importance; in satellite IR imagery, the highest 'overshooting' or 'penetrating' tops of convective storms are typically represented by the coldest pixels in the image, and at the same time these represent the most active and dangerous part of it - hence, the assignment of the red colour to the coldest temperatures.
It is important to note that users should tune the range of the BT for their geographic region. The BT range (BT 240K-200K) seen in Fig 3.3 is suitable for typical (Central) European storms. However, in some cases, or for other geographic regions, it may need some adjustment (shift and/or stretch of the brightness temperature range represented in colours), mainly depending on the tropopause temperature and height. For lower latitudes (tropics, sub-tropics and lowest mid-latitudes) this BT scale needs to be shifted to about 230K-190K or even 220K-180K.
Fig. 3.4 shows an example where the standard colour enhancement has to be shifted towards colder temperatures. The images show the black and white and the colour-enhanced IR10.8 images shifted within the range from (BT 240K-200K) to (BT 220K-180K) at 5 K steps. The storm-top appearance drastically changes with a simple shift of the used colour-scale range. One has to find the most suitable, optimal enhancement for a given geographical region and state of the atmosphere. In this case the 225K-185K range was optimal.
After setting the optimal BT range of the colour scale, several colder pixels than the lower limit of the BT range may remain. In such cases if the image is processed manually one can slightly shift or broaden the palette or if the image is processed operationally it is possible to define some more colours (e.g. darker red shades) for these coldest BT values.
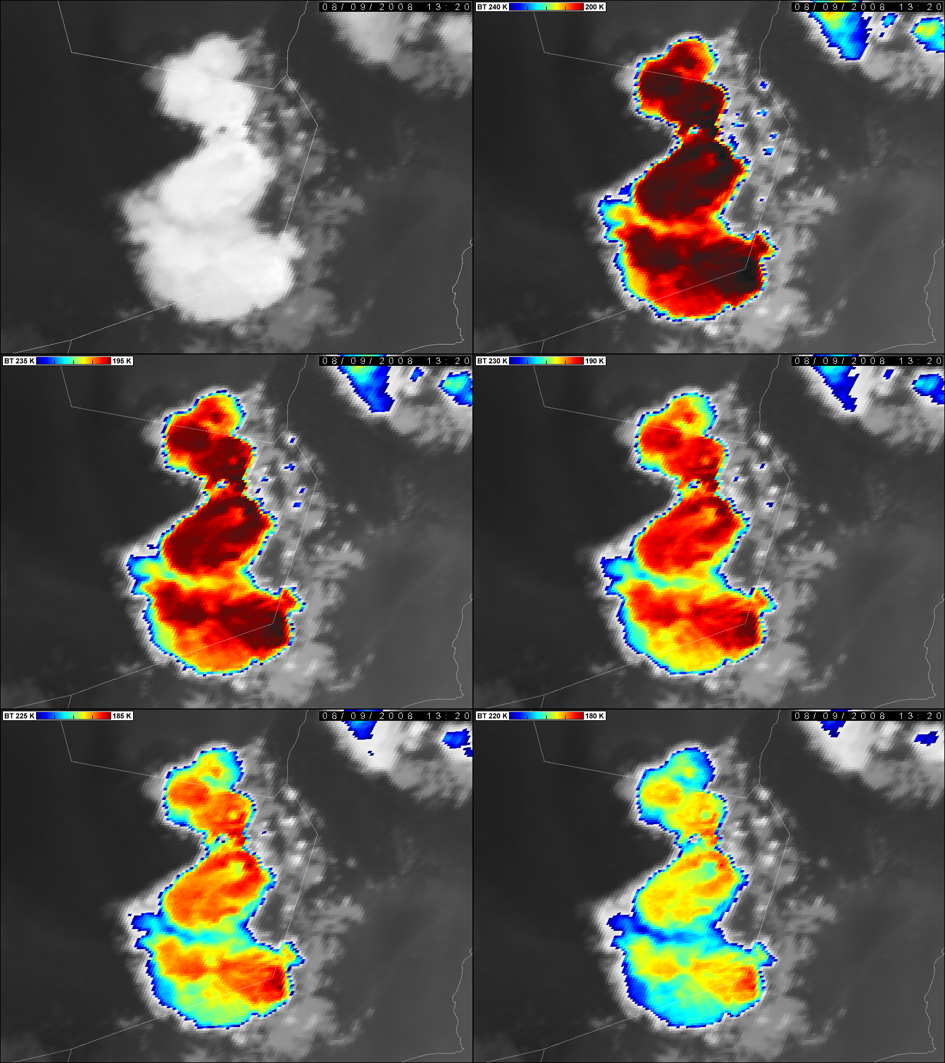
Figure 3.4: Meteosat-8, IR10.8 BT image, 9 August, 13:20 UTC, Arab Peninsula, eastern parts of Rub al Khali. The upper left panel visualises the IR10.8 image with black and white scale, the other panels show it with the standard colour scale but the range is shifted from (BT 240K-200K) to (BT 220K-180K) with 5 K steps. (Courtesy of Martin Setvák, CHMI)
As the main aim of these images is storm top analysis, namely of their details, this colour enhancement is usually used for a closer look at storms or their systems, as shown in example in Fig. 3.5.
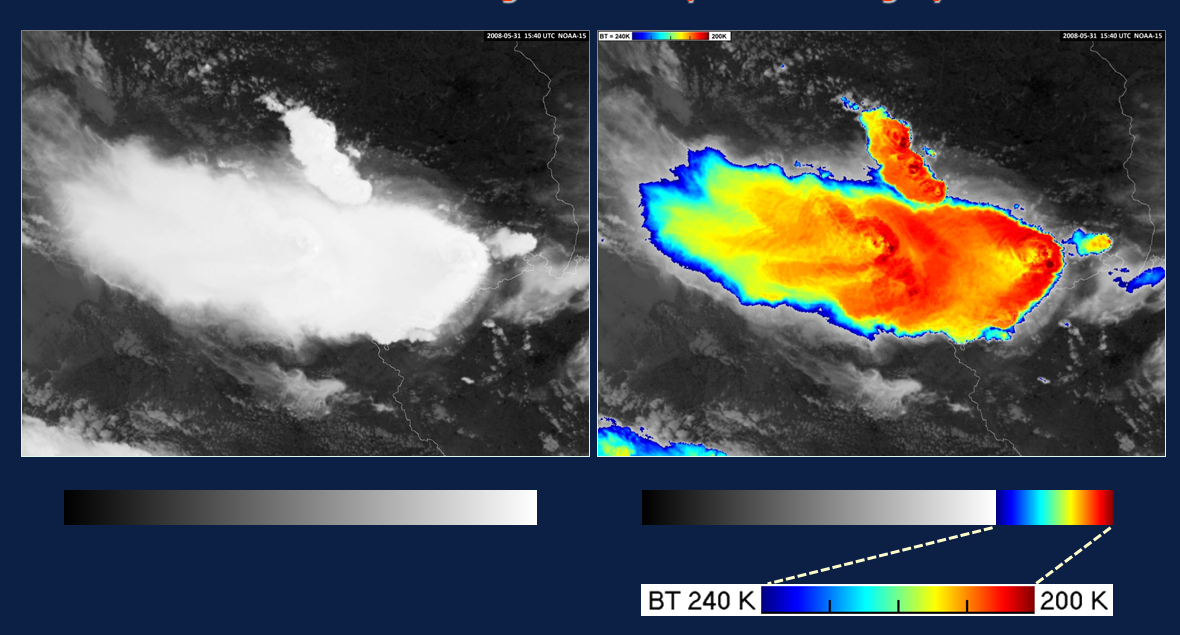
Figure 3.5: NOAA-15 IR image, taken on 31 May 2008 at 15:40 UTC, visualised with black and white colour scale (left) and the EUMETSAT recommended colour scale (right). (Courtesy of Martin Setvák, CHMI)
Which features might be seen in infrared (IR) window images?
With the standard colour enhancement, one can well see the BT structure of the storm top. Some special BT features are important, for example, the so-called cold-ring, cold-U/V shapes on top of mature storms (see Fig. 3.6). There appears to be a strong correlation between the long-lived cold-ring, cold-U shape and the storm severity.
Other severity-related cloud top features seen in the IR window images are the overshooting tops. The overshooting tops are often the coldest pixels (local BT minima) on the cloud top, but not always, and are frequently used as one of the indicators of storm severity.
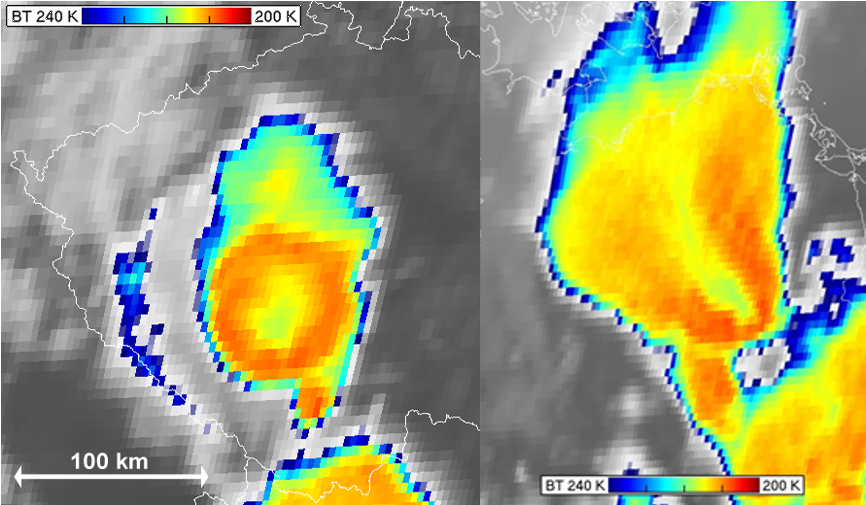
Figure 3.6: Cold-ring-shaped storm seen in colour-enhanced SEVIRI IR10.8 image over Czech Republic, taken on 25 June 2006 at 13:45 UTC (left) and cold-U-shaped storm over Germany, taken on 26 May 2007 at 15:00 UTC (right). (Courtesy of Martin Setvák, CHMI)
Further examples of cold-ring-, cold-U-shaped storms are shown in Figs. 3.7 and 3.8 and in the following chapters.
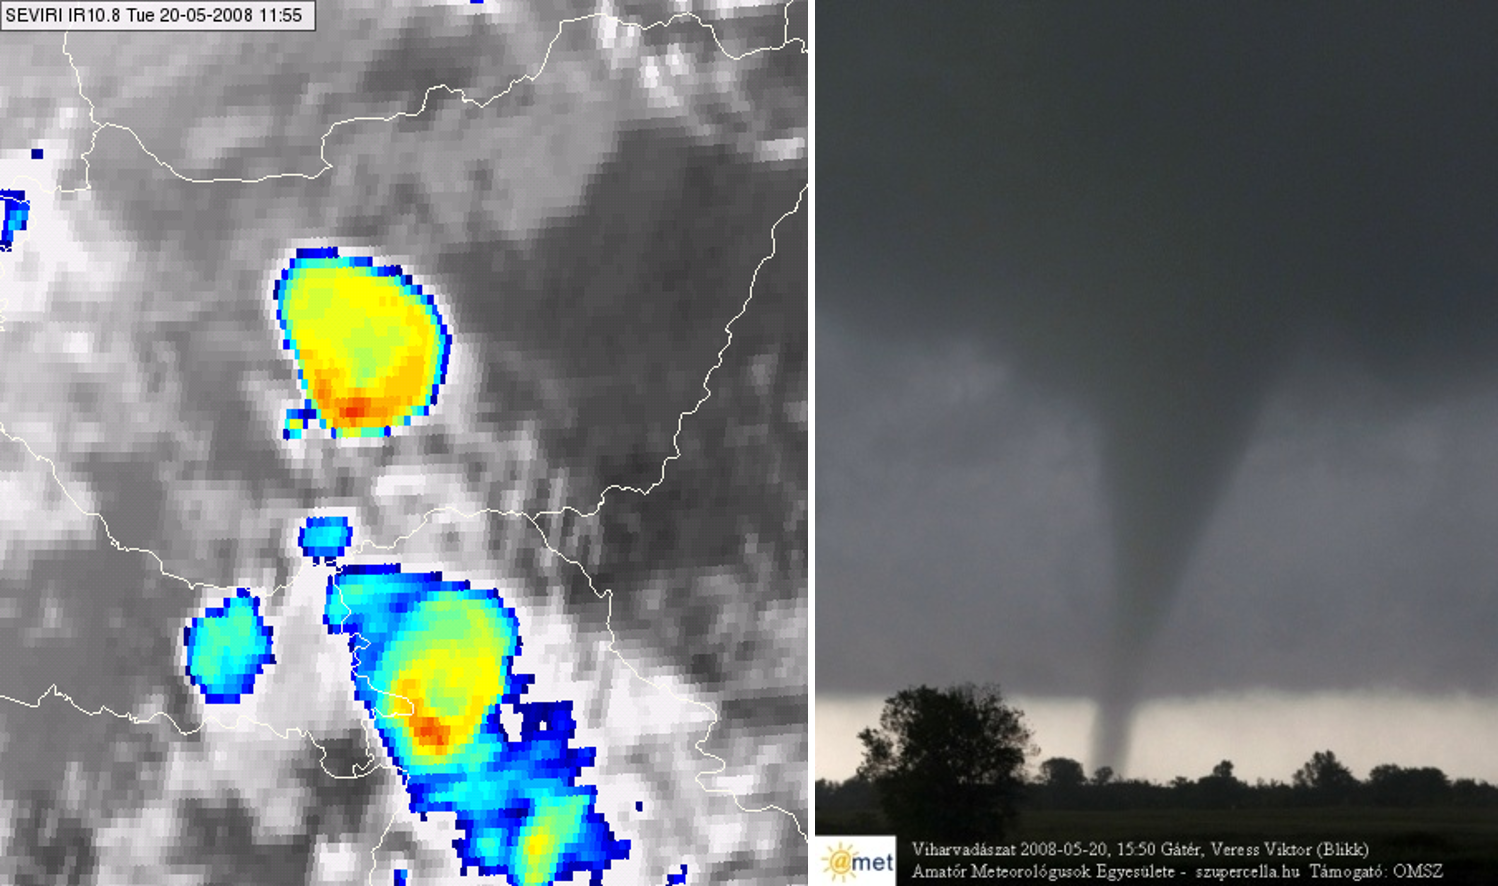
Figure 3.7: Meteosat SEVIRI IR10.8 image over Hungary, taken on 20 May 2008 at 11:55 UTC (left), observed tornado (right) from the most northern storm (left).
Animation (created from 5-minute SEVIRI IR10.8 data, 20 May 2008, 10:20-19:00 UTC)
A detailed study about this case: https://www.eumetsat.int/website/home/Images/ImageLibrary/DAT_IL_08_05_20.html
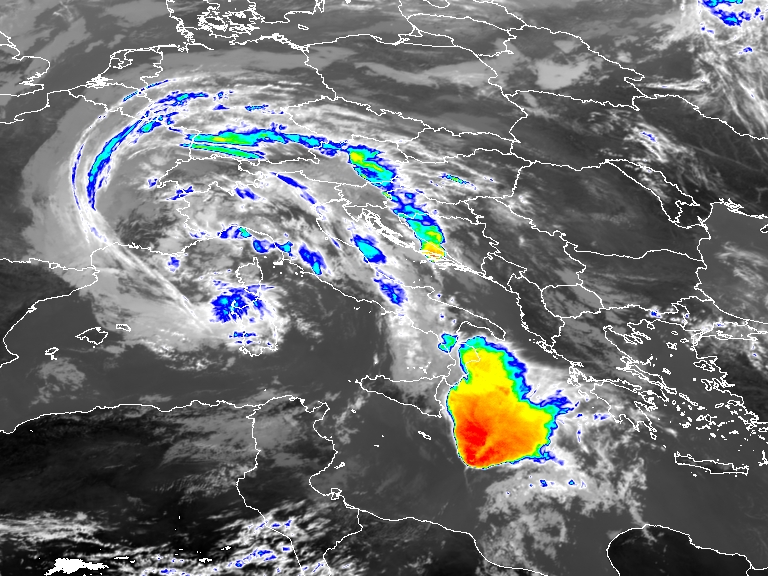
Figure 3.8: 3.8: Meteosat-8, colour-enhanced SEVIRI IR10.8 image, taken on 4 October 2005 at 11:00 UTC. (Courtesy to Jochen Kerkmann, EUMETSAT)
Animation (SEVIRI IR10.8, 3 October 12:00 UTC-4 October 15:00 UTC)
A detailed study about this case: https://www.eumetsat.int/website/home/Images/ImageLibrary/DAT_IL_05_10_04_B.html
Summary
The most commonly used sandwich product utilises a colour-enhanced IR window image. EUMETSAT recommends its standard colour scale to enhance the coldest BT range of the image. This BT range may need some tuning, depending on the actual tropopause temperature.
There are certain severity-related cloud top features which might be seen in these colour-enhanced IR images: cold-rings, cold-U/V shapes, overshooting tops, and cloud top gravity waves.