Chapter II: Synoptic analysis
Table of Contents
- Chapter II: Synoptic analysis
- Synoptic analysis
Synoptic analysis
Two baroclinic zones can be identified in this synoptic situation. The first one south of Finland moved across Finland on previous day and changed the unseasonal warm air mass (t850hPa 10-12 °C) to somewhat cooler polar air mass. The second frontal zone was over Finland ; quite cold air mass could be seen on its rear side. Temperature at 850 hPa was -2..-5 °C. During the day (28 September 2009) convective features were moving mostly over the land areas. Some of those convective systems had structures similar to bowing lines or bow echo's. However, convective features were in relatively shallow layer mostly below 5 km according to the radar and sounding profiles (not shown). Later in the evening at 16 UTC a convective line approaching from southwest hit southwestern Finland. This convective line was clearly in connection with strong cold advection associated with cold front and was responsible for the observed strong gusty wind.
 @ saarikalle09lk.png)
Figure 1: Meteosat 3,9+10,8+12.0 μm RGB image; 28 September 2009 / 12 UTC. This combination image shows the coldest cloud tops and frontal cloudiness in bright white colours, while lower and warmer cloud tops are seen in dark red colours. This combination image shows well the location of the trough over South-western Finland. Satellite image is overlaid with HIRLAM RCR surface pressure and manual synoptic analysis. Long arrows represent 300hPa jet stream over 30 m/s, dotted line is upper level trough (500hPa) and blue and red lines are surface cold and warm fronts, respectively
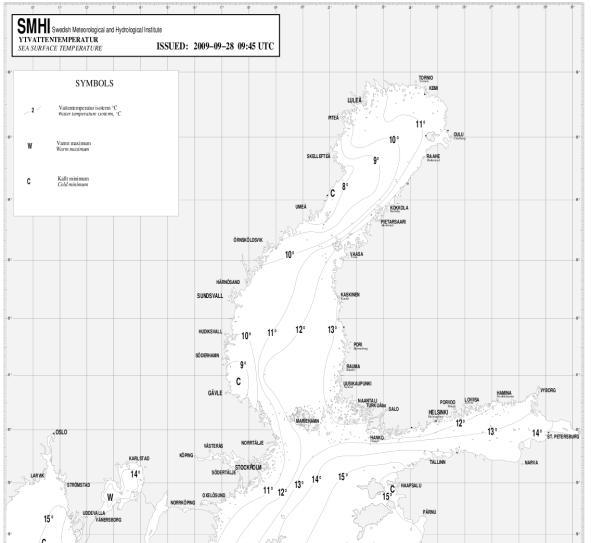
Figure 2: Sea surface temperature (SMHI). Conditions over sea were somewhat typical to autumn in Finland, sea areas were still quite warm, surface temperature was typically near 15 °C.
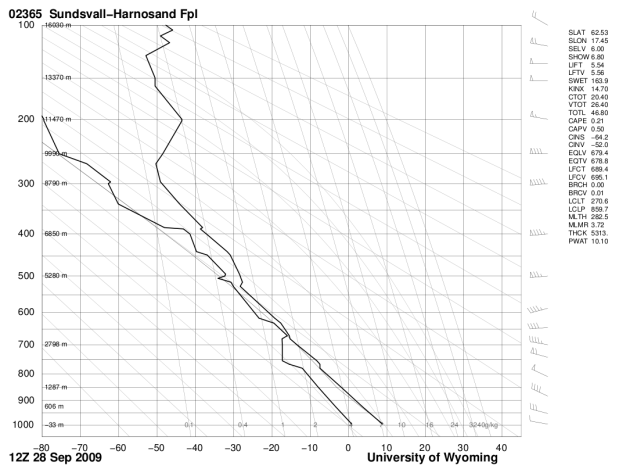
Figure 3: Sundsvall sounding 28 September 2009 12 UTC. Sundsvall sounding site is at the eastern coast of Sweden near northern jet stream axis.
Sundsvall sounding represents inland area at the rear of cold front earlier in the day, before it hit south-western Finland. In addition to 300 hPa jet stream, a low level jet stream (~30 m/s) can be seen in this observed sounding near 750 hPa. Most interestingly, the almost dry adiabatic lapse rate reaches as high as 800 hPa. At that level the wind was also quite strong, around 25 m/s. Over sea areas surface temperature and dew-point temperature were even a bit higher and that may have supported the development of a convective band, which is seen in the following satellite and radar images.