Appearance in satellite images
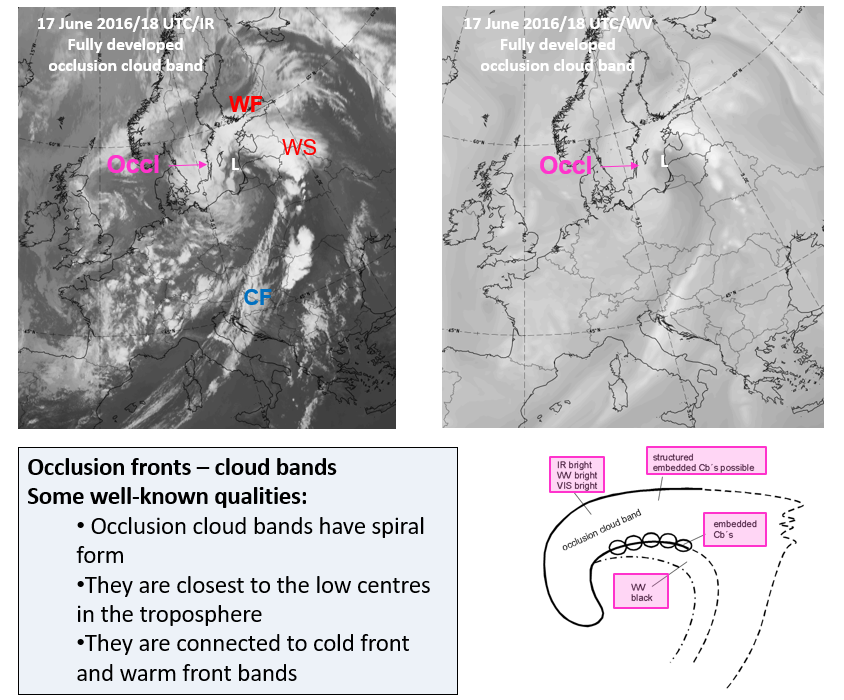
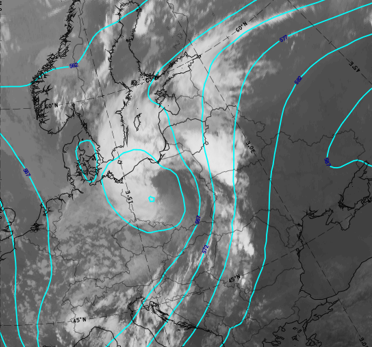
Figure 1: Occlusion front
The schematic shows and describes features typical for occlusion cloud bands in the basic satellite channels. These are to be compared with an actual case:
- Synoptic scale spiral structure
- Bright in IR, VIS, WV channels
- Black stripe in WV on the rear side
- Lumpy structure from embedded Cbs
Meteorological-physical background
 |
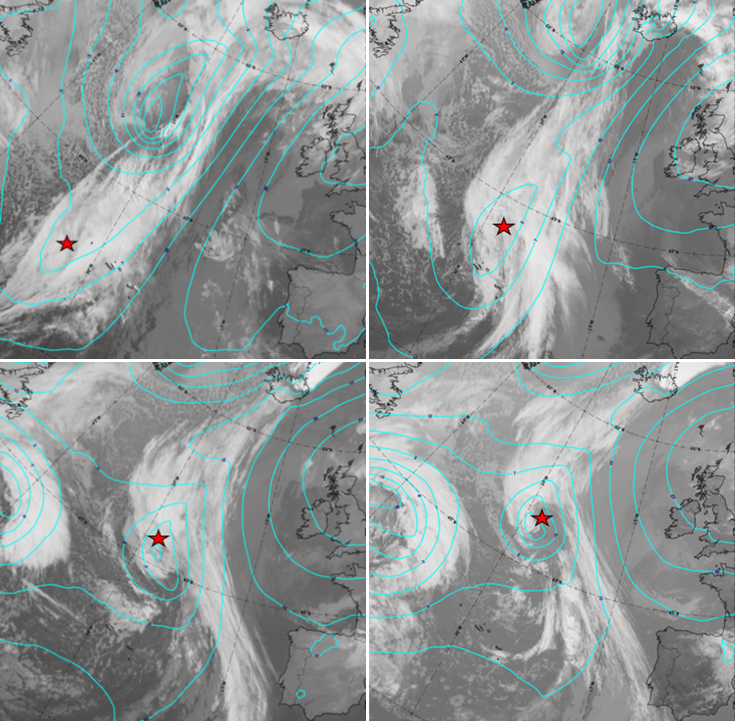 |
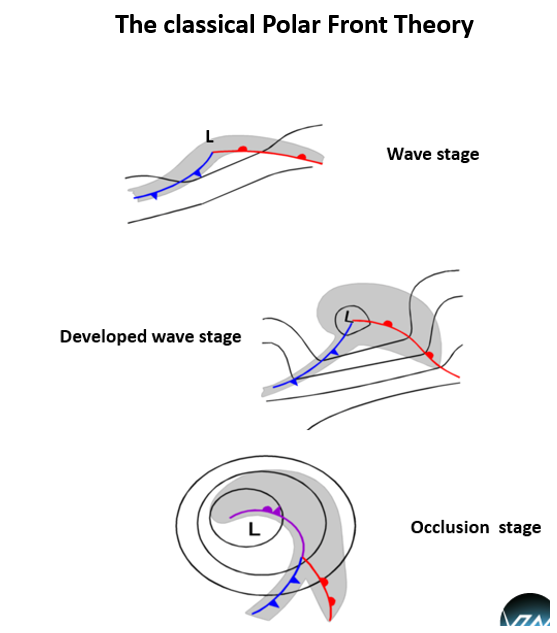
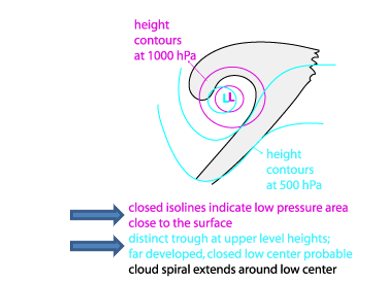
Figure 2a & 2b
For the CM "occlusion" the meteorological physical background has to describe the development. A well-developed occlusion cloud band is often the end stage of the classical polar front theory.
This can and should be checked with a sequence of images showing each stage of development from wave to occlusion.
Key parameters
For the CM "Occlusion" six key parameters have been derived which have a special relation to the cloud band and show special configurations:
- Height contours
- Thickness advection
- Temperature advection
- Isotachs
- Vorticity
- Vorticity advection
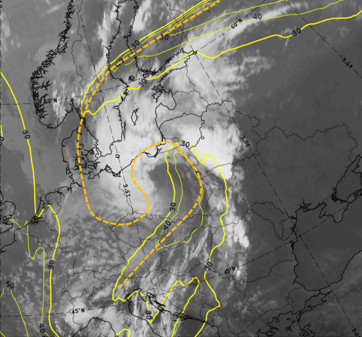
An example for height contours:
 |
14 July 2016 / 18 UTC Upper image: Lower image: Fully developed low centre from surface to upper levels |
 |
 |
Figures 3a-3c: Height contours
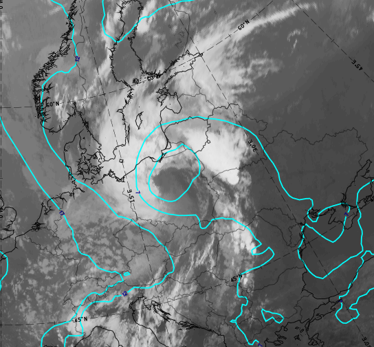
Another schematic indicates a jet axis spiralling around the cloud spiral, a jet streak on the rear side of the cold front cloud band and a maximum of cyclonic vorticity advection in the left exit region of the jet streak, which is the center of the cloud spiral.
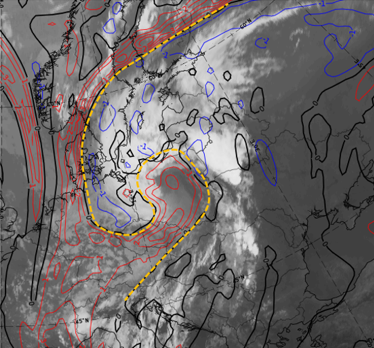 |
14 July 2016 / 18 UTC Upper image: Lower image: Jet streaks are along the rear edge of the CF and the Occlusion cloud band; jet axis extends from the inner cloud edge of the occlusion to the outer one |
 |
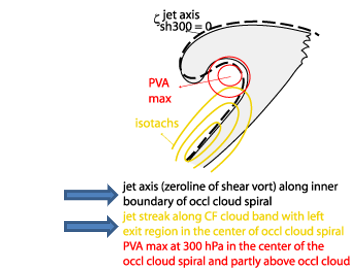 |
Figure 4: Jet stream
Chapter 4: Appearance in Vertical Cross Sections
For the CM "Occlusion" there are seven key parameters which are indicative and show special features in vertical cross sections:
- (Moist) isentropes and humidity
- Divergence and vertical motion
- Temperature advection
- Vorticity advection
- Potential vorticity
An example for isentropes:
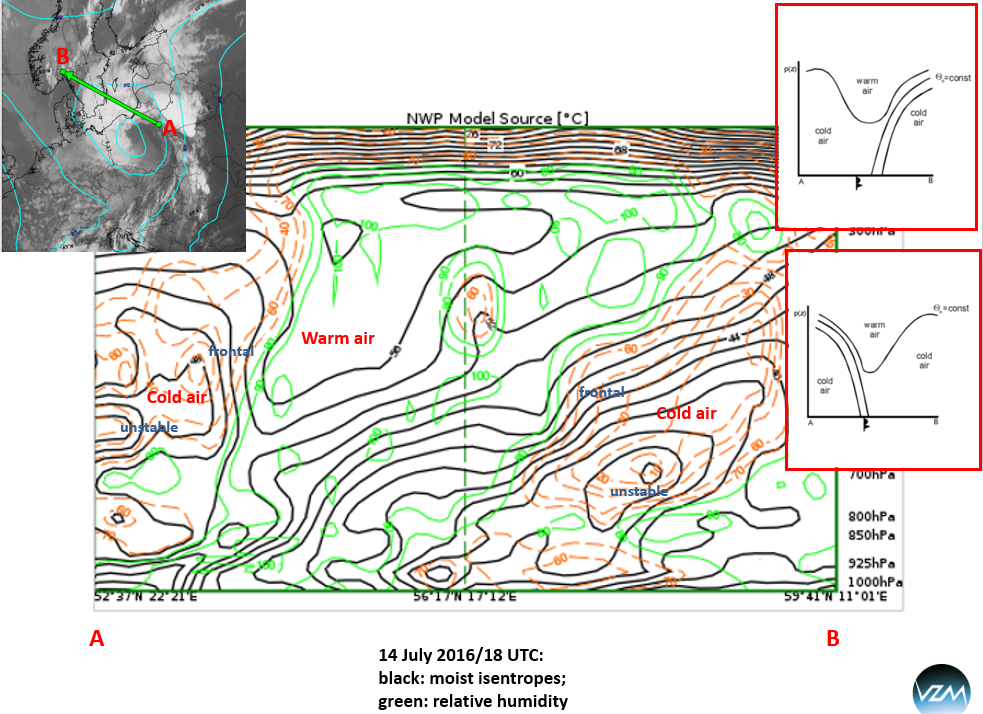
Figure 5: Vertical cross section of relative humidity
The schematic shows a trough over the spiral cloud band, indicating the presence of warm air in middle and upper levels.
Another schematic indicates a large area of warm air advection on the leading frontal side and within the isentropic trough and a thick layer with cold air advection to the rear of the isentropic trough.
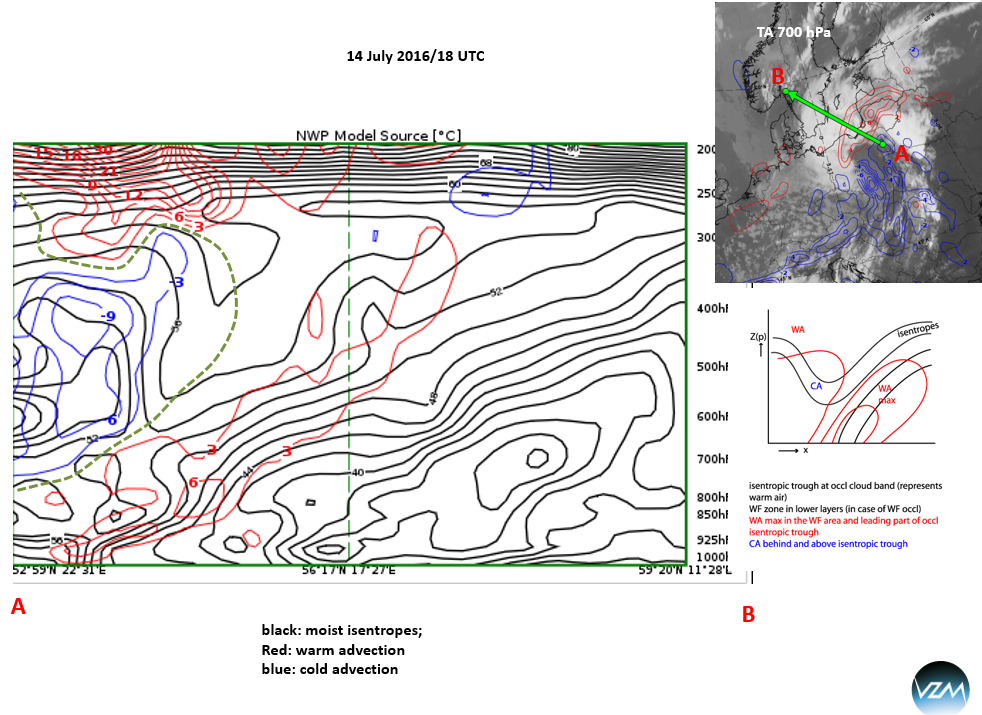
Figure 6: Vertical cross section of temperature advection
Weather Events
| Parameter | Description |
|---|---|
| Precipitation |
|
| Temperature |
|
| Wind (incl. gusts) |
|
| Other relevant information |
|
Figure 7: Weather types in Warm Conveyor Belt Occlusion
Weather and radar observation are basic parameters for cloud and precipitation conditions.
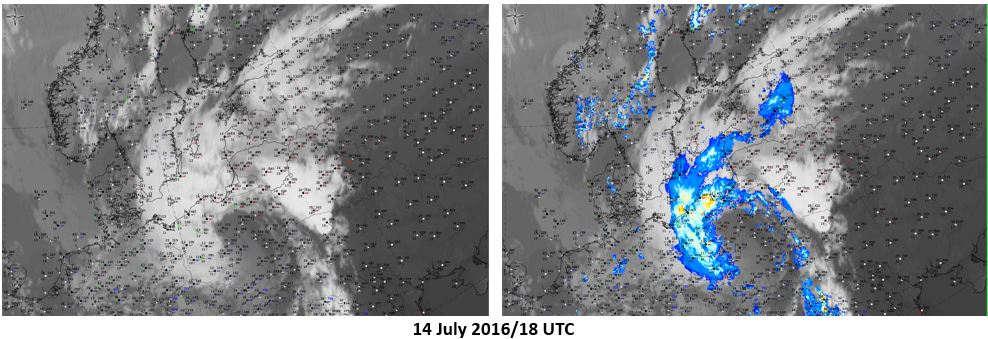
Figure 8a & 8b: Synoptic observations (left), synoptic observations + Opera Radar (right)
For more detailed cloud information, satellite evaluations such as from the Nowcasting SAF are supplementary information sources.
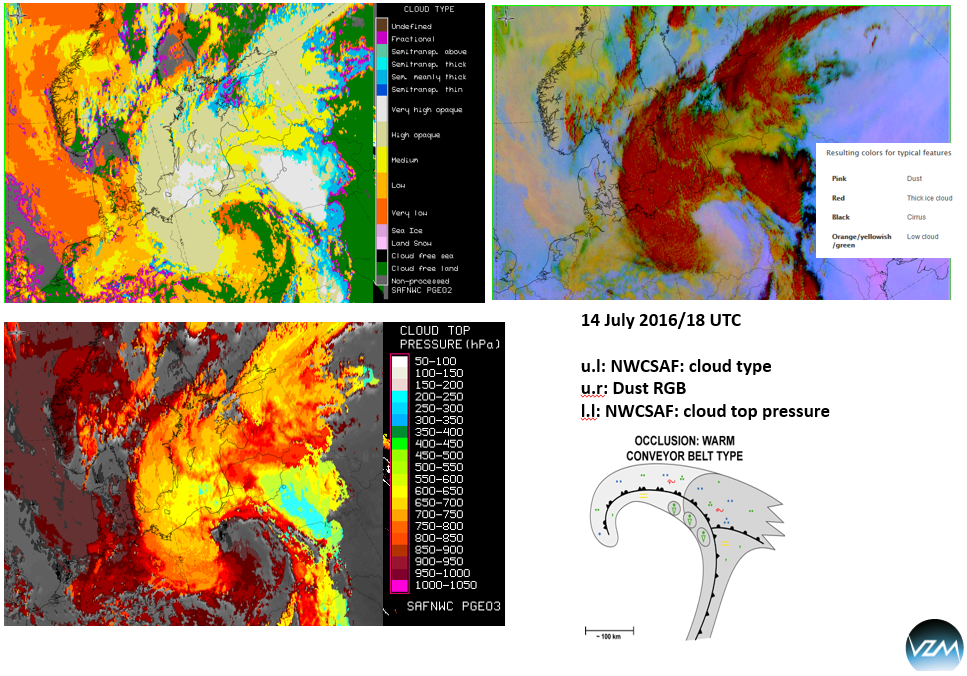
Figure 9: Additional cloud information