Cloud Structure In Satellite Images
- Cb Clusters appear as a group of relatively large separate cells in satellite images.
- In the IR, VIS and WV images Cb Clusters are generally white, indicating thick, multi-level clouds, but in the initial phase of development separate grey cells are visible, indicating relatively low tops.
- Very often the surrounding atmosphere is characterized by the development of other convective cells.
- In well-developed phase, cirrus shields of single CB cells merge, leading to a very white smooth cloud shield in the IR and a somewhat transparent appearance in the VIS image.
|
Cb Cluster in Developing Stage
|
Cb Cluster in Mature Stage
|
|
|
In most cases Cumulonimbus clouds of considerable dimension exist within a group of smaller convective cells (see Meteorological physical background). In the mature stage the anvils of the large Cumulonimbus clouds extend downstream from the actual cells, which appear as a transparent grey to white layer in the IR image.
|
03 April 2006/12.00 UTC - Meteosat 8 IR 10.8 image
|
03 April 2006/12.00 UTC - Meteosat 8 VIS 0.6 image
|

|

|

|
|
|
03 April 2006/12.00 UTC - Meteosat 8 WV 6.2 image
|
|
Satellite image shows clouds from Cold Front in Cold Advection and Cb Clusters in the Warm Air in front of it over Balkan Peninsula. Both Clusters, one over western Greece and another in eastern Croatia and Serbia can be seen in all three images. In IR image, only the Cbs in mature stage are pronounced, while in VIS it is quite difficult to make the distinction. In WV the Cb cluster is easily seen, especially when it is well developed like the one over Greece.
Appearance in Meteosat 8 HRVIS and RGB composite imagery
High resolution of Meteosat 8 HRVIS images makes smaller fine-scale cloud structures more distinct. The process of Cb Clusters developing into MCS over Slovenia and southern Austria can be nicely followed while multi-cell structure of the bigger system is much better visible.
|
03 April 2006/11.00 UTC - Meteosat 8 HRVIS image
|
03 April 2006/11.00 UTC - Lightning detection
|
|
|
To take into account and combine different types of information retrieved from SEVIRI imagery, such as optical thickness of clouds, particle size and phase, upper and mid level moisture and cloud top temperature, combinations of channels are constructed.
To observe daytime convection, Microphysical RGB VIS0.6, NIR1.6, IR10.8i is recommended. In this type of image, already at a very early stage the convection appears white to light pinkish, getting more pink as convection progresses; first icing can be spotted as magenta cores turning darker to become purple as ice particles grow.
|
02 August 2006/12.00 UTC - Meteosat 8 RGB (VIS0.6, NIR1.6 and IR10.8i) image
|
Cb Cluster as it appears in RGB VIS0.6, NIR1.6, IR10.8i imagery
|
|
|
Due to the dual character of NIR3.9 channel, similar information can be found in RGB VIS0.6, NIR1.6, NIR3.9.
|
02 August 2006/12.00 UTC - Meteosat 8 RGB (VIS0.6, NIR1.6 and NIR3.9) image
|
Cb Cluster as it appears in RGB VIS0.6, NIR1.6, NIR3.9 imagery
|
|

|
The best visual appearance of severe storms is given by so called Severe Convection RGB (WV6.2-WV7.3, NIR3.9-IR10.8, NIR1.6-VIS0.6). In this type of composite cold Cb tops with small ice particles appear in yellowish colours and well developed Cbs with large ice particles appear red. In cases of severe thunderstorms small particles or even water droplets can be brought up to the cloud top by strong updrafts appearing in satellite image much lighter than the environment. For that reason, overshooting tops can be easily identified in this RGB.
|
02 August 2005/12.00 UTC - Meteosat 8 Convective Storms RGB (WV6.2 -WV7.3, NIR3.9 -IR10.8 and NIR1.6 -VIS0.6) image
|
Cb Cluster as it appears in Convective Storms RGB
|
|

|
Although this composite is not aimed strictly for detection of convection, it can be seen in so called Night Microphysical RGB (IR12.0-IR10.8, IR10.8-NIR3.9, IR10.8). In this combination thick Cb clouds appear dark orange or red. In some parts of the clouds, namely growing parts, the colour is somewhat sprinkled, effect resulting from noise in channel NIR3.9.
|
02 August 2005/22.00 UTC - Meteosat 8 Night Microphysical RGB (IR12.0-IR10.8, IR10.8-NIR3.9 and IR10.8) image
|
Cb Cluster as it appears in Night Microphysical RGB
|

|
|
For night-time detection, Airmass RGB (WV6.2-WV7.3, IR9.7-IR10.8, WV6.2i) can also be used. Thick high level reaching Cb clouds appear white in this type of images. This is also a very good combination for early detection of convection. It can be seen that convective development takes place in the dark blue areas of moist lower and dry higher troposphere. Dry stratospheric air intrusion which enhances the instability and makes this area favorable for convection can be recognized by its red color.
|
02 August 2005/22.00 UTC - Meteosat 8 Airmass RGB (WV6.2-WV7.3, IR9.7-IR10.8 and WV6.2i) image
|
Cb Cluster as it appears in Airmass RGB
|
|
|
Combinations with HRVIS channel bring in the advantages of high spatial resolution. In the most used RGB composite of the high resolution visible (HRVIS,HRVIS,IR10.8i) cirrus anvils appear bluish and most intense convective development can be recognized by its pronounced light yellow, sometimes even white color. Due to the three times higher resolution, overshooting tops are clearly visible.
|
02 August 2006/22.00 UTC - Meteosat 8 High resolution RGB (HRVIS, HRVIS and IR10.8i) image
|
Cb Cluster as it appears in High resolution RGB
|
|

|
|
|
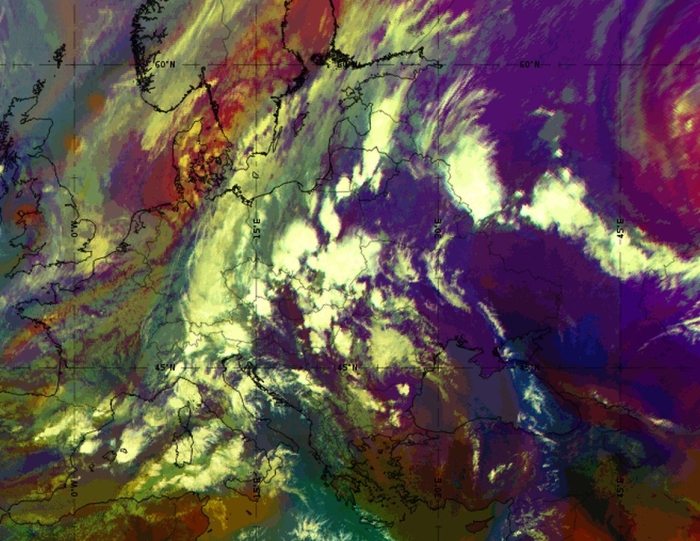
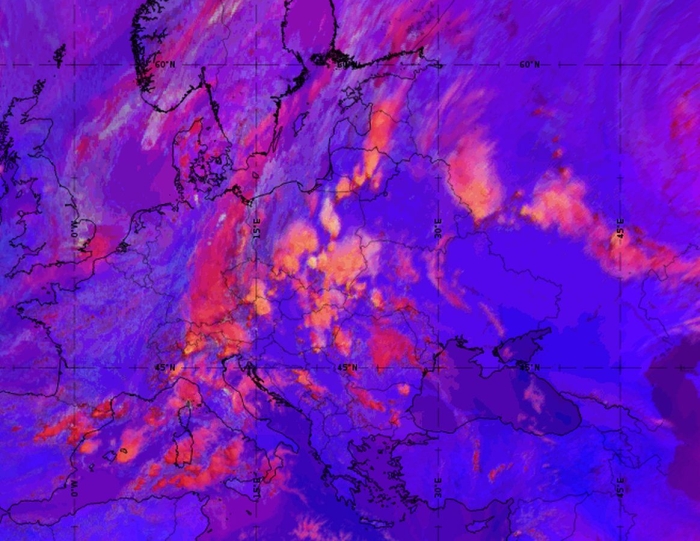
Airmass RGB (left) and Convection RGB (right) from 07 June 2020, 15 UTC
This example shows the advantage of the Convection RGB: while the Airmass RGB depicts high-level thick clouds in quite a uniform whitish tone, with only little distinction in colour, the Convection RGB depicts them in many different shades of orange and yellow. This even helps to provide a three-dimensional impression of the cluster. As the schematic of the Convection RGB shows, young convective cells appear very bright (whitish or bright yellow), growing cells are coloured orange and mature convective cells appear in an intense red colour.


Schematic Airmass RGB (left); Schematic Convection RGB (right)
Appearance in AVHRR imagery
- Cb Clusters are easy to detect with AVHRR images, as the better resolution helps to see the individual cells better.
- Combination image 124 is very powerful in showing these cells. As the cells grow and the cirrus anvils spread, the intensely white cores stay identifiable within the bluish cirrus filaments.
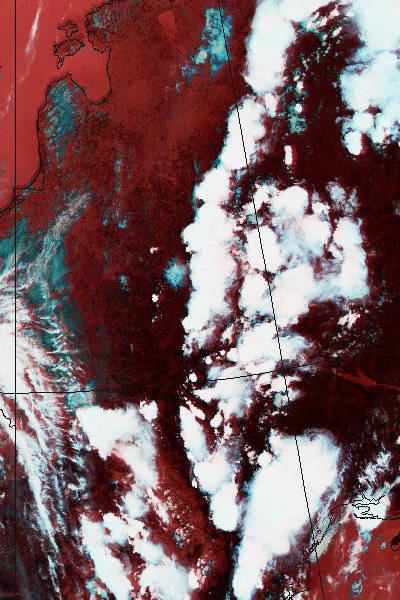
- 124 image combinations usually give a better visual appearance than daytime 345 image combinations due to better contrast between convective areas within the cloud and surrounding cirrus clouds. Cb Clusters are also very striking in 345 image combinations due to strong contrast between white clouds and dark red cloud-free land areas.
|
10 June 1999/15.01 UTC - NOAA RGB (channel 1, 2 and 4) image
|
10 June 1999/15.01 UTC - NOAA RGB (channel 3, 4 and 5) image
|
|
|
|
|
|
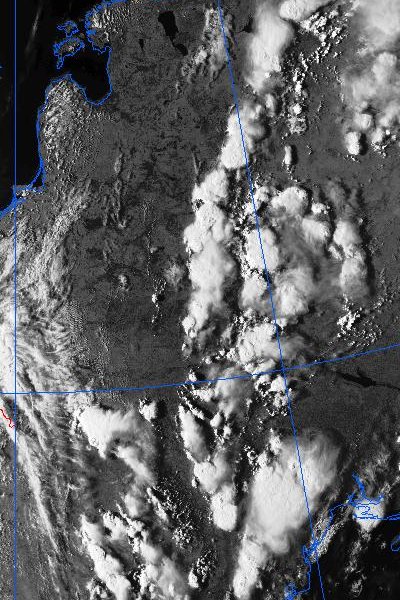
10 June 1999/15.01 UTC - NOAA CH2 image
|
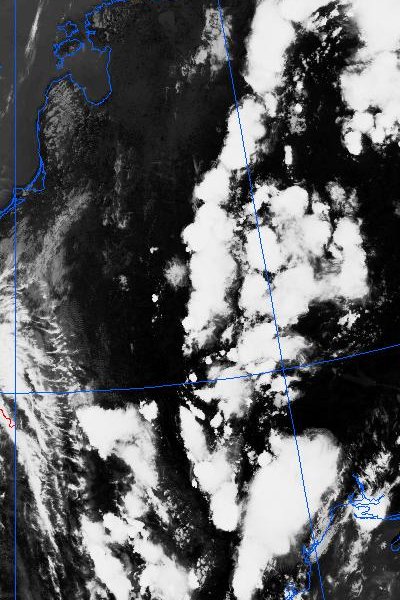
10 June 1999/15.01 UTC - NOAA CH4 image
|
In the satellite images numerous separate well developed Cb cells are located over western Russia, White Russia and Ukraine (the northwestern corner of the Black Sea is located in the bottom right corner of each image, while Estonia is located in the top left corner).
The Cb cells can easily be identified as being mainly separate clouds systems. Some merging of the clouds is taking place just northwest of the Black Sea. The NOAA 124 images show the thick Cb cores within the surrounding bluish cirrus anvils. At the same time the Cb cells in the NOAA 345 images are very distinct white in otherwise reddish surroundings, but the details are partly lost due to the saturated whiteness everywhere within the cells.
Similar differences can also be seen in the individual VIS and IR images.