Table of Contents
Cloud Structure In Satellite Images
- Cb Clusters appear as a group of relatively large separate cells in satellite images.
- In the IR, VIS and WV images Cb Clusters are generally white, indicating thick, multi-level clouds, but in the initial phase of development separate grey cells are visible, indicating relatively low tops.
- Very often the surrounding atmosphere is characterized by the development of other convective cells.
- In well-developed phase, cirrus shields of single CB cells merge, leading to a very white smooth cloud shield in the IR and a somewhat transparent appearance in the VIS image.
|
Cb Cluster in Developing Stage
|
Cb Cluster in Mature Stage
|
|
|
In most cases Cumulonimbus clouds of considerable dimension exist within a group of smaller convective cells (see Meteorological physical background). In the mature stage the anvils of the large Cumulonimbus clouds extend downstream from the actual cells, which appear as a transparent grey to white layer in the IR image.
|
03 April 2006/12.00 UTC - Meteosat 8 IR 10.8 image
|
03 April 2006/12.00 UTC - Meteosat 8 VIS 0.6 image
|

|

|

|
|
|
03 April 2006/12.00 UTC - Meteosat 8 WV 6.2 image
|
|
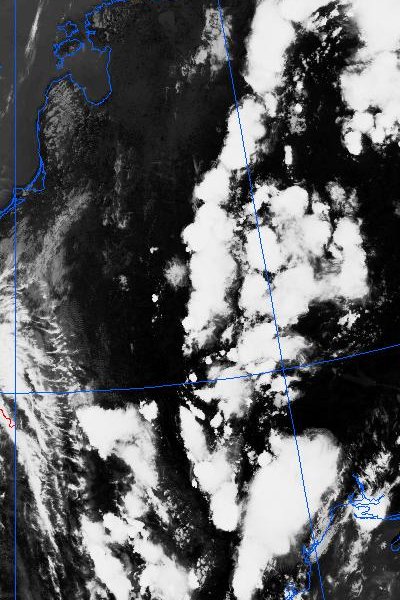
Satellite image shows clouds from Cold Front in Cold Advection and Cb Clusters in the Warm Air in front of it over Balkan Peninsula. Both Clusters, one over western Greece and another in eastern Croatia and Serbia can be seen in all three images. In IR image, only the Cbs in mature stage are pronounced, while in VIS it is quite difficult to make the distinction. In WV the Cb cluster is easily seen, especially when it is well developed like the one over Greece.
Appearance in Meteosat 8 HRVIS and RGB composite imagery
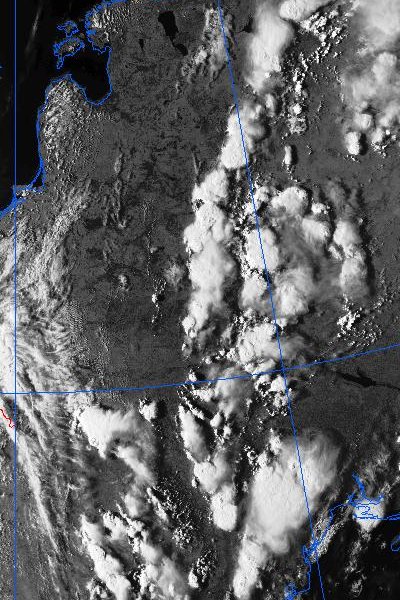
High resolution of Meteosat 8 HRVIS images makes smaller fine-scale cloud structures more distinct. The process of Cb Clusters developing into MCS over Slovenia and southern Austria can be nicely followed while multi-cell structure of the bigger system is much better visible.
|
03 April 2006/11.00 UTC - Meteosat 8 HRVIS image
|
03 April 2006/11.00 UTC - Lightning detection
|
|
|
To take into account and combine different types of information retrieved from SEVIRI imagery, such as optical thickness of clouds, particle size and phase, upper and mid level moisture and cloud top temperature, combinations of channels are constructed.
To observe daytime convection, Microphysical RGB VIS0.6, NIR1.6, IR10.8i is recommended. In this type of image, already at a very early stage the convection appears white to light pinkish, getting more pink as convection progresses; first icing can be spotted as magenta cores turning darker to become purple as ice particles grow.
|
02 August 2006/12.00 UTC - Meteosat 8 RGB (VIS0.6, NIR1.6 and IR10.8i) image
|
Cb Cluster as it appears in RGB VIS0.6, NIR1.6, IR10.8i imagery
|
|
|
Due to the dual character of NIR3.9 channel, similar information can be found in RGB VIS0.6, NIR1.6, NIR3.9.
|
02 August 2006/12.00 UTC - Meteosat 8 RGB (VIS0.6, NIR1.6 and NIR3.9) image
|
Cb Cluster as it appears in RGB VIS0.6, NIR1.6, NIR3.9 imagery
|
|

|
The best visual appearance of severe storms is given by so called Severe Convection RGB (WV6.2-WV7.3, NIR3.9-IR10.8, NIR1.6-VIS0.6). In this type of composite cold Cb tops with small ice particles appear in yellowish colours and well developed Cbs with large ice particles appear red. In cases of severe thunderstorms small particles or even water droplets can be brought up to the cloud top by strong updrafts appearing in satellite image much lighter than the environment. For that reason, overshooting tops can be easily identified in this RGB.
|
02 August 2005/12.00 UTC - Meteosat 8 Convective Storms RGB (WV6.2 -WV7.3, NIR3.9 -IR10.8 and NIR1.6 -VIS0.6) image
|
Cb Cluster as it appears in Convective Storms RGB
|
|

|
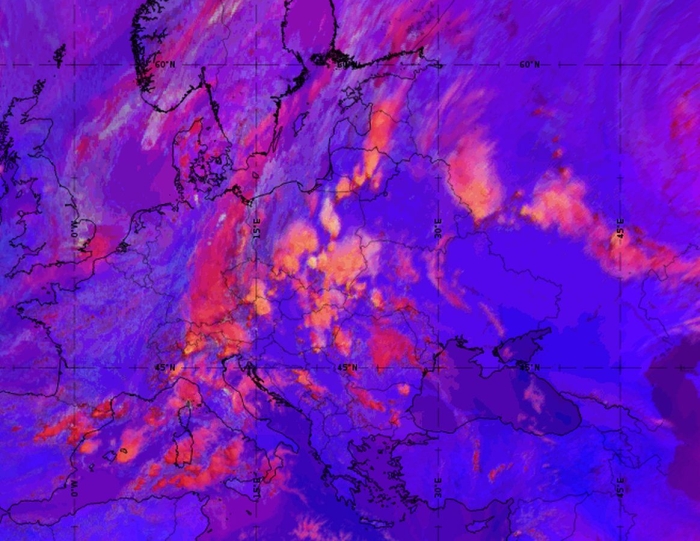
Although this composite is not aimed strictly for detection of convection, it can be seen in so called Night Microphysical RGB (IR12.0-IR10.8, IR10.8-NIR3.9, IR10.8). In this combination thick Cb clouds appear dark orange or red. In some parts of the clouds, namely growing parts, the colour is somewhat sprinkled, effect resulting from noise in channel NIR3.9.
|
02 August 2005/22.00 UTC - Meteosat 8 Night Microphysical RGB (IR12.0-IR10.8, IR10.8-NIR3.9 and IR10.8) image
|
Cb Cluster as it appears in Night Microphysical RGB
|

|
|
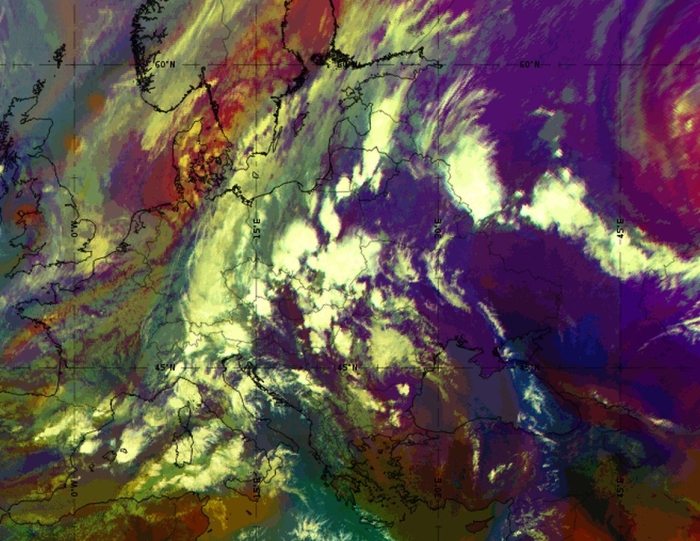
For night-time detection, Airmass RGB (WV6.2-WV7.3, IR9.7-IR10.8, WV6.2i) can also be used. Thick high level reaching Cb clouds appear white in this type of images. This is also a very good combination for early detection of convection. It can be seen that convective development takes place in the dark blue areas of moist lower and dry higher troposphere. Dry stratospheric air intrusion which enhances the instability and makes this area favorable for convection can be recognized by its red color.
|
02 August 2005/22.00 UTC - Meteosat 8 Airmass RGB (WV6.2-WV7.3, IR9.7-IR10.8 and WV6.2i) image
|
Cb Cluster as it appears in Airmass RGB
|
|
|
Combinations with HRVIS channel bring in the advantages of high spatial resolution. In the most used RGB composite of the high resolution visible (HRVIS,HRVIS,IR10.8i) cirrus anvils appear bluish and most intense convective development can be recognized by its pronounced light yellow, sometimes even white color. Due to the three times higher resolution, overshooting tops are clearly visible.
|
02 August 2006/22.00 UTC - Meteosat 8 High resolution RGB (HRVIS, HRVIS and IR10.8i) image
|
Cb Cluster as it appears in High resolution RGB
|
|

|
|
|
Airmass RGB (left) and Convection RGB (right) from 07 June 2020, 15 UTC
This example shows the advantage of the Convection RGB: while the Airmass RGB depicts high-level thick clouds in quite a uniform whitish tone, with only little distinction in colour, the Convection RGB depicts them in many different shades of orange and yellow. This even helps to provide a three-dimensional impression of the cluster. As the schematic of the Convection RGB shows, young convective cells appear very bright (whitish or bright yellow), growing cells are coloured orange and mature convective cells appear in an intense red colour.


Schematic Airmass RGB (left); Schematic Convection RGB (right)
Appearance in AVHRR imagery
- Cb Clusters are easy to detect with AVHRR images, as the better resolution helps to see the individual cells better.
- Combination image 124 is very powerful in showing these cells. As the cells grow and the cirrus anvils spread, the intensely white cores stay identifiable within the bluish cirrus filaments.
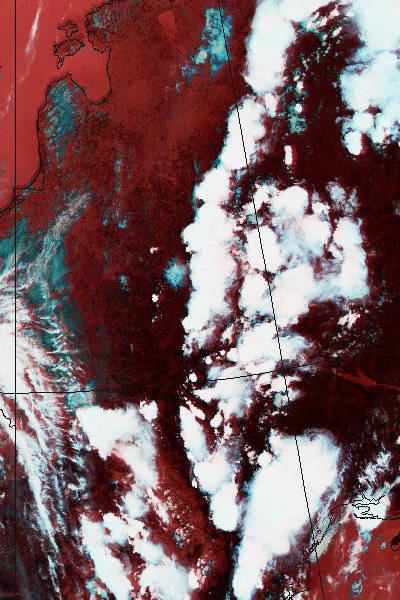
- 124 image combinations usually give a better visual appearance than daytime 345 image combinations due to better contrast between convective areas within the cloud and surrounding cirrus clouds. Cb Clusters are also very striking in 345 image combinations due to strong contrast between white clouds and dark red cloud-free land areas.
|
10 June 1999/15.01 UTC - NOAA RGB (channel 1, 2 and 4) image
|
10 June 1999/15.01 UTC - NOAA RGB (channel 3, 4 and 5) image
|
|
|
|
|
|
10 June 1999/15.01 UTC - NOAA CH2 image
|
10 June 1999/15.01 UTC - NOAA CH4 image
|
In the satellite images numerous separate well developed Cb cells are located over western Russia, White Russia and Ukraine (the northwestern corner of the Black Sea is located in the bottom right corner of each image, while Estonia is located in the top left corner).
The Cb cells can easily be identified as being mainly separate clouds systems. Some merging of the clouds is taking place just northwest of the Black Sea. The NOAA 124 images show the thick Cb cores within the surrounding bluish cirrus anvils. At the same time the Cb cells in the NOAA 345 images are very distinct white in otherwise reddish surroundings, but the details are partly lost due to the saturated whiteness everywhere within the cells.
Similar differences can also be seen in the individual VIS and IR images.
Meteorological Physical Background
Cb Clusters in Warm Air, which are the subject of this investigation, are mesoscale cloud phenomena with an average diameter of 200 km. Over
land they start to be generated when the surface temperature enhanced by insolation becomes sufficient to trigger convection. They dissolve
during night, and this is one of the main characteristics to differentiate them from MCSs which can exist during the night and even in the
morning. They appear most frequently in summertime over land, but they also emerge over the sea during the whole year, day or night. Cb
Clusters in Warm Air do not arise at the boundary of two air masses such as Fronts, but develop ahead of the Cold Front in the warm air of a
thermal ridge. Cb Clusters are often embedded in cellular low cloudiness of other types. In contrast to MCS, single Cbs are usually well
separated from each other allowing easy detection in radar images.
The synoptic environment shows great resemblance with that of an MCS (see
Cumulonimbus (Cb) and Mesoscale Convective System (MCS) - Meteorological Physical Background
). In fact, Cb Cluster is often a preliminary stage in the life cycle of an MCS.
|
Mature Stage of a Cb Cluster
|
MCS
|

|
|
Life cycle of a Cb Cluster in Warm Air
|
09 July 2006/10.45 UTC - Meteosat 8 HRVIS image
|
09 July 2006/12.45 UTC - Meteosat 8 HRVIS image
|

|

|
|
|
|
09 July 2006/17.00 UTC - Meteosat 8 HRVIS image
|
|
|
09 July 2006/10.00 UTC - Meteosat 8 HRVIS image; 10.00 UTC - 17.00 UTC quarter-hourly image loop
|
09 July 2006/10.00 UTC - Radar image; 10.00 UTC - 17.00 UTC quarter-hourly image loop
|
A life cycle of Cb Clusters can be seen in the example above. An individual cell started developing in central part of northern Croatia around noon local time (10UTC) on 09 July 2006. Soon, the other cells started to emerge and a cluster, which can be seen in 12.45 UTC image, was formed. This cluster, like many others appearing that day, decayed in the evening. In the same air mass a Cb Cluster in Western Austria, closer to the Cold Front approaching from Western Europe, experienced the full development from Cb cluster into an MCS. These complete life cycles are often observed in the areas close to the Cold Front where cold air advection at higher levels plays an important role.
A Cb Cluster developing into an MCS
|
03 April 2006/10.00 UTC - Meteosat 8 HRVIS image
|
03 April 2006/10.00 UTC - Meteosat 8 IR10.8 image with nowcasting product Convective Cell Detection
|
|
|
|
03 April 2006/11:45 UTC - Meteosat 8 HRVIS image
|
03 April 2006/11:45 UTC - Meteosat 8 IR10.8 image with nowcasting product Convective Cell Detection
|
|
|
|
03 April 2006/12:30 UTC - Meteosat 8 HRVIS image
|
03 April 2006/12:30 UTC - Meteosat 8 IR10.8 image with nowcasting product Convective Cell Detection
|
|
|
The above example shows the full life cycle of a convective system. In the unstable air of a thermal ridge, individual Cbs started to appear in southern Austria and Slovenia in the late morning hours of 03 April 2006, and around midday, as seen in the 10.00 UTC image, they already grew to become a well developed cluster. In the right column Meteosat 8 IR 10.8 satellite images with nowcasting product Convective Cell Detection overlaid can be seen. Nowcasting algorithm used in this investigation detects convective cells on the basis of their temperature and radius, with three temperature thresholds where blue cross indicates the cell with cloud top temperature lower than -33°C, yellow lower than -42°C and red lower than -50°C. It can be noticed that the cluster is developing quite rapidly taking about 4 hours to become a MCS covering the area of Slovenia, southern Austria and eastern Italy.
The environment favorable for the development of Cb Clusters
The favourable area for the development of Cb clusters is characterized by an unstable humid air mass.
|
Average of the min and max values of relative humidity
|
Average height of the min and max of relative humidity
|
|
|
As shown in the sketches, in most cases, relative humidity values in the lower layers are very high, indicating also big amount of precipitable water. In the investigated cases an average of about 30mm was found, with a dispersion of 10mm.
The average height of the potentially unstable layer is characterized by the more or less pronounced inversion of the potential temperature. In the investigated cases a common height of this inversion was 700 hPa.
|
03 April 2006/12.00 UTC - Meteosat 8 HRVIS image; position of vertical cross sections indicated
|
03 April 2006/12.00 UTC Radio Sounding Budapest
|
|
|
|
03 April 2006/12.00 UTC - ALADIN model vertical cross section A; grey shaded: wind speed, wind barbs: wind direction
|
03 April 2006/12.00 UTC - ALADIN model vertical cross section B; white: isentropes, blue and grey shaded: relative humidity
|
|
|
|
03-04 April 2006 - ALADIN model time vertical cross section for Budapest; black-dotted: LCL, blue: temperature and shaded: relative
humidity
|
03-04 April 2006 - ALADIN model time vertical cross section for Budapest; magenta: equipotential temperature, blue dashed: specific
humidity and green shaded: convectively unstable area
|
|
|
The only available radio sounding in the area of interest, Budapest, shows a pronounced very unstable and humid lower troposphere.
The area with high humidity is present in ALADIN model spatial cross section B and even more pronounced in the vertical time cross sections for Budapest. Furthermore, potential instability can be seen in the vertical distribution of isentropes. In time cross section, it can be clearly recognized as the area of backward inclined isentropes with values decreasing with height, sometimes even a closed isoline indicating the minimum in the level between 3 and 4 kilometers. Also, vertical wind shear in speed and direction, shown in spatial Vertical Cross Section A, is necessary for the development of thunderstorms (see Cumulonimbus (Cb) and Mesoscale Convective System (MCS) - Meteorological Physical Background , the Role of vertical wind shear).
Instability of the atmosphere is often described by different instability indices. In the description of this conceptual model the most common ones, Showalter Index, K Index and Boyden Index are used. Indices themselves may be misleading, and using them one must be aware that they give only an indication of the possibility for convective activity.
|
01 July 2005/18.00 UTC - Meteosat 8 IR10.8 image
|
01 July 2005/18.00 UTC - synop observations in the area of interest
|
|
|
|
01 July 2005/18.00 UTC - ECMWF model analysis field, Showalter index
|
01 July 2005/18.00 UTC - ECMWF model analysis field, Boyden index
|

|

|
|
01 July 2005/18.00 UTC - ECMWF model analysis field, K index
|
|

|
The unstable environment favourable for the occurrence of Cb clusters in Warm Air can be recognized by a thickness ridge (see Cumulonimbus (Cb) and Mesoscale Convective System (MCS) - Meteorological Physical Background ) and a ridge in the potential temperature
|
Environment favourable for development of convection, potential temperature and thickness field
|
01 July 2005/18.00 UTC - ECMWF model analysis field, equivalent potential temperature 850 hPa
|
|
|
|
|
|
01 July 2005/18.00 UTC - ECMWF model analysis field, equivalent thickness
|
|
The driving mechanism for development of Cbs in Warm Air is the surface heating. Differential heating of the earth surface causes the formation
of a trough in the surface pressure field which leads to convergence in the lower levels. This will certainly accelerate the development,
especially in moist areas.
Orographic effects in mountainous terrain also play an important role in this convergence mechanism.
|
Environment favourable for development of convection, surface trough and convergence zone
|
01 July 2005/09.00 UTC - ALADIN model forecast field, wind and geopotential 1000 hPa
|

|
|

|
|
|
01 July 2005/18.00 UTC - ALADIN model forecast field, divergence 1000hPa
|
01 July 2005/18.00 UTC - ALADIN model forecast field, divergence 850hPa
|
In most cases, warm advection in lower levels is almost negligible, as shown in the diagram. Nevertheless, cold advection at higher levels can contribute to the triggering of Cbs, especially during the preliminary stage of an MCS. In such cases a Warm Conveyor Belt in the lower levels in front of the Cold Front also plays a role in destabilizing the atmosphere.
|
Average values of temperature advection
|
Diagram showing Warm Advection in lower layers by Warm Conveyor Belt (WCB)
|
|

|
Key Parameters
- Equivalent Thickness
- Potential (Wet Bulb) Temperature at 850 hPa:
Indication of warm air mass - Low Level Divergence:
Areas of high convergence are preferable for convective development. - Instability indices:
Boyden index, Showalter index and K index
Equivalent thickness
CB Clusters in Warm Air can be found in the large area of South-Eastern Europe, particularly over Bulgaria and Ukraine. They developed, as usually, in the thickness ridge or within a zone of high gradients of equivalent thickness (see Cumulonimbus (Cb) and Mesoscale Convective System (MCS) - Key Parameters ).
|
04 August 2005/18.00 UTC - Meteosat 8 IR10.8 image
|
04 August 2005/18.00 UTC - synop observations in the area of interest
|
|

|
|

|
|
Environment favourable for development of convection, equivalent thickness ridge
|
04 August 2005/18.00 UTC - ECMWF model analysis field; green: equivalent thickness
|
Potential Temperature at 850 hPa
CB clusters in Warm Air develop in a tongue of high values of Equipotential or Potential Temperature at lower levels.
|
Environment favourable for development of convection, Potential Temperature (ThetaW) at 850 hPa
|
04 August 2005/18.00 UTC - ECMWF model analysis field; cyan: equipotential temperature 850 hPa
|

|

|
Convergence
Areas favourable for development are signified by minimum values of divergence in lower layers due to differential heating and/or orography.
|
Environment favourable for development of convection, Low Level Divergence
|
04 August 2005/18.00 UTC - ECMWF model analysis field; magenta: Divergence 925 hPa
|
|
|
Instability Index
For indication of unstable areas instability indices are used. The most common one, exploited also in this manual is the Showalter Index. The area with high probability of development of thunderstorms is the area with Showalter index values below 3 units. Some other indices, such as K Index or Boyden index can be used. Values of Boyden Index greater than 95 indicate an increased chance of developing thunderstorms.
|
Environment favourable for development of convection, Boyden Index
|
04 August 2005/18.00 UTC - ECMWF model analysis field; orange: Boyden Index
|

|
|
Some Supporting Parameters
- Relative humidity at different levels, particularly 700 hPa - existence of moisture is a necessary condition for the formation of clouds
- Warm conveyor belt (see Meteorological Physical Background)
Numerical model parameters in vertical cross section
The importance of the vertical structure of the atmosphere in connection to instability is described in more detail in the next chapter with special attention paid to vertical distribution of:
- Isentropes
- Humidity
(See Typical appearance in the vertical cross sections).
Different Detection and Observation Methods
For early detection of convective cells and diagnostics of the behaviour of the forecasting model, different station observations and remote sensing data are used.
Radio sounding is a very effective tool to obtain information about the stability of the atmosphere depicting the lapse rate of the temperature
and the vertical distribution of moisture.
|
09 July 2006/12.00 UTC - Meteosat 8 HRVIS image
|
09 July 2006/12.00 UTC - Radio sounding Zagreb
|

|
|
|
|
|
09 July 2006/12.00 UTC - Radar Image
|
09 July 2006/12.00 UTC - Meteosat 8 IR10.8 image with nowcasting product Convective Cell Detection
|
Thunderstorm reports from surface observations are quite useful, but in some cases they cannot cover an entire cluster area, therefore lightning reports from a detection system are more useful.
Furthermore, radar images are essential in diagnosing the strength of a Cb Clusters in terms of precipitation amount and dangerous weather events like wind gusts, heavy hail or downbursts (see "Radar" in Cumulonimbus (Cb) and Mesoscale Convective System (MCS) - Key Parameters ).
On the bases of radar and satellite images more and more nowcasting tools are developed. Nowcasting algorithm used in this investigations (Convective Cells Detection in the image above) detects convective cells on the basis of their top temperature and radius, with three temperature thresholds where blue cross indicates the cell with cloud top temperature lower than -33°C, yellow lower than -42°C and red lower than -50°C.
The height of the cloud top is a good indication of the potential activity of the cell. Besides radar derived data, cloud top temperatures can be retrieved from IR images. The estimated top height is computed using the IR temperature and the temperature height profile derived from the nearest available radio sounding. In the diagram shown below, the average cloud top height in the early studies for this manual is 275 hPa (with dispersion about 100 hPa) lying just below the mean value of the tropopause height.
Typical Appearance In Vertical Cross Sections
Cumulonimbus Clusters can develop in an area where vertical distribution of (potential) temperature and humidity is conditionally unstable. This is fulfilled when equipotential temperature decreases with height. The middle and upper troposphere is generally stable or adiabatic, which means that potential temperature increases or does not change with height. Therefore, for equipotential temperature to decrease with height, the humidity content must decrease significantly. That is usually the case with maritime air masses carrying relatively warm and moist air.
|
Vertical distribution of humidity in the environment favourable for development of convection
|
Vertical distribution of (equi)potential temperature in time or space vertical cross sections in the environment favourable for
development of convection
|

|

|
Nevertheless, this does not necessarily mean that the convection will occur. A strong inversion can prevent cumulus clouds from feeding with the moisture in the lower levels.
Stability can change with additional ground heating, hence convection happens more often in summer situations. Furthermore, vertical motion can be enhanced in vicinity of the mountain chains. All of this explains why the Southeastern Europe with combination of the Mediterranean water pool and Dinaric Alps is a preferable area for convective developments.
The WV images show the initial stage of convective development in the prefrontal spring situation in the region of Dinaric Alps, a grey to dark grey area in which the first white Cb spots are visible. The ALADIN model forecast vertical cross section shows a very moist layer below approximately 2km and very dry air aloft. In the ALADIN HRID time cross section made for Sarajevo (43.82N, 18.33E) the convectively unstable lower atmosphere is indicated. The equipotential temperature is decreasing with height up to 3km of height, where the closed isolines are found.
|
03 April 2006/09.00 UTC - Meteosat 8 WV 6.2 image; position of vertical cross section indicated
|
03 April 2006/09.00 UTC - Meteosat 8 WV 7.3 image; position of vertical cross section indicated
|
|
|

|
|
|
03 April 2006/09.00 UTC - ALADIN model vertical cross section; blue and grey, shaded: relative humidity (%), white isolines:
isentropes (K)
|
03 - 04 April 2006 - ALADIN HRID vertical time cross section; magenta: equipotential temperature (K), green shaded: convectively
unstable areas
|
In a typical summer anticyclonic situation in Croatia and Bosnia and Herzegovina, convergence in lower levels is visible in the surface wind field. A cross section is an ideal tool to detect these areas.
|
09 July 2006/15.00 UTC - Meteosat 8 HRVIS image; position of vertical cross section and convergence areas indicated
|
09 July 2006/15.00 UTC - ALADIN model 10m wind (m/s); convergence areas indicated
|
|

|
|
|
|
Vertical distribution of divergence in the environment favourable for development of convection, Minimums indicating the areas of
high convergence
|
09 July 2006/15.00 UTC - ALADIN model vertical cross section; shaded: divergence (10-5 s-1)
|
Weather Events
| Parameter | Description |
| Precipitation (incl. thunder) |
|
| Temperature |
|
| Wind (incl. gusts) |
|
| Other relevant information |
|
|
|
03 April 2006/12.00 UTC - Meteosat 8 HRVIS image
|
03 April 2006/12.00 UTC - Synop observations in the area of interest
|
|

|
|

|
|
03 April 2006/12.00 UTC - Radar image, reflectivity in dBz
|
03 April 2006/12.00 UTC - Radar image, Rain hourly accumulated precipitation in mm
|
The Sandwich Product combines a high-resolution visible band with a colour-enhanced infrared image. The visible band contributes the "morphology", and hence 3D structure, to the product. The infrared image adds cloud top temperature distribution information (through the colour enhancement) and enables an estimation of the maturity and severity of a storm. Of course, not only convection is colour enhanced, but also any cloud that is cold enough: this could also include the thick cold clouds of a front, or jet stream cirrus clouds. Unfortunately, the Sandwich product is only available during daytime (visible channel), but this disadvantage is relatively small, because most convective activity occurs during the daytime, especially over land.
Sandwich Product from 07 June 2020, 15 UTC
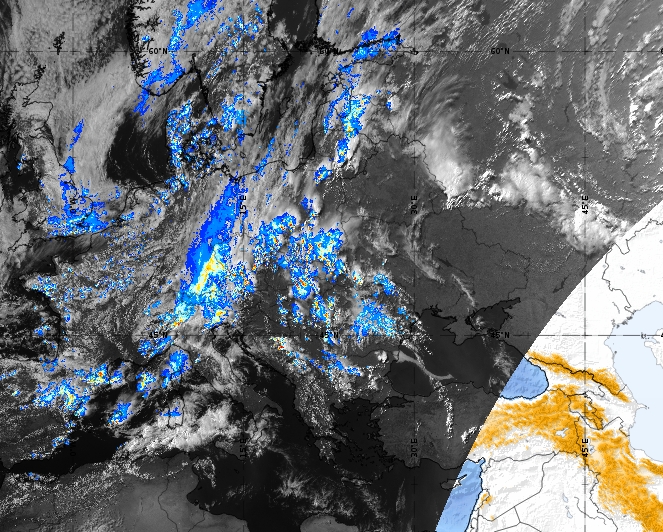
The Convective Rainfall Rate product demonstrates the potential rainfall rate due to convection. This product emphasizes high-ranging buoyancy and shows the highest rainfall rates where the clouds are highest and thickest (strongest updrafts).
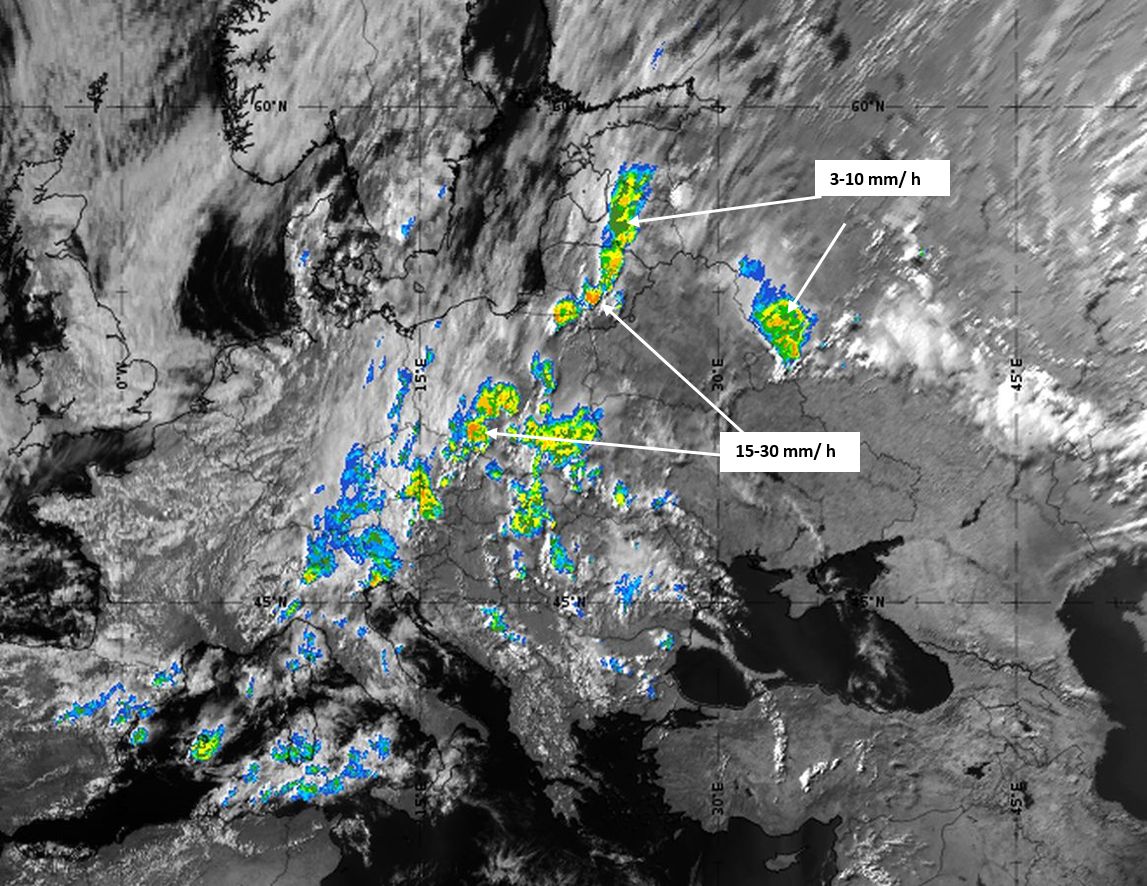
Convective Rainfall Rate from 07 June 2020, 15 UTC
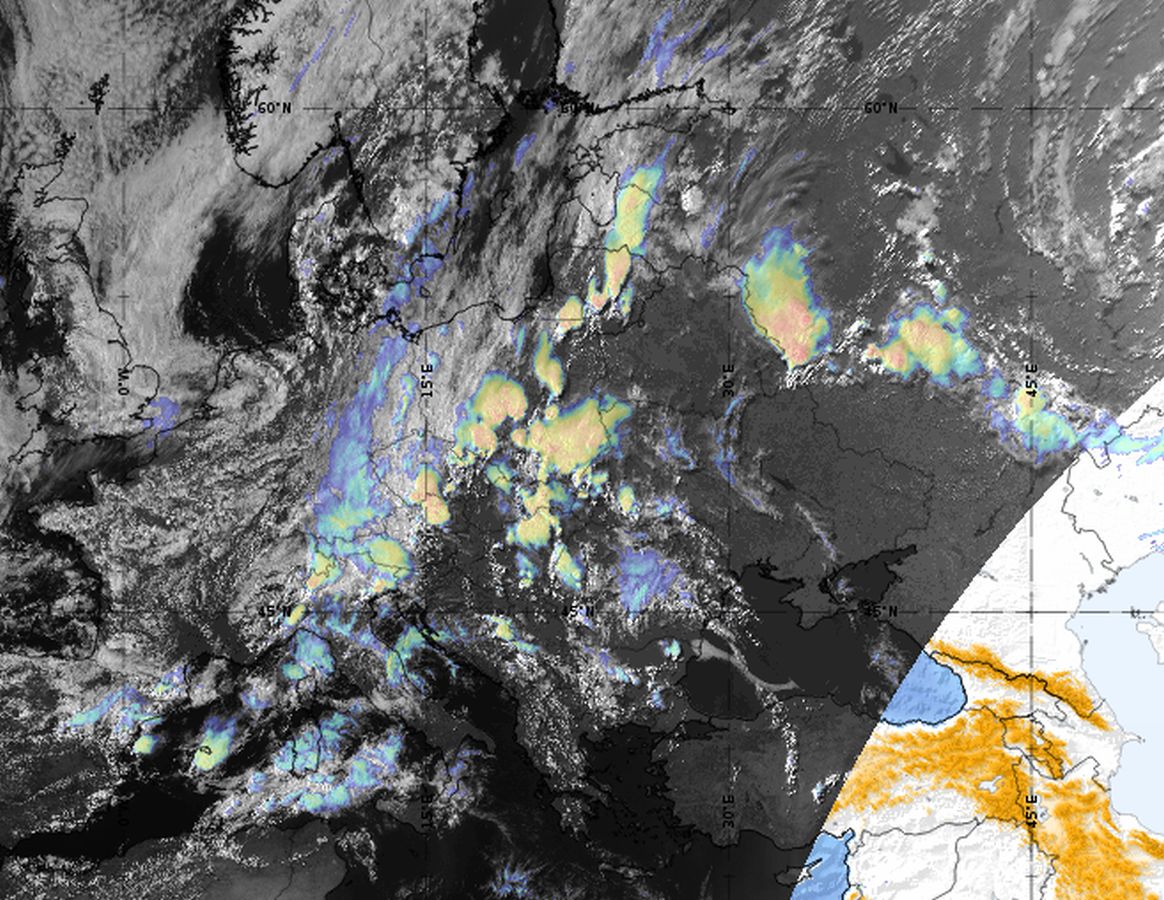
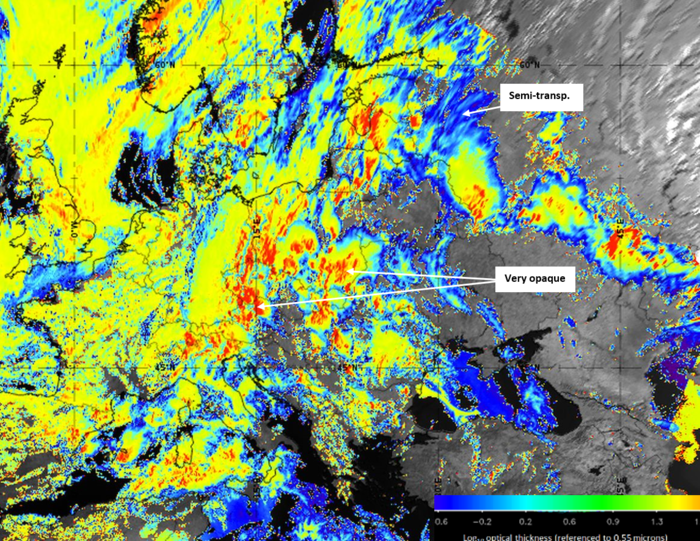
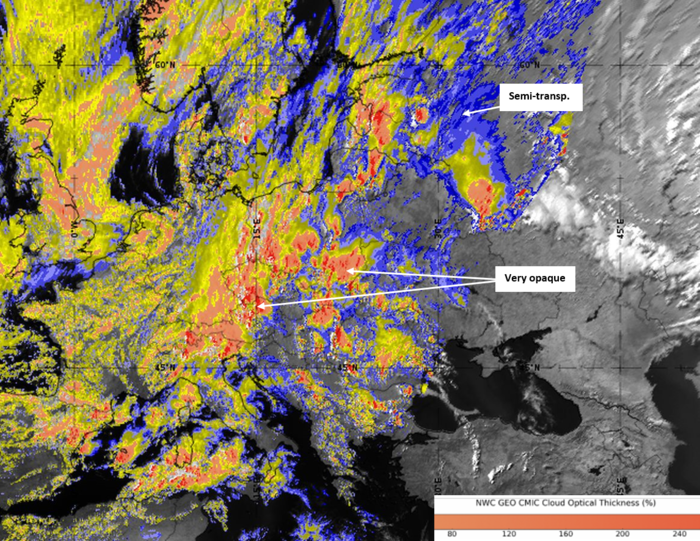
Products that show the cloud optical thickness (Optimal Cloud Analysis (OCA) Cloud Optical Thickness product and Cloud Optical Thickness product) are a useful tool for emphasizing the cellular structure of convective systems.
|
|
OCA Cloud Optical Thickness product (left) and Cloud Optical Thickness product (right) from 07 June 2020, 15 UTC
The Cloud Top Height product is a good instrument to filter the highest regions and cloud tops within a cluster:
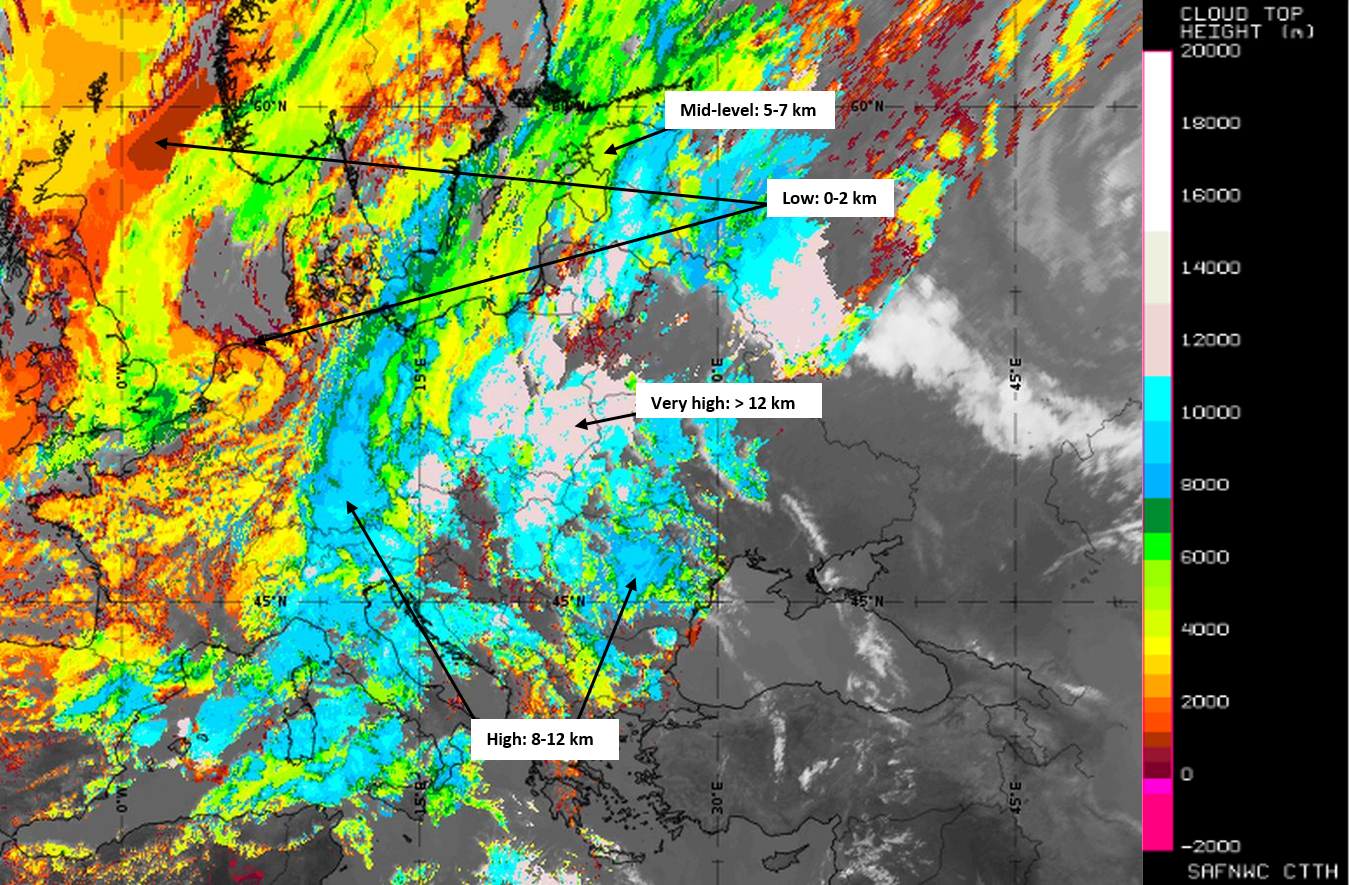
Cloud Top Height product from 07 June 2020, 15 UTC
Opera Radar Observation from 07 June 2020, 15 UTC
The actual radar scan measurement shows high reflectivity values where clouds are opaque and dense and where the Convective Rainfall Rate product shows strong signals.
References
General Meteorology and Basics
- CONWAY B. J., GERARD L., LABROUSSE J., LILJAS E., SENESI S., SUNDE J. and ZWATZ-MEISE V. (1996): COST78 Meteorology - Nowcasting, a survey of current knowledge, techniques and practice - Phase 1 report; Office for official publications of the European Communities
- LILLY D. K. (1986): Instability; in: Ray P. (ed.): Mesoscale Meteorology and Forecasting; American Meteorological Society, p. 259 - 271
- SHOWALTER A. K. (1953): A Stability Index for Thunderstorm forecasting; Bull. Amer. Met. Soc., Vol. 34, No. 6, p. 250 - 252
General Satellite Meteorology
- BADER M. J., FORBES G. S., GRANT J. R., LILLEY R. B. E. and WATERS A. J. (1995): Images in weather forecasting - A practical guide for interpreting satellite and radar imagery; Cambridge University Press
Specific Satellite Meteorology
- BENNETTS D. A., MCCALLUM E. and GRANT J. R. (1986): Cumulonimbus clouds: an introductory review; Met. Mag., Vol. 115, p. 242 - 256
- BROWNING K. A. (1962): Cellular structure of convective storms; Met. Mag., Vol. 91, p. 341 - 350
- BROWNING K. A. and LUDLAM F. H. (1962): Airflow in convective storms; Quart. J. R. Meteor. Soc., Vol. 102, p. 499 -533
- SCOFIELD R. A. (1990): The "Water Vapour Imagery/Theta E Connection" with Heavy Convective Rainfall; in: EUMETSAT Proceedings of the Workshop on the Use of Satellite Data in Nowcasting and Very Short Range Forecasting; Reading, U. K., 16 - 20 July 1990, p. 173 - 178