Table of Contents
Introduction
Combining satellite images from different channels goes far back in the history of satellite meteorology. The idea behind it can be summarized as follows:
Different channels give different information, and the combinations of channels reveal more information and features of the Earth's surface and atmosphere than single channels alone.
There are two ways of making better use of satellite images:
- Enhanced satellite images
- RGB presentation (Red Green Blue)
Looking back at the history of satellite meteorology, the first enhanced images were generated for severe convection like MCS (Mesoscale Convective Systems) to reveal the coldest cloud tops and the growing rate of these cold tops. The first RGB combinations were developed for the USA's polar orbiting satellites and the first application was discriminating low clouds from middle and high clouds.
As time passed, a large number of different RGB products were developed by various institutes and weather services. The usefulness of some combinations was sometimes questionable and comparison between different RGBs became difficult.
With the creation of the MSG and its 12 channels, each with its own unique qualities, a series of standardized RGBs were developed. These RGBs will be described according to their significance and usefulness.
Basic ideas behind enhanced satellite images
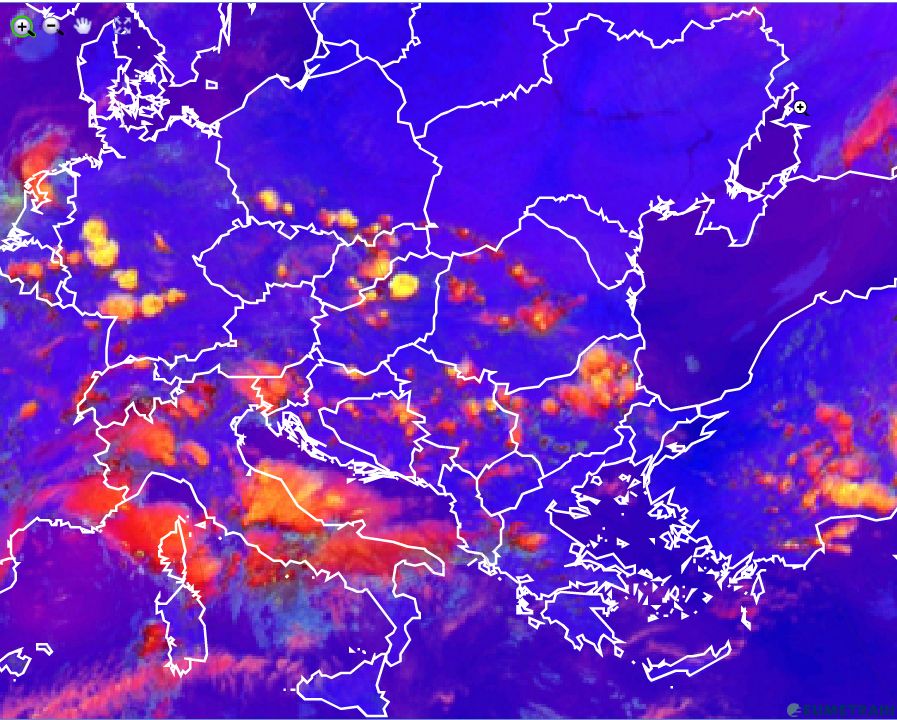
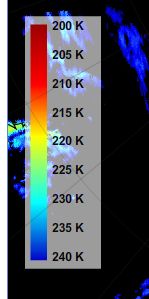
This application typically uses IR images that represent cloud top temperatures. Different colors are assigned to specific temperature ranges.
The following example presents the same case as the one that was already used for the basic channels - a winter case. The coldest temperatures can be found in the cloud tops of a warm front shield; the high cloud fibers at the rear of the cold frontal cloud band are also enhanced by the corresponding colors.
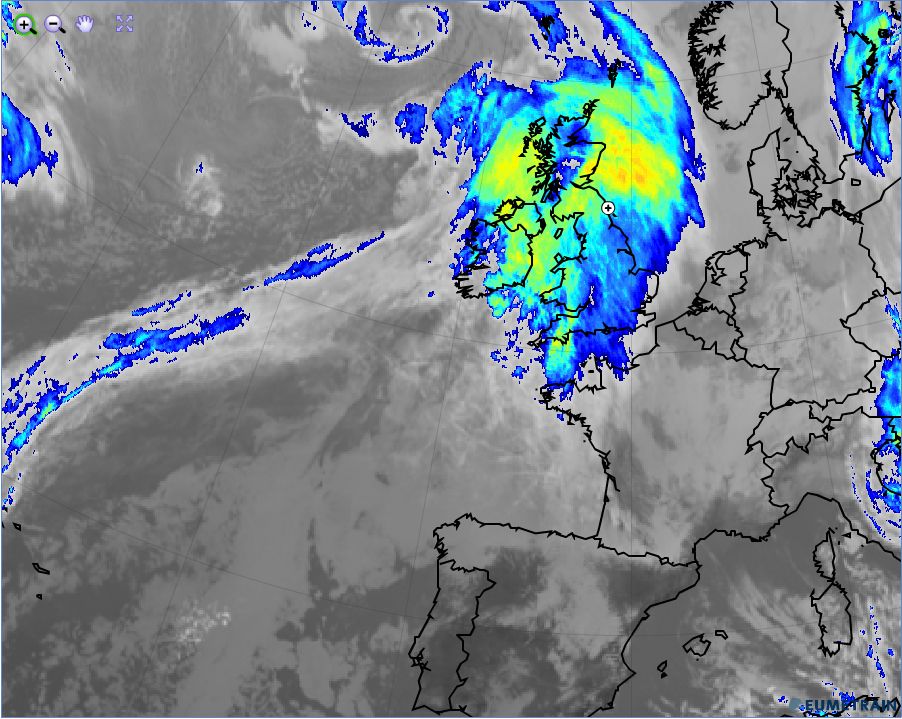
However, enhanced IR images are especially useful for convective cloud systems; a summertime example with an unstable situation is shown in the case below. Beyond simply coloring the coldest clouds, enhanced IR images reveal structures typical for convective cells and systems like cold rings, warm cores, U/V structures and overshooting tops much more easily than basic channels alone would.

Basic idea behind RGBs
The three colors red, green and blue are allocated for three MSG channels or, if appropriate, channel differences. All other colors are generated as a combination of these three basic colors. The choice between channels and channel differences depends on the features that are being looked for.
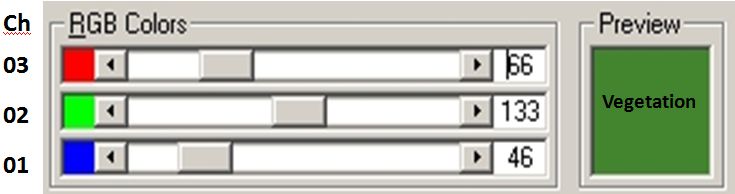
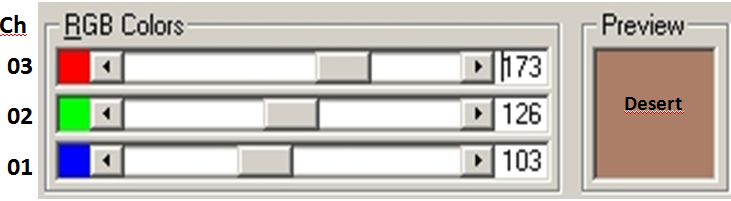
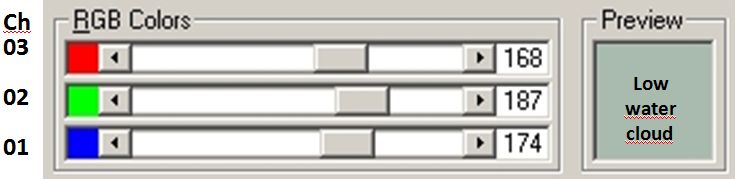
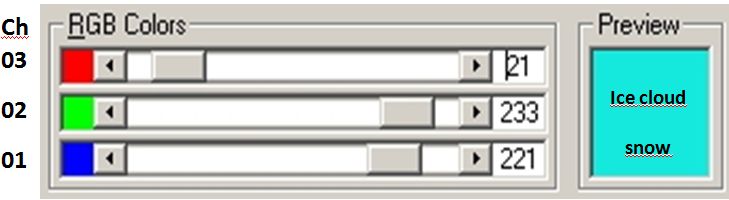
This shall be demonstrated with the so-called Natural Color RGB, which is composed from the channels 03 (R), 02 (G) and 01 (B). Each of these three visible channels contains information about reflected sunlight (and consequently the optical thickness of clouds), but each channel also adds its own physical specialty:
Ch 03 (1.6 µm): particle phase and size (water, small and bigger ice droplets)
Ch 02 (0.8 µm): "greenness" of vegetation
Ch 01 (0.6 µm): optical thickness
The next figure shows the resulting colors for four typical features in the "Natural Color RGB"
When using RGBs, it is important to understand which qualities the individual channels or channel differences provide.
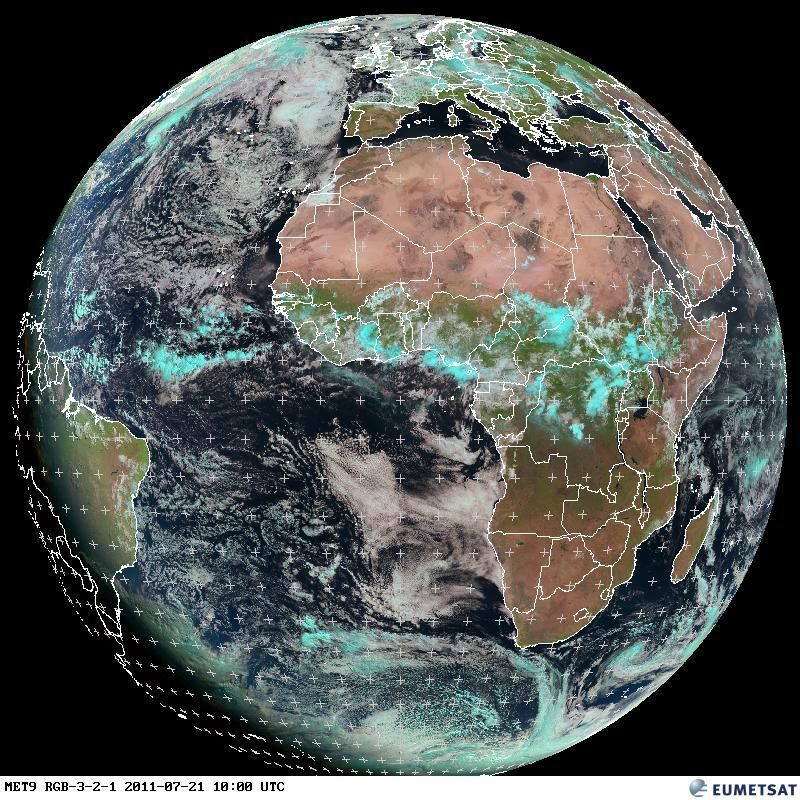
The Natural Color RGB
Information received from the three channels that contribute to the RGB combination
Resulting colors for typical features
Typical application areas
- First impression of the large scale weather
- Differentiation of water and ice clouds
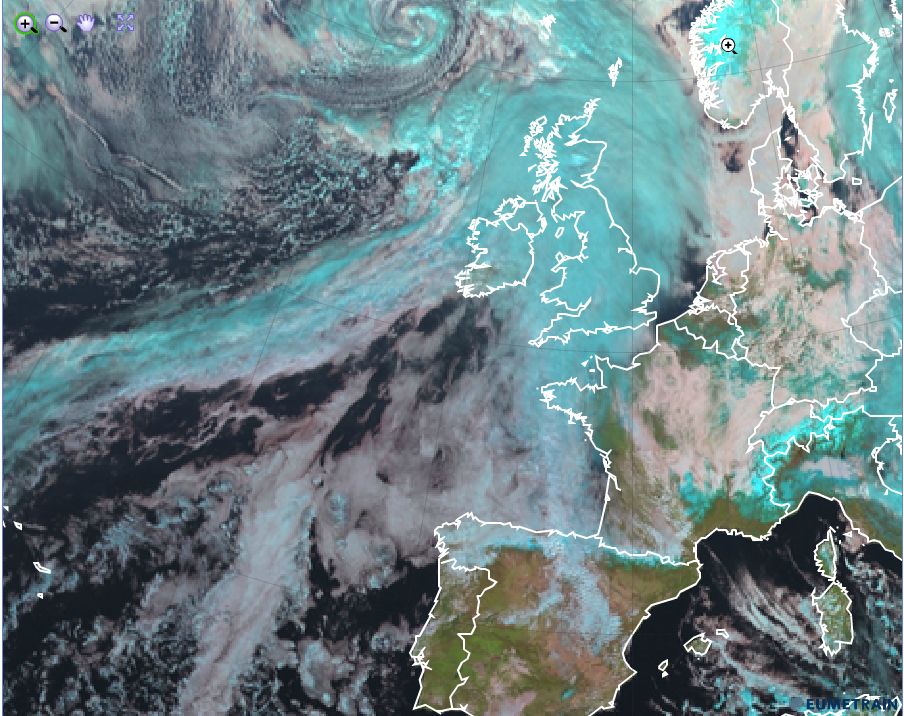
The High Resolution VIS (HRVis) RGB
Information received from the three channels that contribute to the RGB combination
Resulting colors for typical features
Typical application areas
- Discrimination of cloud systems of different vertical extent
- Recognition of small-scale structures, especially in convective and low clouds/fog
This RGB is very useful for convective systems, as it lets us tell the thick Cb kernel apart from the thin high Cirrus anvil, as well as recognizing the overshooting tops. A convective summer case is presented below:
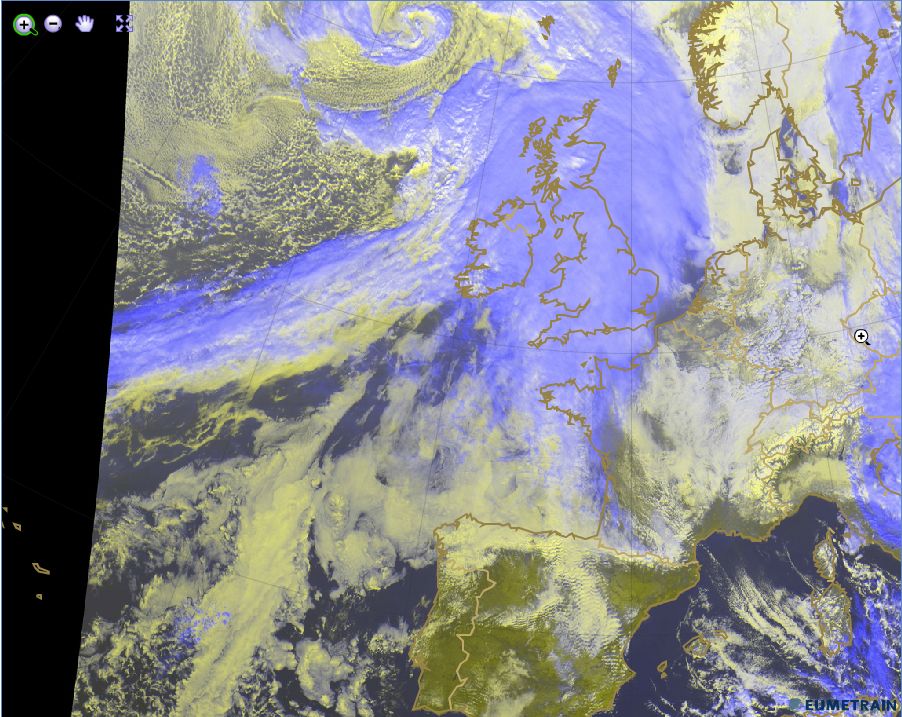
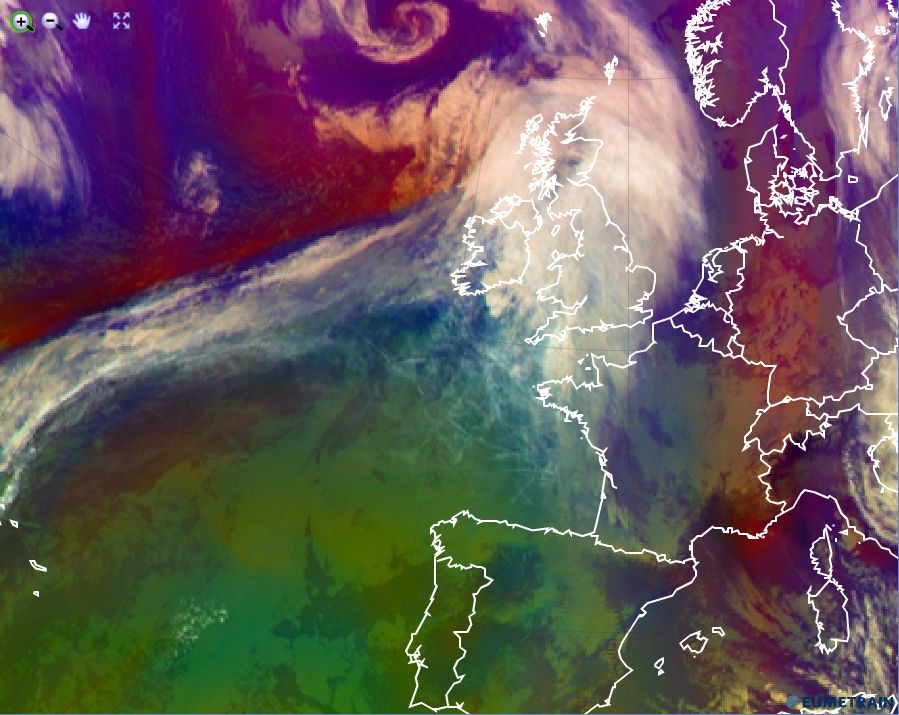
The Airmass RGB
Information received from the three channels that contribute to the RGB combination
Resulting colors for typical features
Typical application areas
- Differentiation between cold and warm air masses (blue - green)
- Recognition of very dry air that has descended from the stratosphere (dark brown)
- Dynamical features: tropopause folding; high PV values
Due to the incorporation of water vapor and ozone channels, the Airmass RGB's usage at high satellite viewing angels is limited.
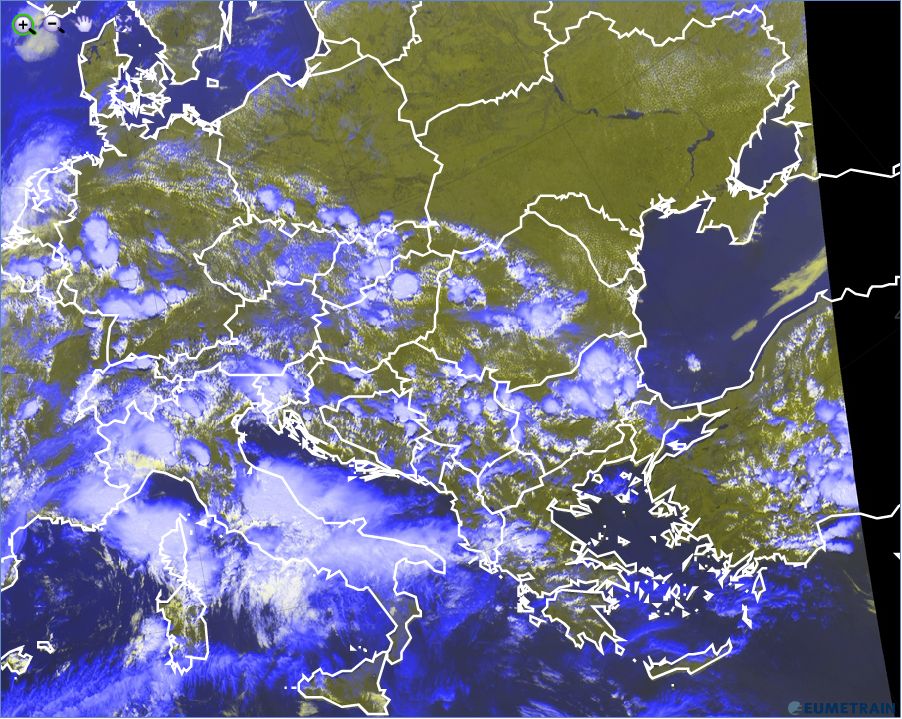
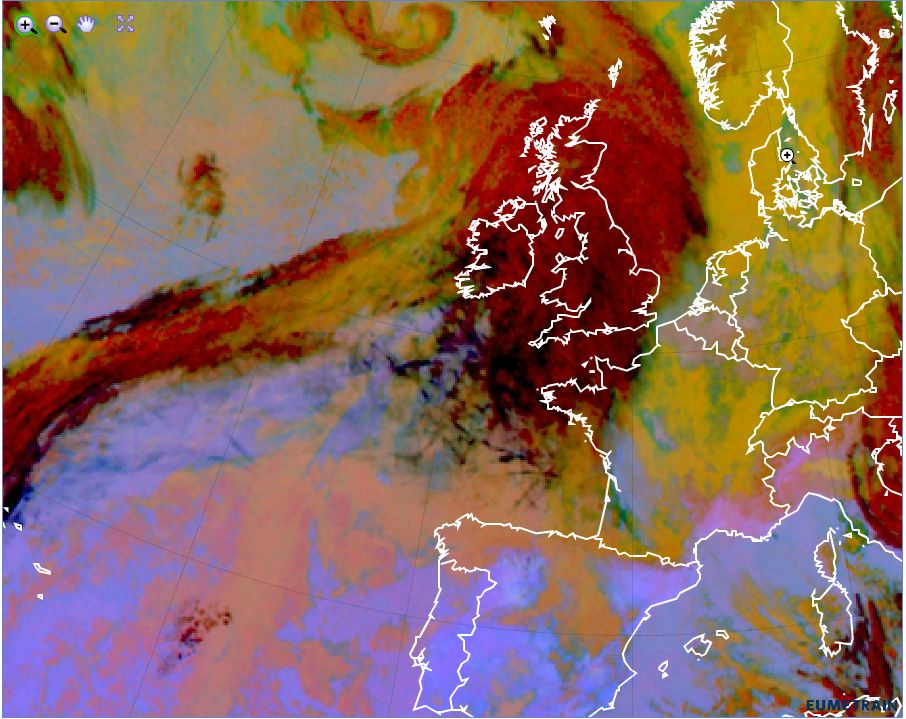
The Dust RGB
Information received from the three channels that contribute to the RGB combination
Resulting colors for typical features
Typical application areas
- Detection of synoptic, mesoscale and local cloud systems
- Discrimination of different cloud systems and cloud thicknesses (thick - high thin - low cloud)
- Detection of sand storms
- Detection of SO2 plumes from volcanoes
The Day Microphysics RGB
Information received from the three channels that contribute to the RGB combination
Resulting colors for typical features
Typical application areas
- Convection
- Fog and low cloud
- Fire (contribution from channel 04)
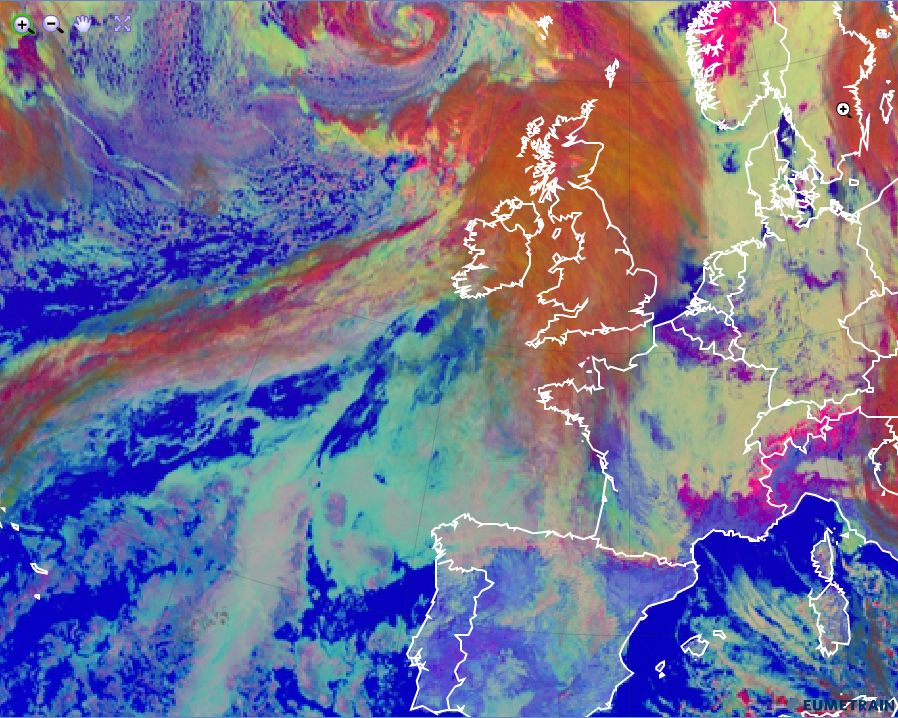
The 24-Hour Microphysics RGB
Information received from the three channels that contribute to the RGB combination
Resulting colors for typical features
Typical application areas
- Synoptic scale and mesoscale cloud systems: convection
- Similar to Dust RGB
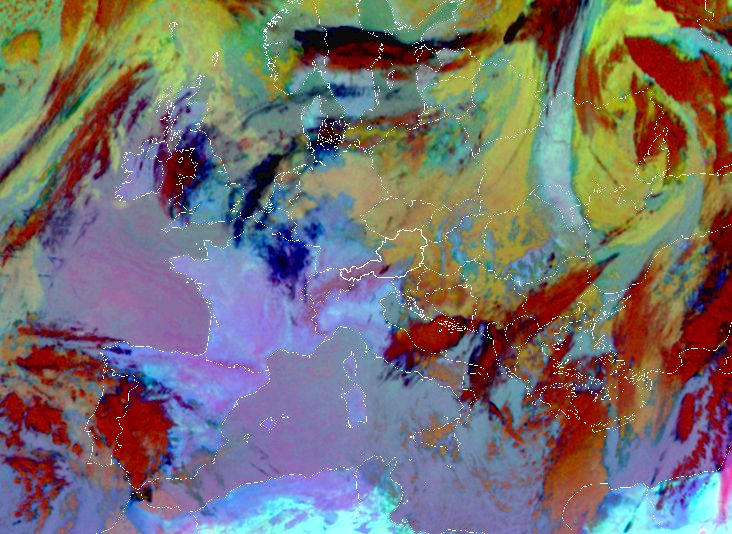
The Severe Storm RGB
Information received from the three channels that contribute to the RGB combination
Resulting colors for typical features
Typical application areas
- Convective cells
- Detection of severe storm centers