Chapter V: Stability analysis
Table of Contents
- Chapter V: Stability analysis
- Stability analysis
Stability analysis
Generally speaking the forecasters already knew about the potential of severe weather that morning. The difficulty was to estimate its development as well as the potential of prefrontal activity. For this reason there are several tools to make conclusions. The probably most common methods is looking at stability indices derived from radio soundings. But those indices have one striking disadvantage. They can only be calculated every few hours (depending on the meteorological station), but in the mean time the air masses can be modified. Within the last few years a new product has been launched which also includes satellite data. Thus a better spatial and temporal coverage can be derived. For this case study, we will take use of two different products: GII and SAI
GII (Global Instability Index) is a product from EUMETSAT that describes the air mass stability using several parameters. The product is only available in areas of clear atmosphere, so cloudy areas are excluded. The GII-values are able to indicate the potential for convection a few hours prior to the actual onset of convection.
SAI (Stability Analysis Imagery) was developed in Spain by AEMET. Basically it is doing the same observation like GII. Among all potential indexes the Lifted Index (LI) hast been implemented and codified.
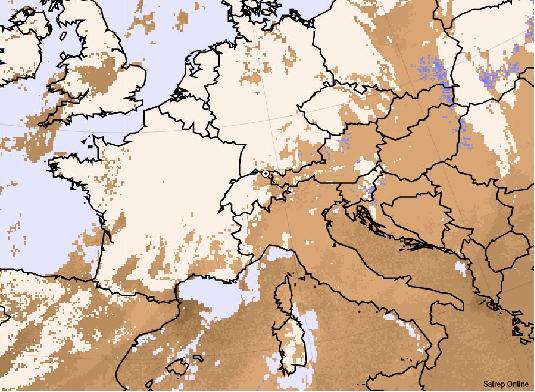
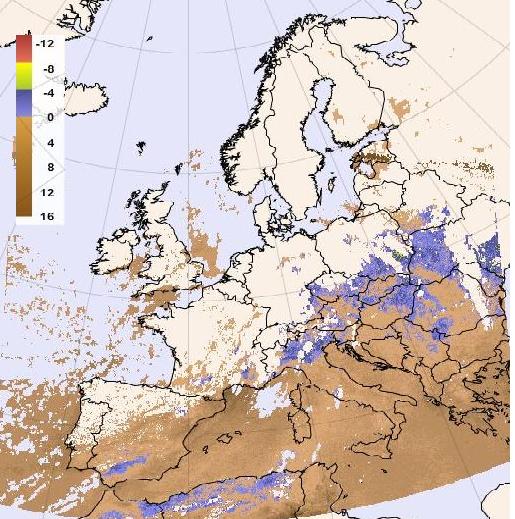
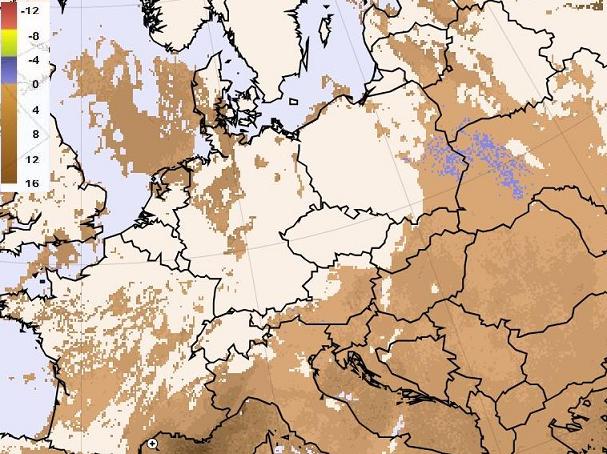
Figure 16: 06 UTC: (upper image GII, below SAI)
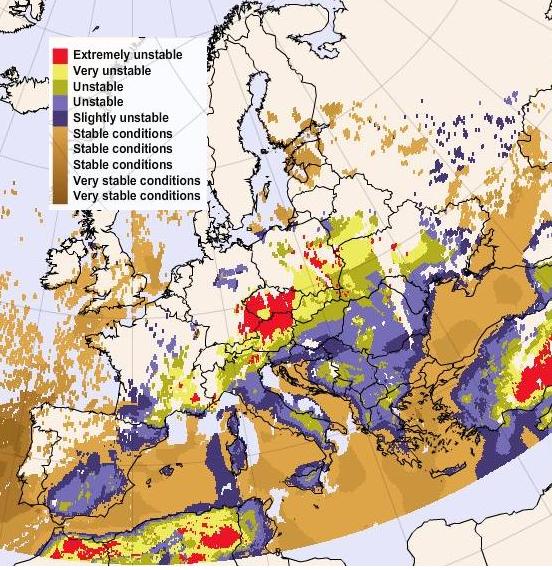
6 hours later the situation has slightly changed and there is a very unstable area in the North of lower Austria(yellow area). In the Czech Republic there is a broad unstable zone and in the North you can even detect extremely unstable spots.
Figure 17: 12 UTC: (upper image GII, below SAI)12 UTC:
At 12 UTC the stratification has changed and there is a broad extremely unstable zone in the North of Austria and the Czech Republic. In the western and southern parts of Austria there is also unstable stratification dominating. Unfortunately it is not possible to get the same information with the SAI-product. As the colour-schemes of both images are designed for the same stability values, it indicates that the GII gives a better analysis.
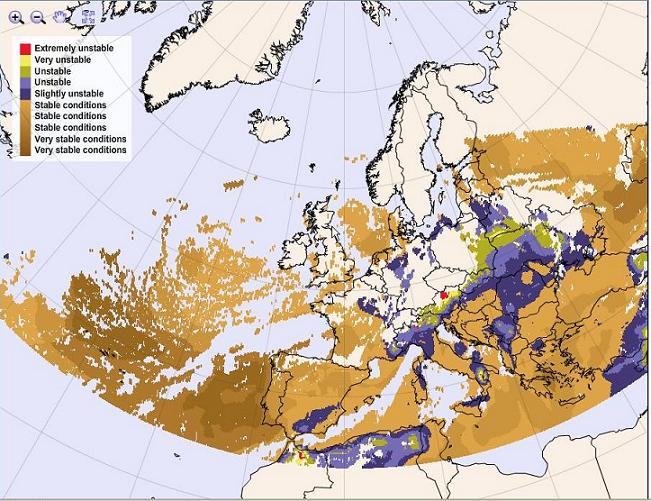
Figure 18: 18 UTC: (upper image GII, below SAI)
Although the cold front is still situated over Switzerland at 18 UTC, in Austria the zone of unstable stratification has decreased. Here must be mentioned that GII and SAI are calculated using only the Lifted Index. In Contrast the CAPE at 18 UTC shows values about 1650 J/kg. The high potential results especially from the upper level stratification. Besides in many parts of the Austria initial thunderstorms have already released energy. The same situation can be observed in the south regions of the Czech Republic.

