Chapter VII: Precipitation Surface observation
Table of Contents
- Chapter VII: Precipitation Surface observation
- Precipitation Surface observation
Precipitation Surface observation
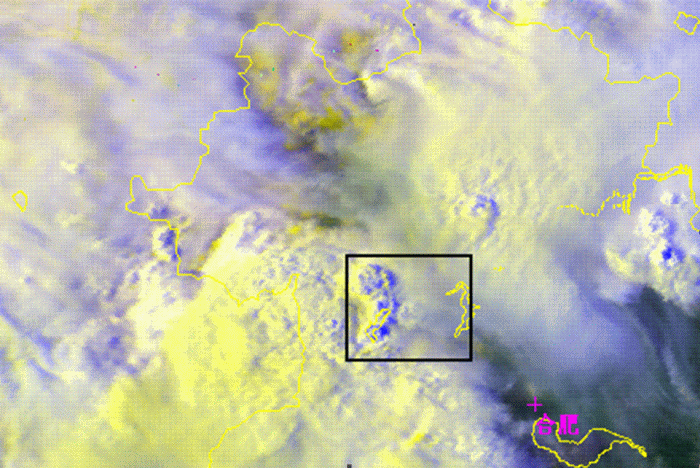
Figure 19: FY-1D Combination image(RGB 123) at 08:17(Black rectangle: following convective cloud area)
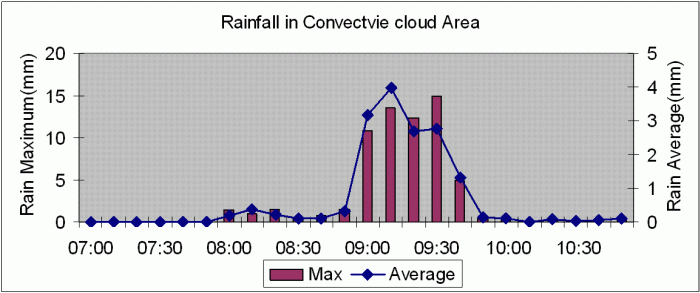
Figure 20: Rainfall Temporal variability form 7:00 to 10:50 in Convective Cloud Area
Figure present the temporal variety of rainfall from 7:00 to 10:50 in convective cloud area. A sharp peak change of maximum and average were shown from 08:40 to 09:40. The heavy rain were occurred after the merging of cells, because the 3 small cells were merging form 8:15 to 8:30 as radar image shown.

