Chapter III: Synoptic Development
Table of Contents
- Chapter III: Synoptic Development
- Synoptic Development
- February, 10th 2010
- February, 11th 2010
- February, 12th 2010
Synoptic Development
The surface charts and the infrared satellite images from 8 - 12 February 2010 give an overview of the shifting of the Mediterranean low during the five days.
Figure 3.1: ECMWF Surface chart 8 February 2010 1800UTC - 13 February 2010 0000UTC
Figure 3.2: Meteosat 9 IR10.8: 10 February 2010 0000UTC to 12 February 23:30UTC
The development of the depression started in Spain. The trough moved in the direction of the upper air flow eastward to Italy within two days. Because of the blocking situation over Europe the trough remained almost constant over Italy between Feb, 10th and Feb, 11th. During the night from Feb, 11th to 12th the corresponding occlusion dissipated and a new front system was formed over Sicily, because of anew cold air advection from an upper level low over the Mediterranean Sea. But this frontal system did not influenced Austria, because on Feb, 12th 2010 the depression weakened and moved further to the east toward the Balkan.
To discuss the weather event in more detail, concentration on the important days is necessary!
February, 10th 2010
The ECMWF analysis gives an overview of the weather situation on Feb, 10th 2010 at 18 UTC (initial position: Feb, 10th 2010 / 00 UTC).
The general weather situation, the blocking position with the high over the North Atlantic and the two troughs - one over the East Atlantic and one over almost whole Europe - did not change much. The surface low over Italy was well developed and the corresponding front system brought the first snowfall in Carinthia and Styria.
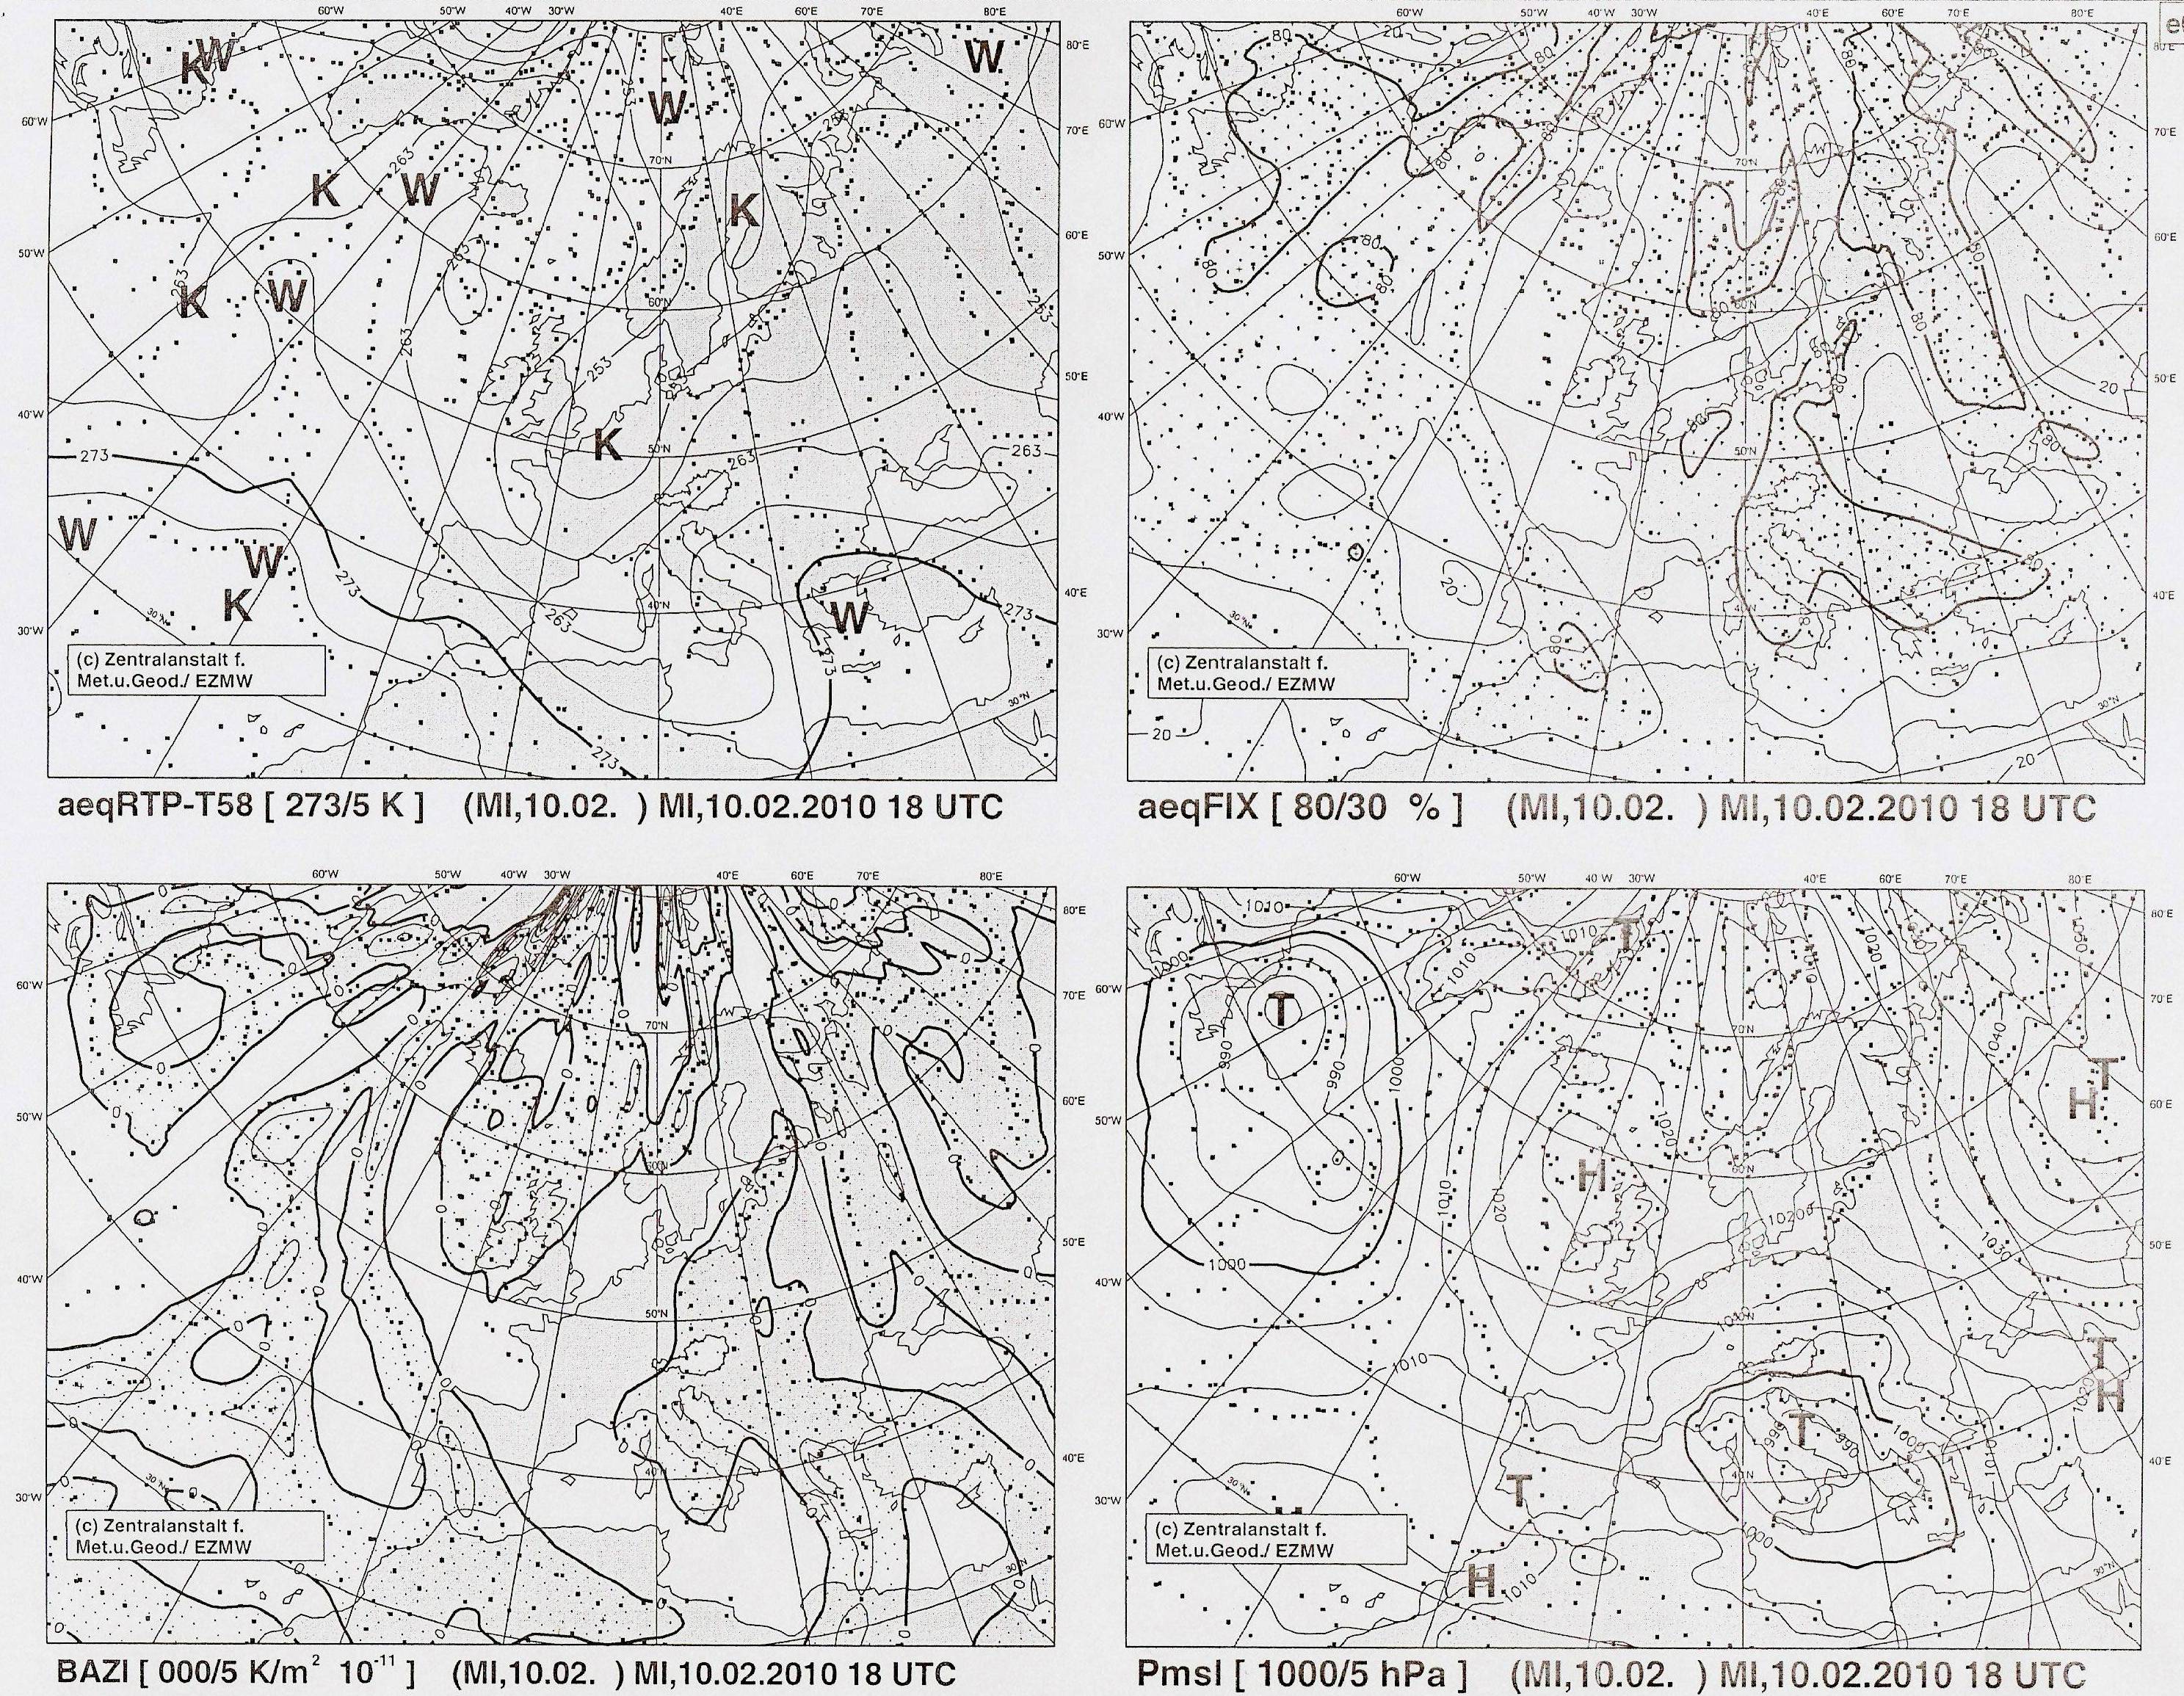
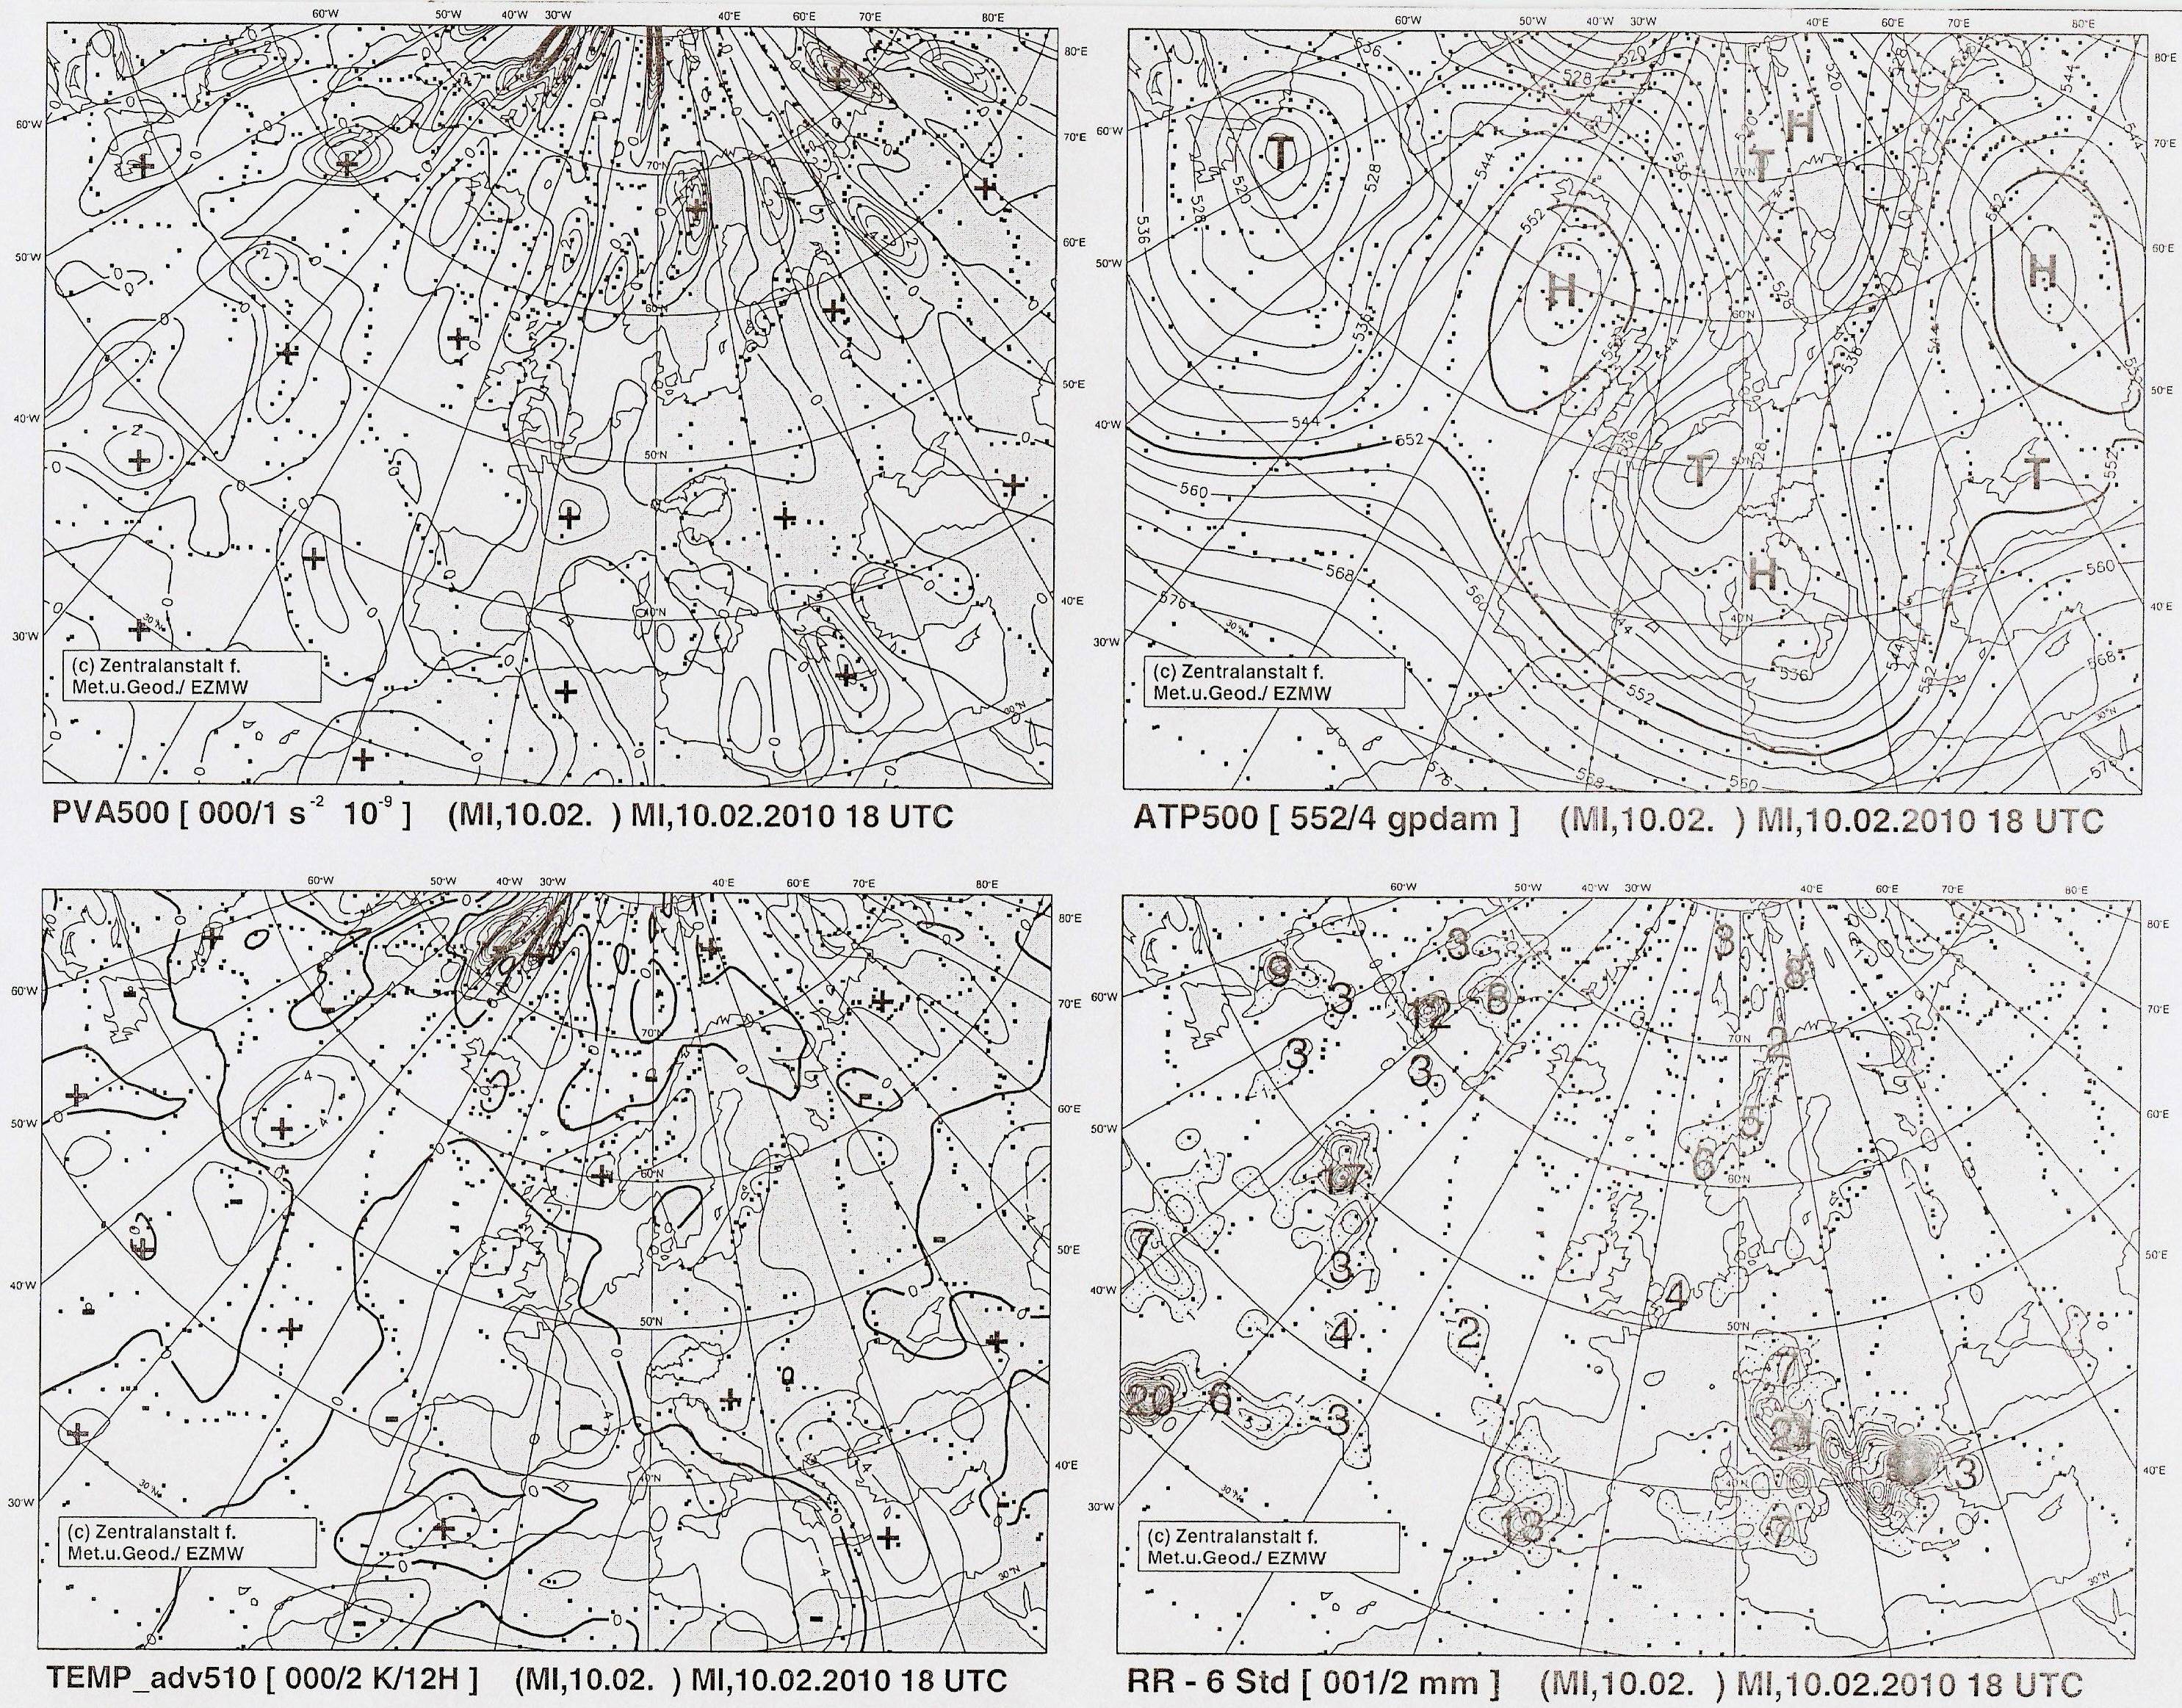
Figure 3.1.1: ECMWF chart 10 February 2010 1800UTC

Figure 3.1.2: INCA snowfall limit [m]: 10 February 2010 0600UTC
The potential snowfall limit, according to the equivalent potential temperature by ECMWF, lay between 1000 and 1500 m in the south of Austria. But it is important to mention, that this snowfall limit only occurs by turbulent mixing.
In the majority of cases the snowfall limit is located deeper, between the two days it was at the surface.
The temperature was in almost whole Austria below 0°C and did not change much. The temperature in Graz and Klagenfurt ranged between -1 and -3 °C, therefore the translation 1 mm precipitation is equivalent to 1 cm snowfall is used. The wind was weak and variable during the days.
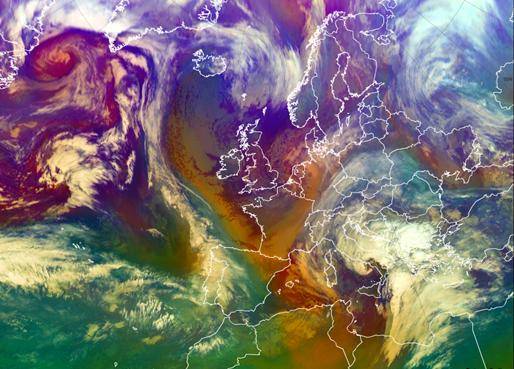
Figure 3.1.3: Meteosat 9 Airmass RGB: 10 February 2010 0600UTC
Cold Airmass (blue areas) dominated Austria. Frontal low level cloudiness covered Austria. The white areas indicate high level clouds.
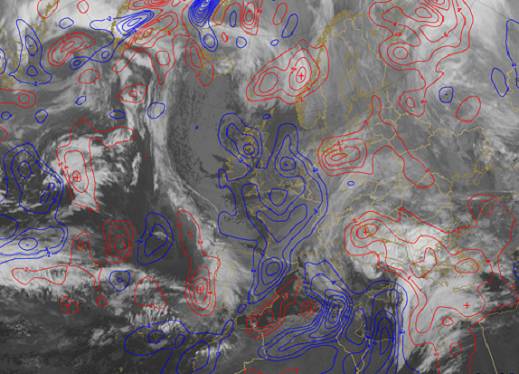
Figure 3.1.4: Meteosat 9 IR10.8; overlay ECMWF Temperature Advection 700 hPa: 10 February 2010 0600UTC
The upper level low over the North Sea delivered with the upper air flow cold air (blue lines) rearward to the Mediterranean low, which caused further development of the depression.
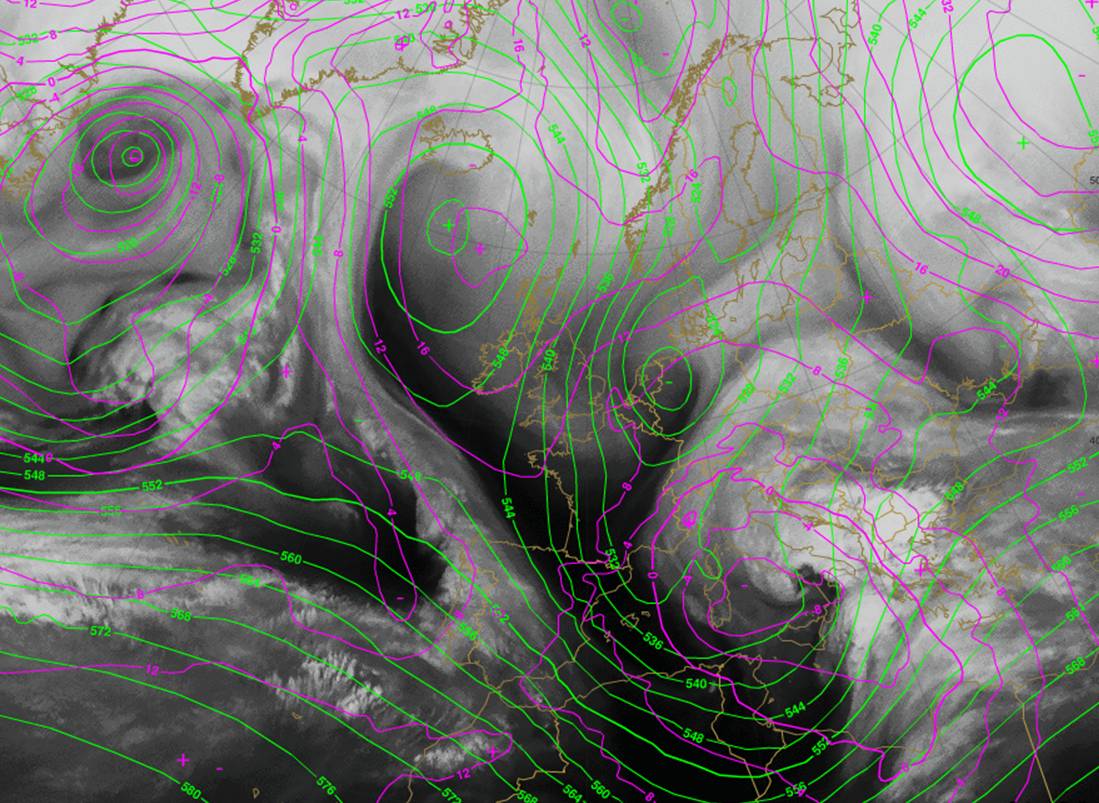
Figure 3.1.5: Meteosat 9 WV6.2; overlay ECMWF Geopotential height 1000 hPa (violet) and 500 hPa (green): 10 February 2010 0600UTC
The upper level low over the North Sea was well represented in the Water Vapour image. The dark area rearward of the surface low over Italy, along the upper trough, indicated cyclogenesis because of dry stratospheric air intrusion.
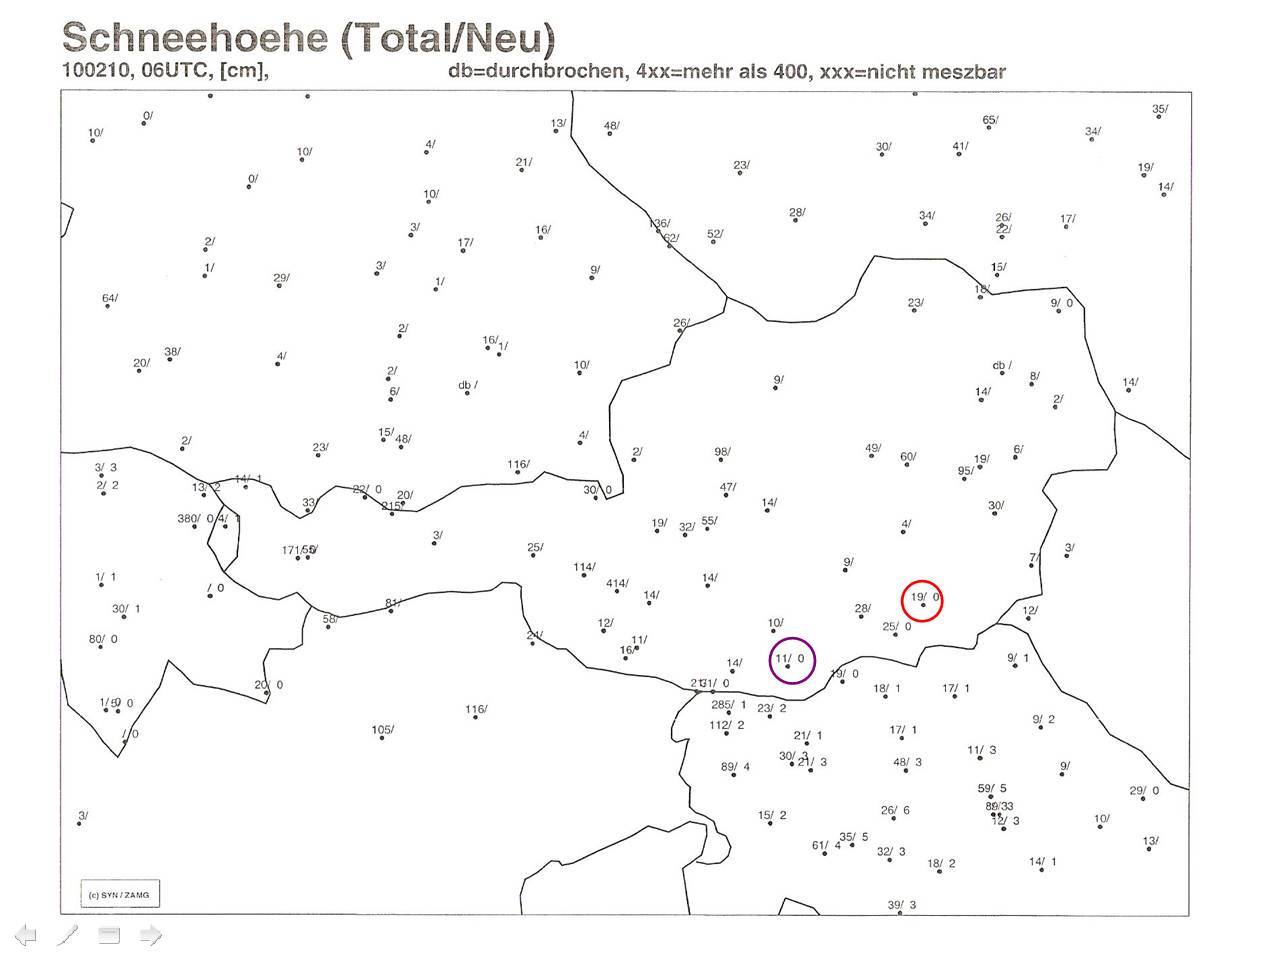
Figure 3.1.6: Snow depth; Total/New (within 24 hours), 10 February 2010 0600UTC; violet circle: Klagenfurt; red circle: Graz
The initial snow depth was 11 cm in Klagenfurt and 19 cm in Graz, respectively.
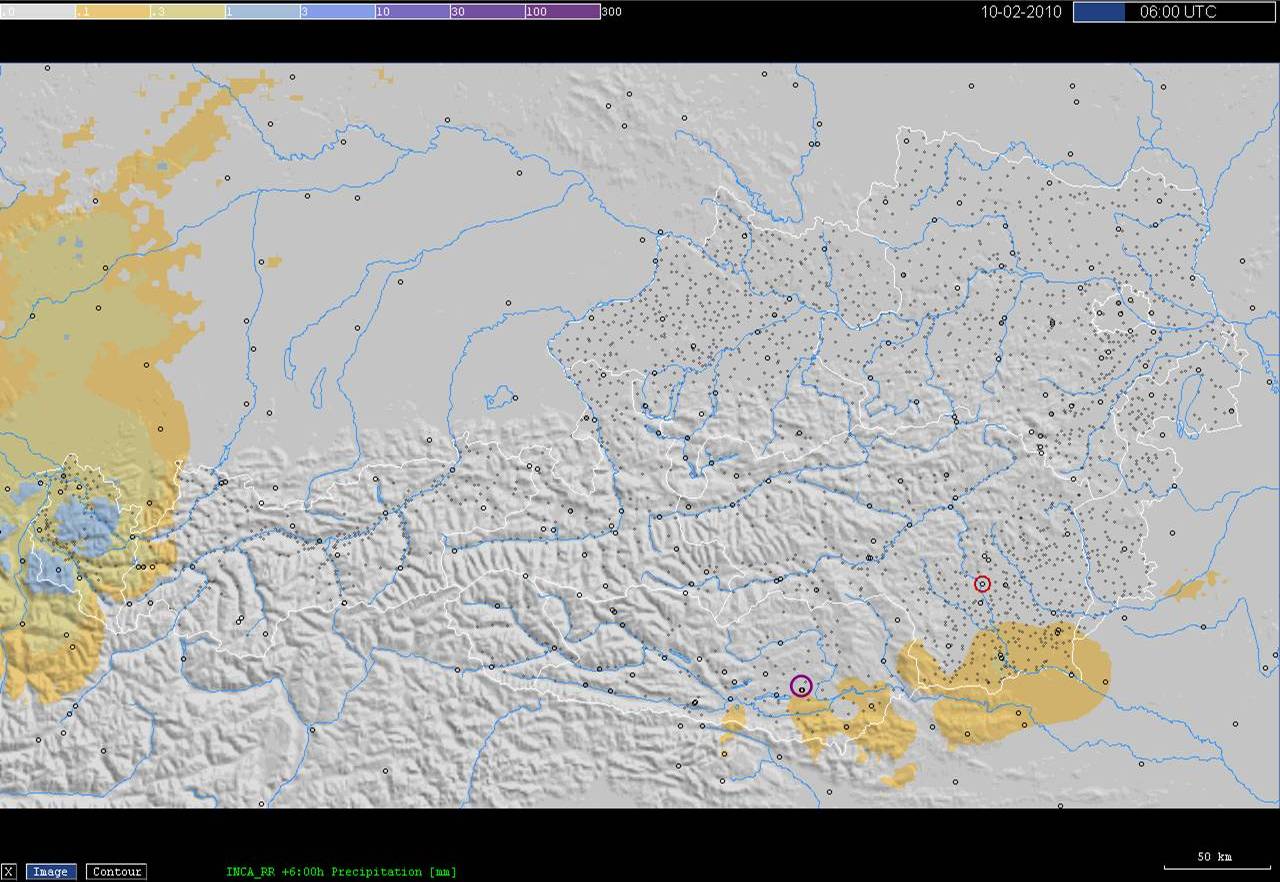
Figure 3.1.7: INCA accumulated precipitation analysis [mm], 10 February 2010 00-06 UTC; violet circle: Klagenfurt; red circle: Graz
In the cities Klagenfurt and Graz there was no snofall yet, but there were some traces in the south of Styria and Carinthia.
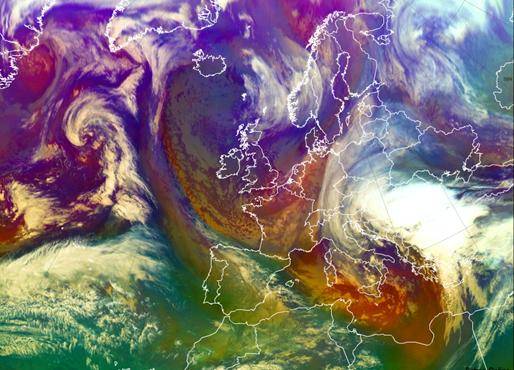
Figure 3.1.8: Meteosat 9 Airmass RGB: 10 February 2010 1800UTC
The occlusion moved further northward.
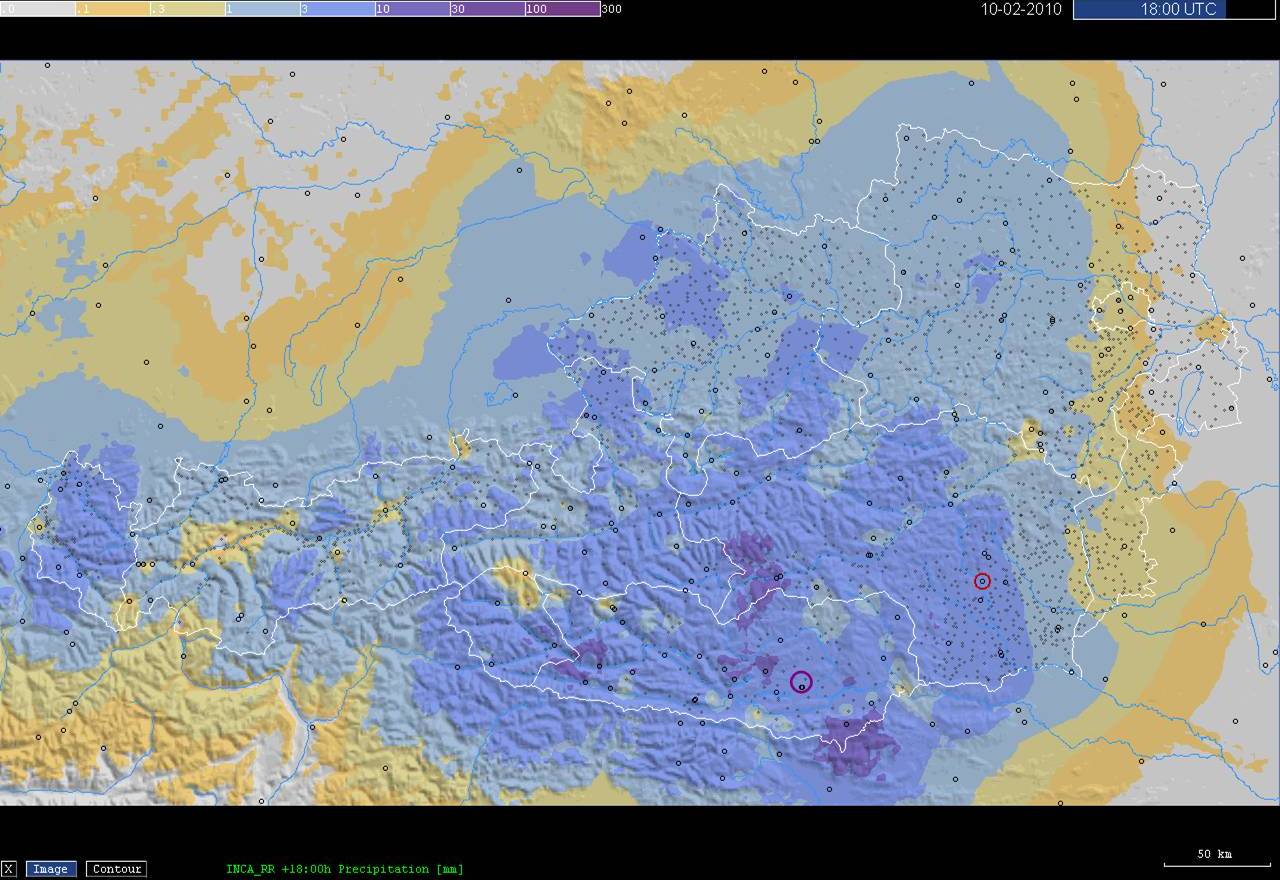
Figure 3.1.9: INCA accumulated precipitation analysis [mm], 10 February 2010 00-18 UTC; violet circle: Klagenfurt; red circle: Graz
The snowfall started in the morning and lasted the whole day. During 18 hours there was 8 cm snowfall in Klagenfurt and 4 cm in Graz.
In some parts of Carinthia the snowfall counted 15 cm, in Styria 9 cm. Due to Barrage Clouds there was also slightly snowfall in the other parts of Austria.
February, 11th 2010

Figure 3.2.1: Snow depth- total/new (within 24 hours) 11 February 2010 0600UTC; violet circle: Klagenfurt; red circle: Graz
The new snow amount between Feb, 10th 06 UTC and Feb, 11th 06 UTC counted 22 cm in Klagenfurt and 15 cm in Graz.
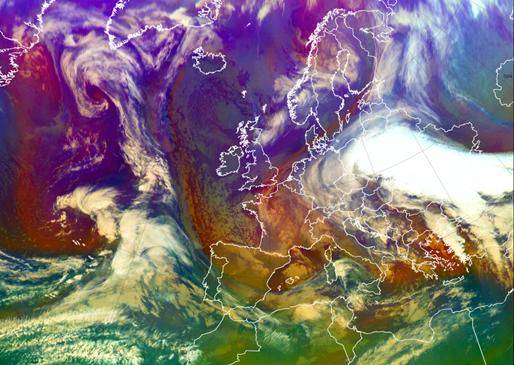
Figure 3.2.2: Meteosat 9 Airmass RGB 11 February 2010 0600UTC
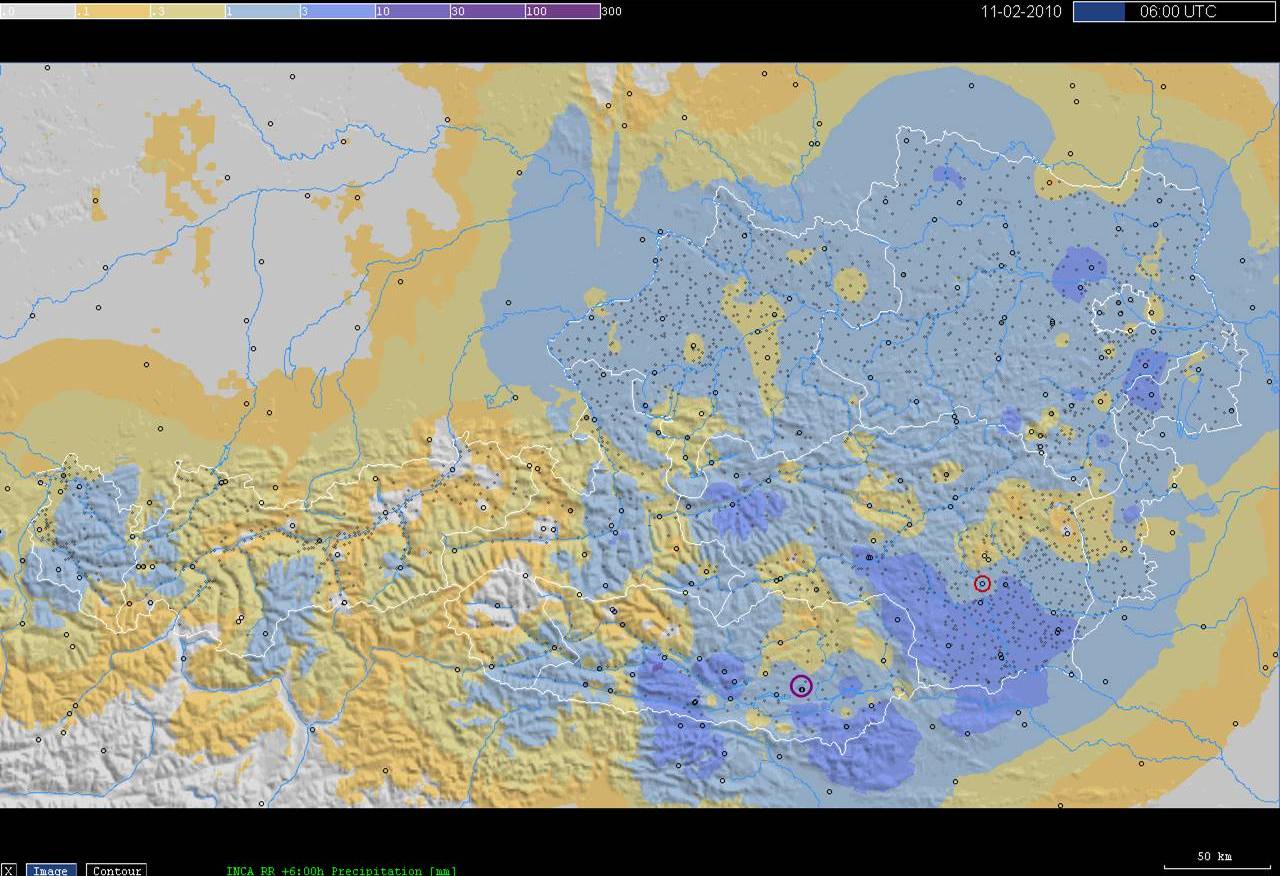
Figure 3.2.3: INCA accumulated precipitation analysis [mm] 11 February 2010 00-06 UTC; violet circle: Klagenfurt; red circle: Graz
Within 6 hours the snowfall measured 3 cm in Klagenfurt and 2 cm in Graz. Some parts in Carinthia measured 10 cm and some parts in Styria detected 7 cm.
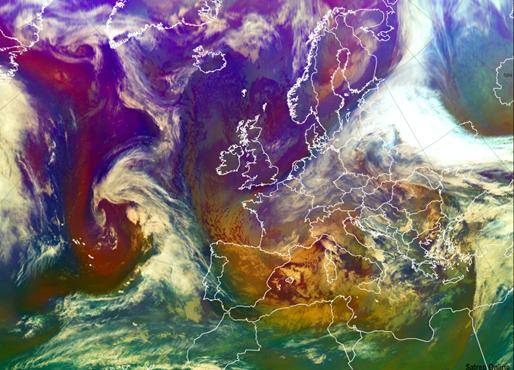
Figure 3.2.4 Meteosat 9 Airmass RGB 11 February 2010 1800UTC
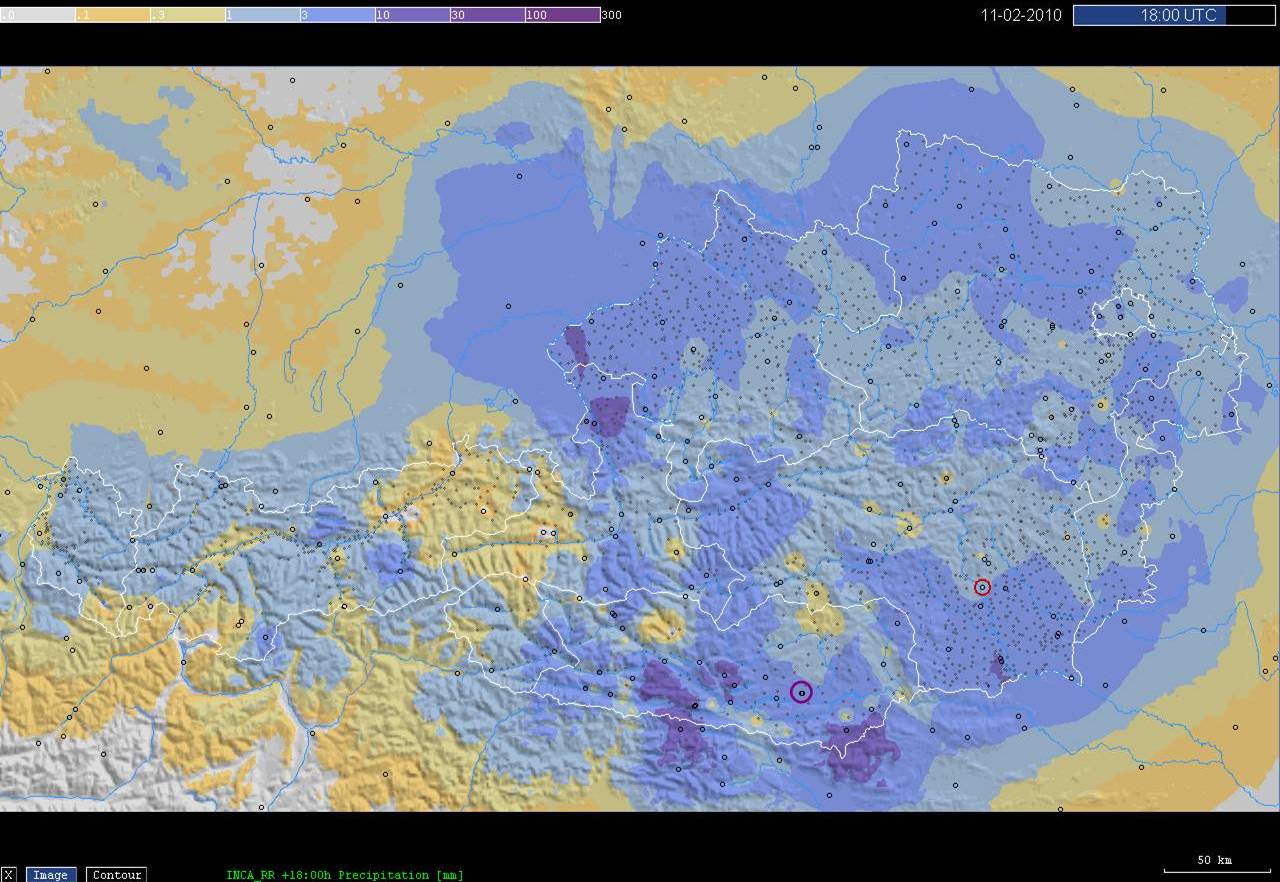
Figure 3.2.5: INCA accumulated precipitation analysis [mm] 11 February 2010 00-18 UTC; violet circle: Klagenfurt; red circle: Graz
The values ranged from 6 cm in Klagenfurt to 17 cm near Spital/Drau. The 18 hours precipitation amount in Styria reached between 2 cm in Graz and 10 cm in Leibnitz, in the south of Styria. The snowfall extended over almost whole Austria and in some parts in the south windward snowfall was found.
February, 12th 2010
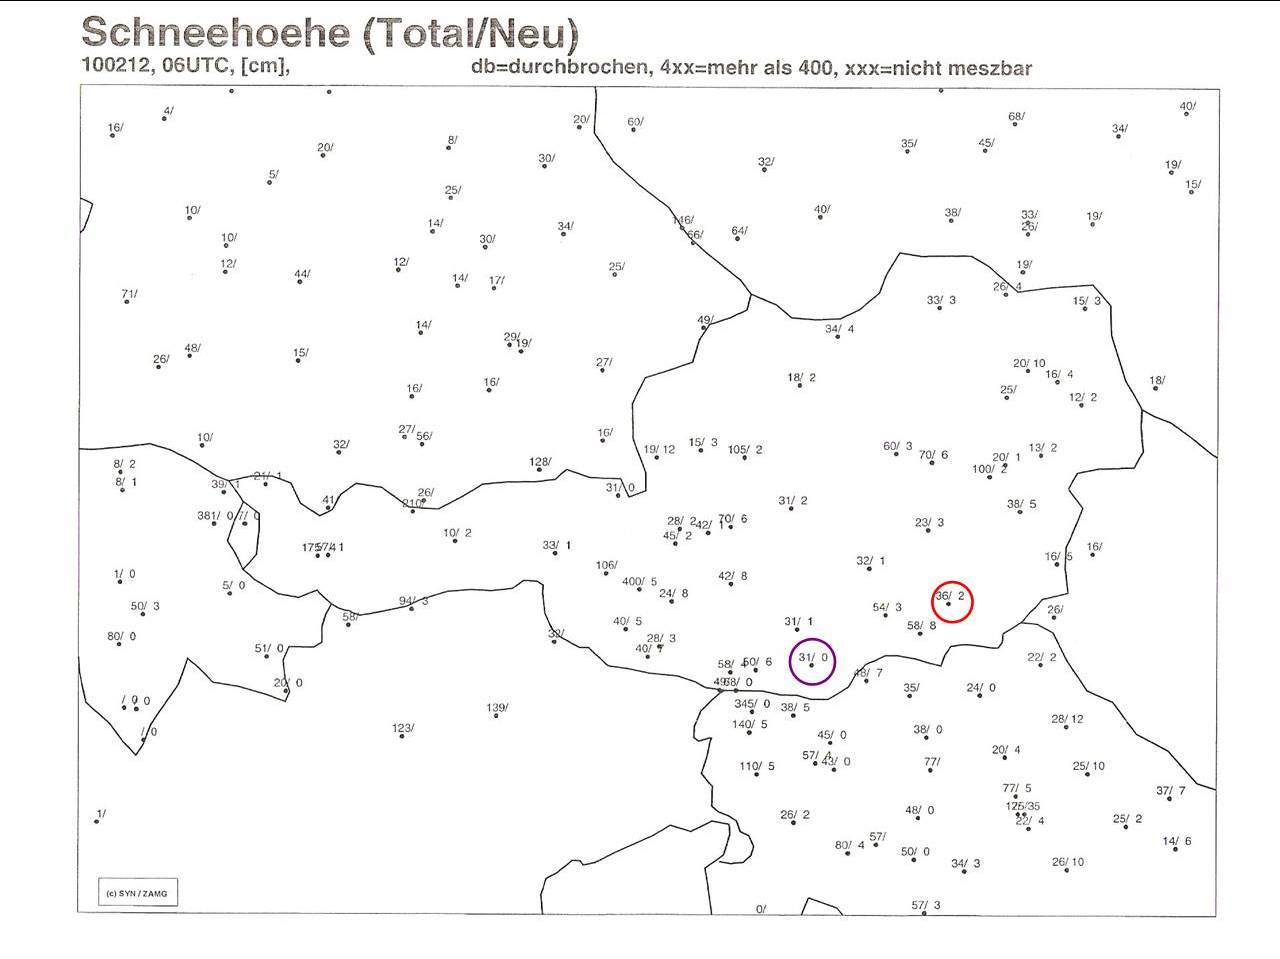
Figure 3.3.1: Snow depth- total/new (within 24 hours), 12 February 2010 0600UTC; violet circle: Klagenfurt; red circle: Graz
The total snow amount counted 31 cm in Klagenfurt and 36 cm in Graz.
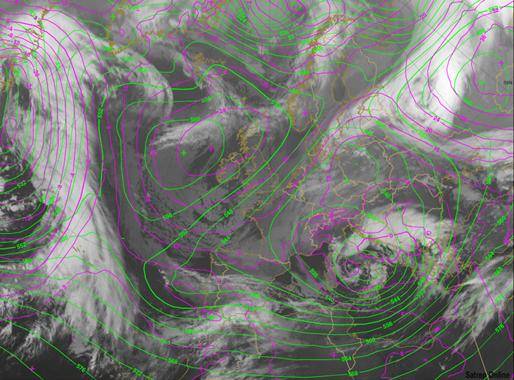
Figure 3.3.2: Meteosat 9 IR10.8; overlay ECMWF Geopotential height 1000 hPa (violet) and 500 hPa (green): 12 February 2010 1800UTC
The upper level low and the surface low over Italy were almost exactly superimposed, indicating a degradation of the system.