24 - 25 August 1997 - Development Between 18.00 And 00.00 UTC
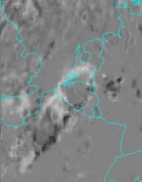
Developments and movements of the most important cloud clusters show best with deviation images. High pixel values (white) indicate movement and/or development of high clouds, while low pixel values (black) give an indication of decreasing cloudiness.
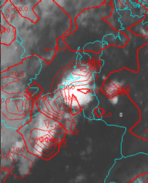
This deviation values can also be calculated. Positive values denote developing cloudiness, negative values dissolving cloudiness.
|
24 August 1997/20.00 - 21.00 UTC - Meteosat IR development image
|
24 August 1997/21.00 UTC - Meteosat IR image; red: mean values of grey shades of cloud development and decay
|
Of interest is the development of the two cloud clusters over north-west France and Belgium. The northern cluster is rapidly developing into a thunderstorm complex with high deviation values, while the southern one is rapidly decaying.
Radiosonde Soundings
Soundings from radiosondes are very helpful in detecting an unstable air mass.
They have the advantage of giving a true picture of the state of the atmosphere, more so than model fields. A disadvantage is the fact that they represent only a one dimensional state of the atmosphere. To make use of these soundings one must assume that the data are representative of the whole air mass.
|
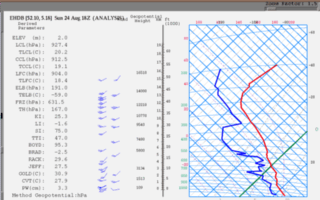
24 August 1997/18.00 UTC - Radiosounding De Bilt (06260)
|
|
The air mass is clearly unstable but the various indices do not indicate much likelihood of the development of thunderstorms. A positive vertical windshear is admittedly present but only light. More striking is the potential instability as shown by the Bradbury index (BRAD), which is ThetaW (500hPa) - ThetaW (850hPa), which is -2.5 here.
Also the amount of precipitable water (PW), 3.3 cm, is very high.


