Diagnosis 24 August 18.00 UTC
|
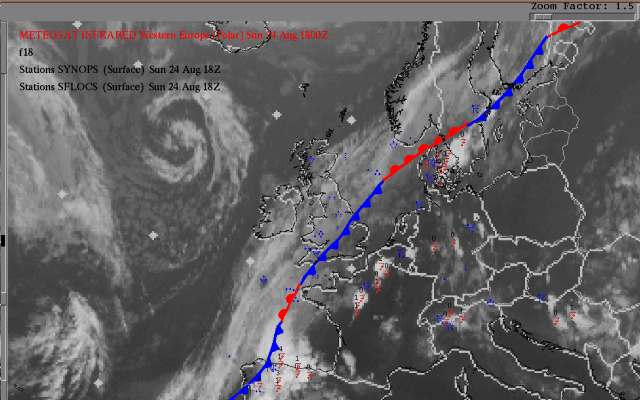
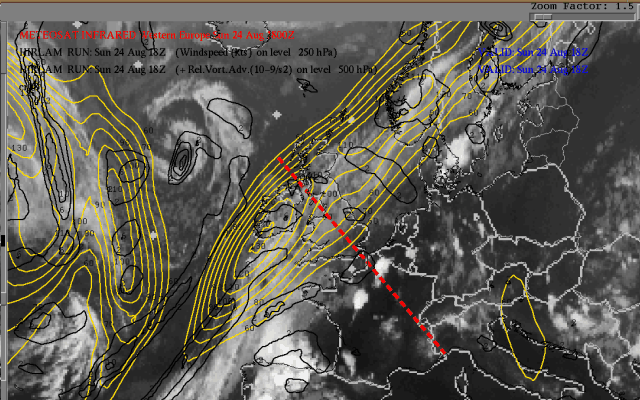
24 August 1997/18.00 UTC - Meteosat IR image; weather events (blue: WW code, red: SFLOCS)
|
|
|
The satellite image contains the cloud bands of a polar Cold Front (compare Conceptual Models: Cold Front ). The front is quasi-stationary and therefore shows a wavy pattern. The cloud features to be investigated are the two northerly cloud clusters over France and the extended cluster over Spain and the Bay of Biscay. In all the mentioned cloud clusters thunderstorm activity was reported. At 18.00 UTC both clusters over France (48N/01E and 50N/03E) were moving in a north to north-easterly direction.
For the diagnosis of the physical state of the conceptual model Mesoscale Convective System a couple of key parameter and useful key parameters combinations are available which were chosen with respect to the conceptual model (for more information see Conceptual Models: Cumulonimbus (Cb) and Mesoscale Convective System (MCS) ).
ABSTOP1000 + WA1000-500 + CA 500-300 + IR + Vertical Cross Section
This combination is indicative of growing instability in the troposphere.
- The height contours very close to the ground, 1000 hPa (gpm), which in the case of convective clusters often show a trough in front of the Cold Front.
- In the case of convective clusters advection of warm air in the lower layers causes growing instability.
- Advection of cold air in the upper layers can also be the source of growing instability.
|
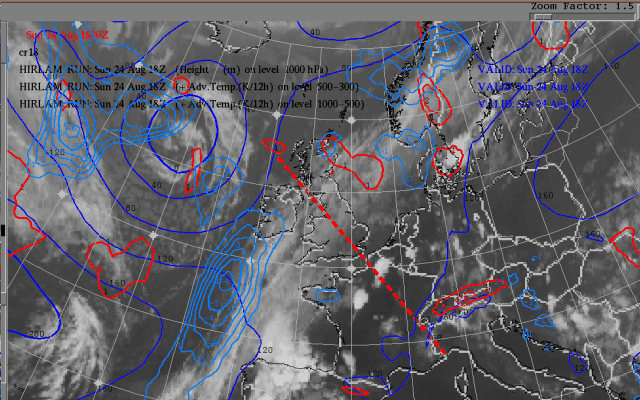
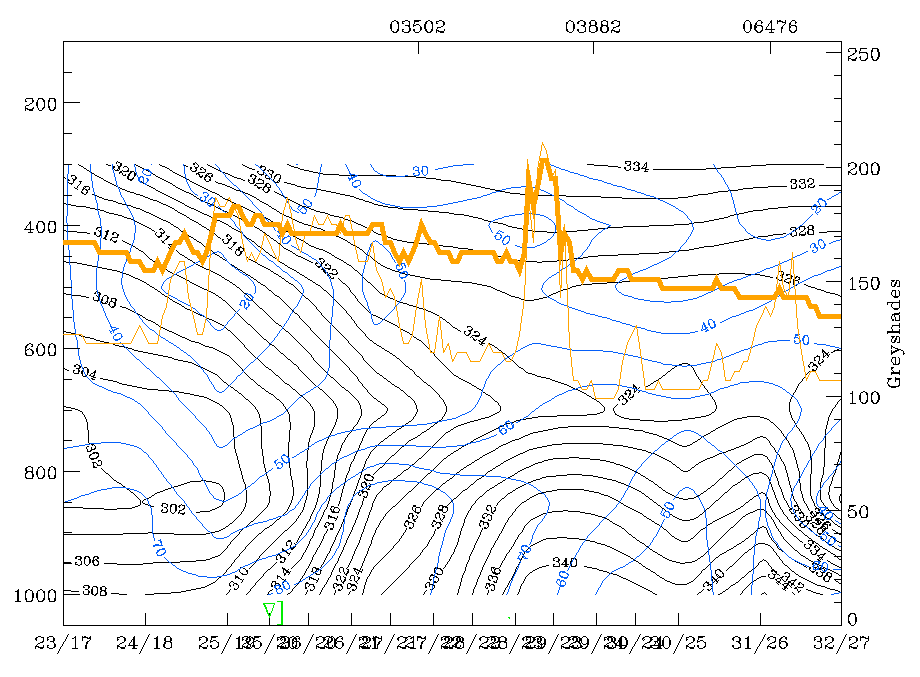
24 August 1997/18.00 UTC - Meteosat IR image; cyan: height contours 1000 hPa, red: temperature advection - WA 1000 hPa, blue:
temperature advection - CA 500 hPa; position of vertical cross section indicated
|
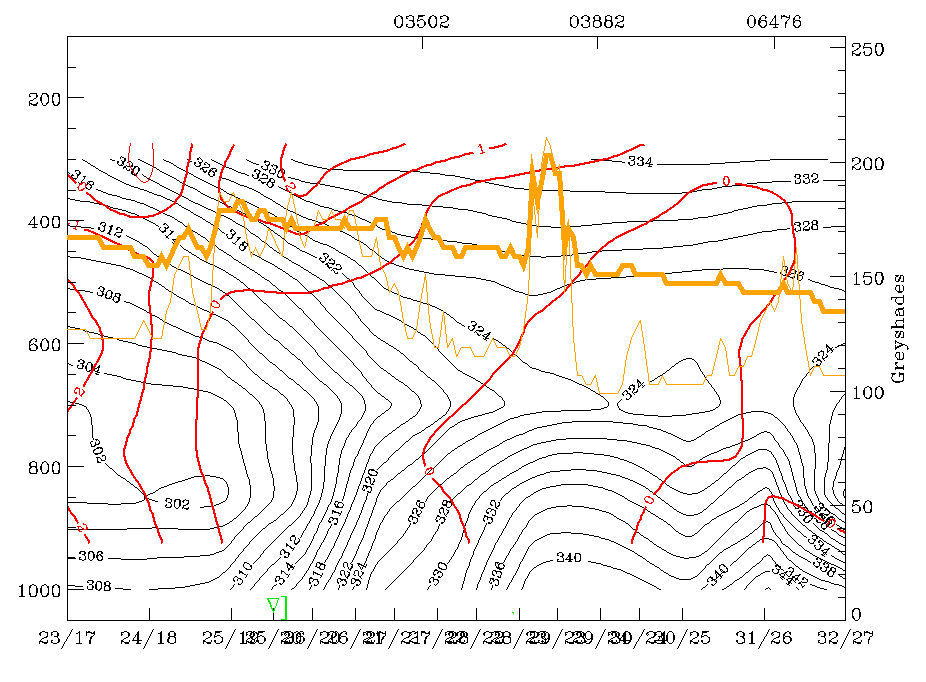
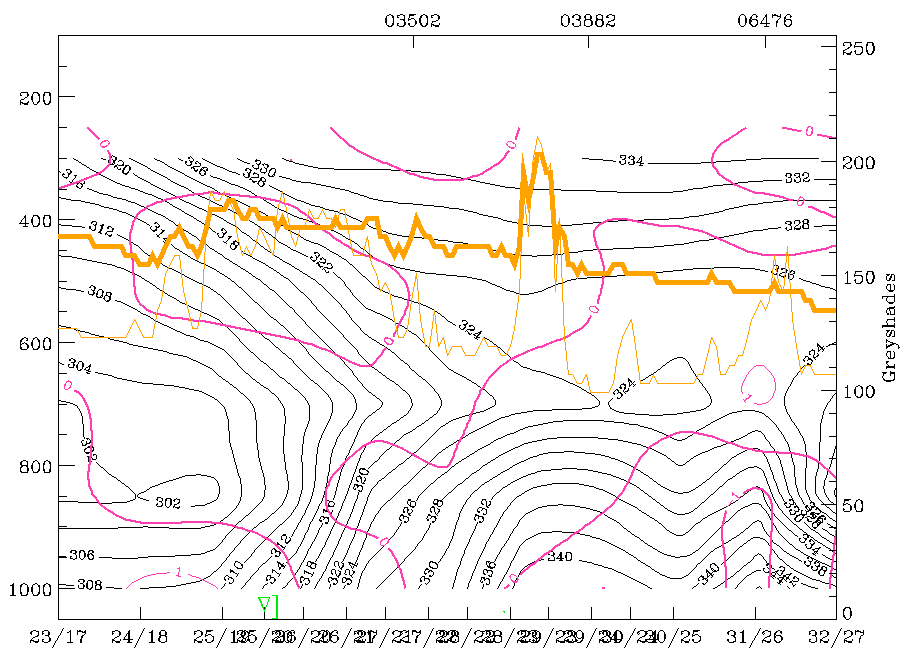
24 August 1997/18.00 UTC - Vertical cross section; black: isentropes (ThetaE), red thin: temperature advection - CA, red thick:
temperature advection - WA, orange thin: IR pixel values, orange thick: WV pixel values
|
|
|
In the HIRLAM parameter fields, as well as in the ECMWF cross section, there is no clear indication of cold or warm advection in the area of the cloud clusters above north-west France. Very distinct is the instability in the area, which shows in the decreasing Theta values with height in the cross section up to 700 hPa. There is also hardly any gradient in the 1000 hPa height over west Europe.
Thickness 1000/500/ThetaW 850 hPa + WV + Vertical Cross Section with relative humidity
In the case of mesoscale convective systems the sensitive area is within the thickness ridges and in a very distinct ThetaW 850 hPa ridge with relatively high values. In most of the cases the pattern of the ThetaW ridge shows great similarity with the thickness ridge. In addition the values of ThetaW 850 give an indication of the amount of potential energy and moisture. The water vapour image gives an indication of moist air at higher levels. Dark grey in the WV images indicates dry air in the middle and higher troposphere. This information can be of great importance in cases of potential instability.
The cross section indicates the distribution of humidity in the vertical.
|
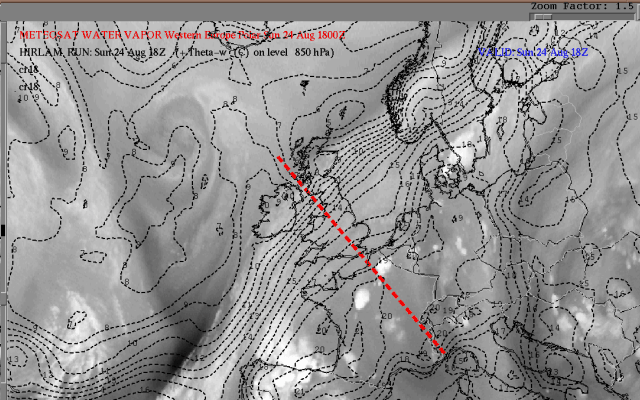
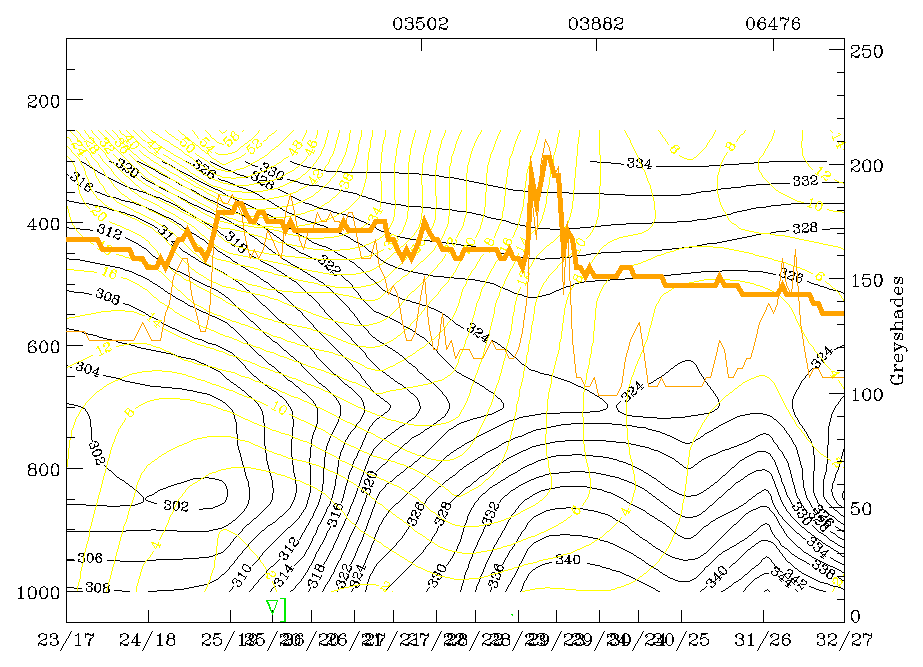
24 August 1997/18.00 UTC - Meteosat WV image; black: wet bulb temperature 850 hPa; position of vertical cross section indicated
|
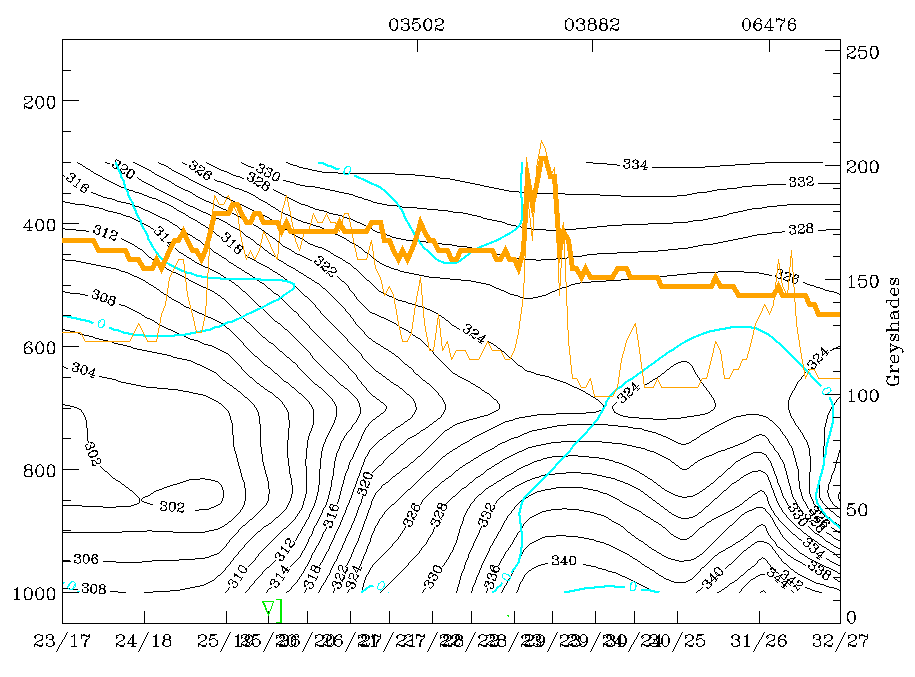
24 August 1997/18.00 UTC - Vertical cross section; black: isentropes (ThetaE), blue: relative humidity, orange thin: IR pixel values,
orange thick: WV pixel values
|
|
|
The cloud clusters over north-west France are situated along a ThetaW 850 ridge of very high values (>=20°C). In the cross section the high pixel values in the WV from the cluster near the Belgium border are not clearly detectable in the humidity values.
Isotachs 250 hPa >= 60kt + PVA500 >= 2 + IR + Vertical Cross Section
This combination is indicative of dynamical forcing due to the influence of a jet streak.
- The isotachs give indication of the position of the jet streak and the position of the maximum horizontal shear.
- The vertical cross section shows the vertical wind shear which is important for the development of strong Cb clusters.
- PVA500>=2: this parameter shows maxima of positive vorticity advection (PVA) at 500 hPa exceeding 2 units (*10-9sec-2); this key parameter indicates areas with increased vertical motion.
|
24 August 1997/18.00 UTC - Meteosat IR image; black: positive vorticity advection (PVA) 500 hPa, yellow: isotachs 250 hPa; position of
vertical cross section indicated
|
24 August 1997/18.00 UTC - Vertical cross section; black: isentropes (ThetaE), yellow: isotachs, orange thin: IR pixel values, orange
thick: WV pixel values
|
|
|
|
|
|
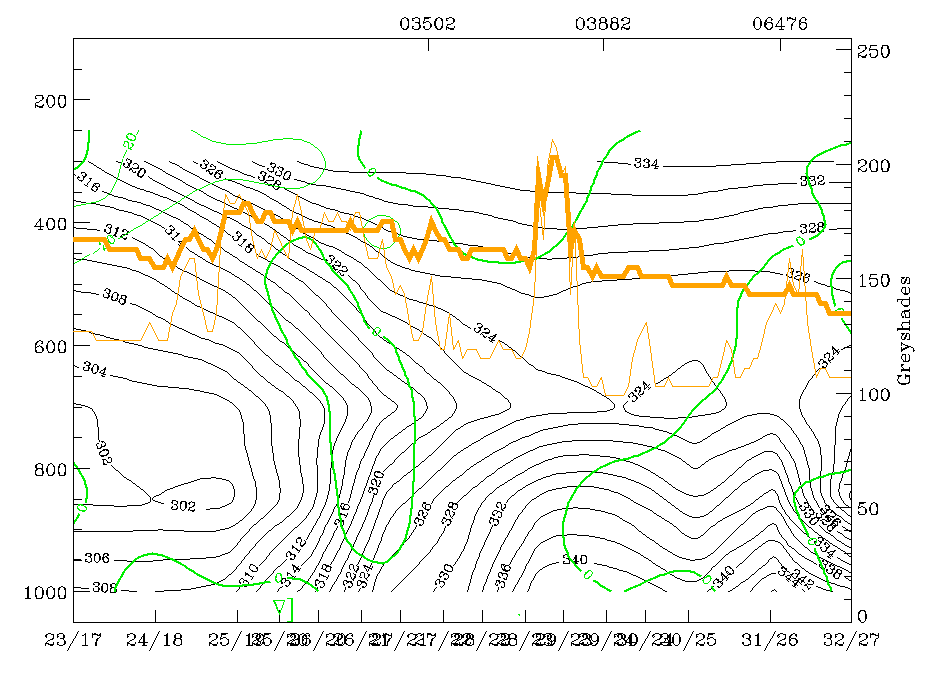
24 August 1997/18.00 UTC - Vertical cross section; black: isentropes (ThetaE), green thick: vorticity advection - PVA, green thin:
vorticity advection - NVA, orange thin: IR pixel values, orange thick: WV pixel values
|
|
The image in combination with PVA at 500 hPa and isotachs at 250 hPa indicates only weak PVA west of the cloud clusters in north-west France. Over north-west Spain and the Bay of Biscay more distinct PVA is visible in the right entrance of a jet streak. Vertical windshear as shown in the cross section is not very distinct in the area of the investigated cloud cluster.
The PVA parameter in the cross section also shows no distinct values in the area of the investigated cloud cluster.
Divergence and vertical motion
The combination indicates the role of divergence in the total vertical motion (omega).
This combination is best shown with vertical cross sections because the height of the maxima and minima of divergence and omega can vary a lot from case to case.
- The omega parameter indicates the vertical motion as a result of differential temperature advection, vorticity advection or from diabatic heating.
- Divergence indicates the dynamical forcing by PVA or by friction effects.
|
24 August 1997/18.00 UTC - Vertical cross section; black: isentropes (ThetaE), magenta thin: divergence, magenta thick: convergence,
orange thin: IR pixel values, orange thick: WV pixel values
|
24 August 1997/18.00 UTC - Vertical cross section; black: isentropes (ThetaE), cyan thick: vertical motion (omega) - upward motion,
cyan thin: vertical motion (omega) - downward motion, orange thin: IR pixel values, orange thick: WV pixel values
|
|
|
From the divergence values as well as from the omega parameter it is clear that no imported dynamical forcing was present at this time. The values are very low and vary between positive and negative.
Relative streams
This parameter shows relative streams on isentropic surfaces; relative streams are indicative of the different air masses involved in the process and of areas with sinking or rising air; they can be used to explain cloud configurations requiring special explanation.
Although of much importance in a conceptual model of mesoscale convective clusters, the relative streams could not be calculated for this case study and are not further discussed here.
Summary of diagnosis 18.00 UTC
In the area of the investigated cloud cluster the chosen parameters give no indication of dynamic forcing. The huge instability and the high ThetaW 850 values indicate an ideal situation for local thunderstorm development.
Over north-west Spain and the Bay of Biscay a cloud cluster is present which is under the influence of PVA within the right entrance of a jet streak.