The observational part of MCS diagnosis - IR image sequence
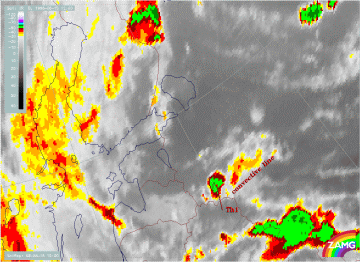
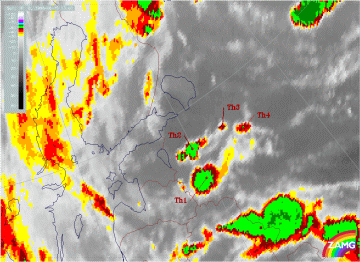
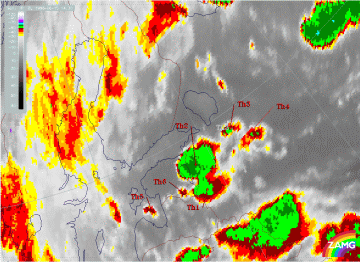
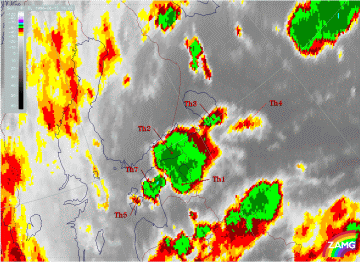
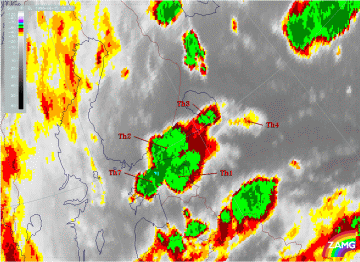
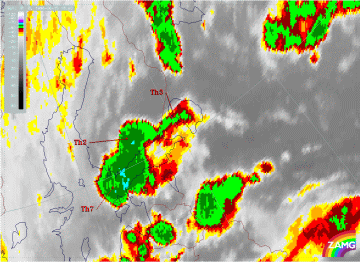
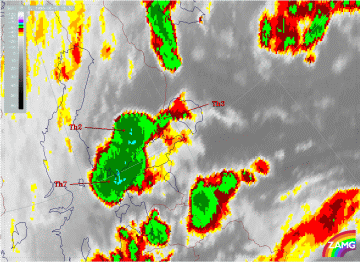
The following image sequence shows the rapid development of convective cells in half-hourly steps.
At 12.00 UTC the convective center (marked with Th1) is located along a west-east oriented convective line, which seemingly decays by 12.30
UTC. Meanwhile a new development can be seen ahead of the line (possibly within the gust front initiated by Th1). The new colder tops are
marked as Th2, Th3, Th4.
During the next few hours Th1 does not develop any further, whilst Th2 develops very quickly. The merging of Th1 and Th2 takes place around
14.30 UTC. Th1 remains, however, still recognizable for couple of hours as a part of the huge, merged Th1-Th2 MCS cloud over Estonia and Gulf
of Finland.
By 15.00 UTC new Cb cells have developed, and now seven distinct convective centers can be detected, although most of them are only small in
size.
The spreading of the cirrus anvils of the individual cells results in merging of upper-level clouds, which can be seen very clearly in the
images for 18.00 or 18.30 UTC. At that time there is practically only one huge and intensive MCS cell over southern Finland.
|
15 June 1998/12.00 UTC - Meteosat IR enhanced image; 12.00 - 18.30 UTC half-hourly image Loop
|
15 June 1998/12.30 UTC - Meteosat IR enhanced image
|
|
15 June 1998/13.00 UTC - Meteosat IR enhanced image
|
15 June 1998/13.30 UTC - Meteosat IR enhanced image
|
|
15 June 1998/14.00 UTC - Meteosat IR enhanced image
|
15 June 1998/14.30 UTC - Meteosat IR enhanced image
|
|
15 June 1998/15.00 UTC - Meteosat IR enhanced image
|
15 June 1998/15.30 UTC - Meteosat IR enhanced image
|
|
15 June 1998/16.00 UTC - Meteosat IR enhanced image
|
15 June 1998/16.30 UTC - Meteosat IR enhanced image
|
|
15 June 1998/17.00 UTC - Meteosat IR enhanced image
|
15 June 1998/17.30 UTC - Meteosat IR enhanced image
|
|
15 June 1998/18.00 UTC - Meteosat IR enhanced image
|
15 June 1998/18.30 UTC - Meteosat IR enhanced image
|
