

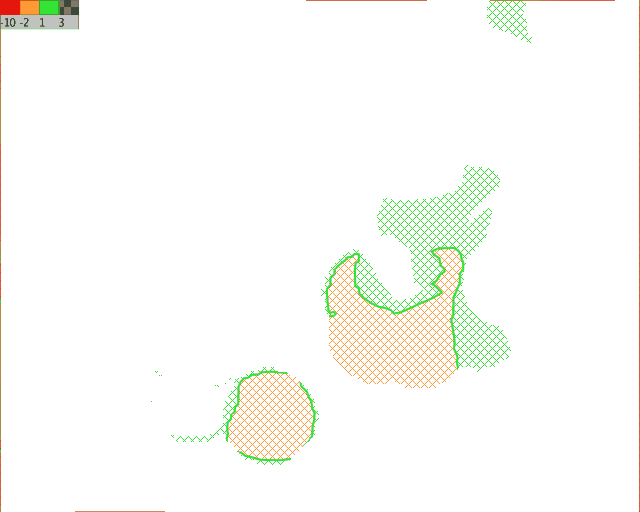
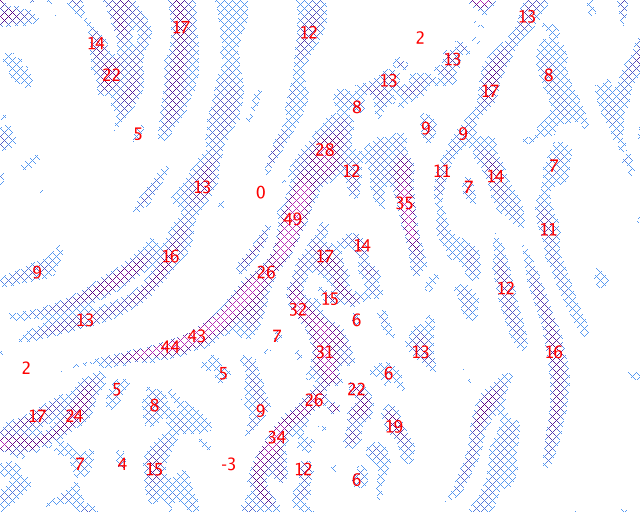


By ticking the fields in front of the parameter name the images are interactively overlayed.
The comment on the selected field is shown after clicking on yellow "i" for the chosen parameter.
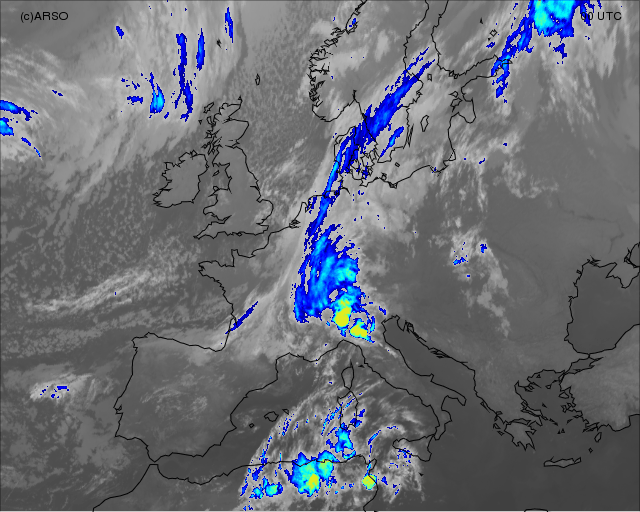
The IR10.8 enhanced image is displayed as a basic image in every time stamp. Images at 00, 06, 12 and 18 UTC are shown. The coldest tops are displayed in yellow-orange colors up to -60 °C.
At 00 UTC a cold front can be seen approaching the Alps and pre-frontal convection is developing over Northern Italy. In the following steps this pre-frontal development over Italy, Slovenia and Croatia continues as the front is passing over the Alps.
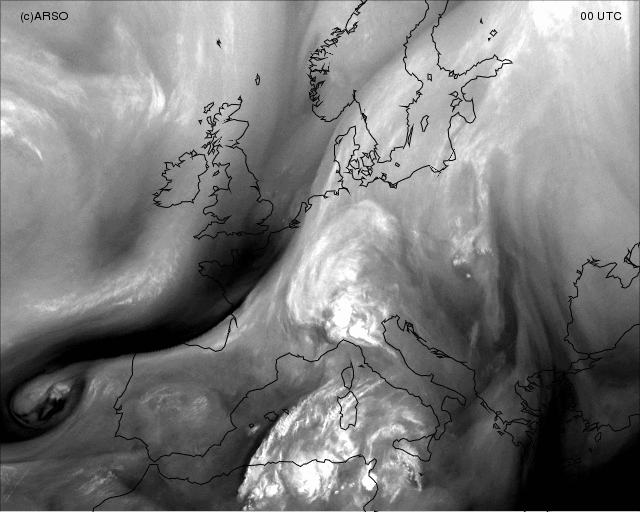
Meteosat Water Vapour image depicts the water content in the higher troposphere.
A feature easily recognizable in the image is a dark stripe. Water vapour Dark Stripes tipically occur on the cyclonic side of the jet axis, behind the cold fronts or the occlusions and along the leading edge of warm fronts. More about the Dark Stripes can be found in the Manual of Synoptic Satellite Meteorology.
In this case a Dark Stripe shows the location of the jet, behind the cold front. Dry air in this region comes from the stratosphere. If you overlay a Height of PV=2 field you will see good correspondence between the dry air and the PV maxima. Notice also how dry air is "wrapped" around the cyclone forming in the Atlantic. This feature is typical for strong cyclogenetic processes.
On the other hand there is a lot of moist air in the Alpine region and over central Europe suggesting that the main cloud formation takes place at these spots.
In the following time steps convection taking place over central Europe is clearly seen. At 18 UTC it can be noticed how the jet enhances the convection over Slovenia.
Airmas RGB is a complex composite of several Meteosat channels, giving the information about the temperature and humidity
of the airmasses. You can click on the
 to see what different colours in the image mean.
A stripe of dry air with high PV values, depicted by reddish colour, is connected to the jet stream flowing behind the cold front. Very high convective cells are seen in the pre-frontal area over north Italy.
Cold air with large PV (in violet colour) propagates to the south behind the frontal cloud band. Notice also the red area wrapped around the low developing south-west of Portugal.
In the next steps the red area over western Europe gets even more intense and the convection starts also within the frontal cloud band to the right of the red area.
You can overlay Height of PV=2 field to see how the reddish and violet areas coincide with PV maxima.
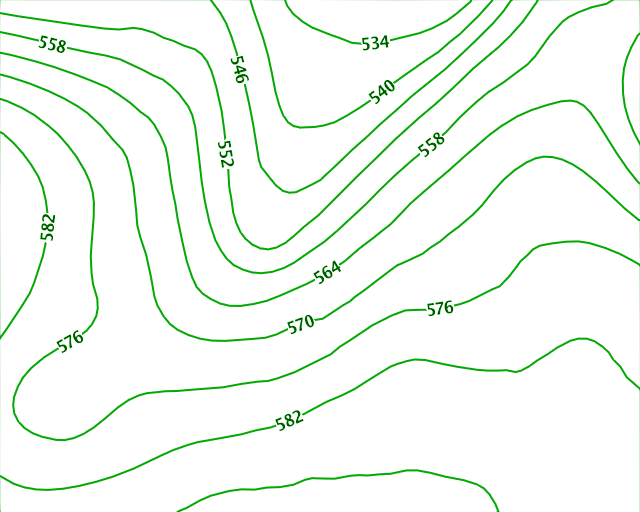
Frontal clouds are located on the leading edge of a very deep trough at 700 hPa.
In the next steps the through propagates to the east crossing the western Europe. The onset of the prefrontal convection is seen in the southwesterly stream on the leading side of the trough.
Notice a small trough appearing at 12 UTC over the western edge of the Alps, over northern Italy and getting deeper in the next time step.
At 00 UTC a deep upper-level trough is located over the west coasts of Europe.
There is a low forming west of Portugal over the Atlantic. From the western
Mediterranean towards the central Europe there is strong southwesterly
stream in the upper levels. Cold air is penetrating from the north
within the trough.
At 12 UTC a low over the Atlantic has cut off and it deepens in the next step. The cold air from the north within the deep trough is
reaching central Europe. Strong southwesterly flow can be noticed in
the region where pre-frontal convection occurs and also on the rear
side of the front.
High values of PV are found behind the frontal cloud band. There is also a pronounced maximum connected to the cyclogenesis west of Portugal.
Only a small local maximum is seen over N Italy and at 06 UTC there are some higher values also in the region where convection took place.
At 18 UTC, especcially if the PV field is overlaid on the Airmass image, it can be seen how the cold air with large PV values, penetrating from the north, combined with the jet from the south-west enhanced the convection over central Europe.
At 18 UTC, especcially if the PV field is overlaid on the Airmass image, it can be seen how the cold air with large PV values, penetrating from the north, combined with the jet from the south-west enhanced the convection over central Europe.
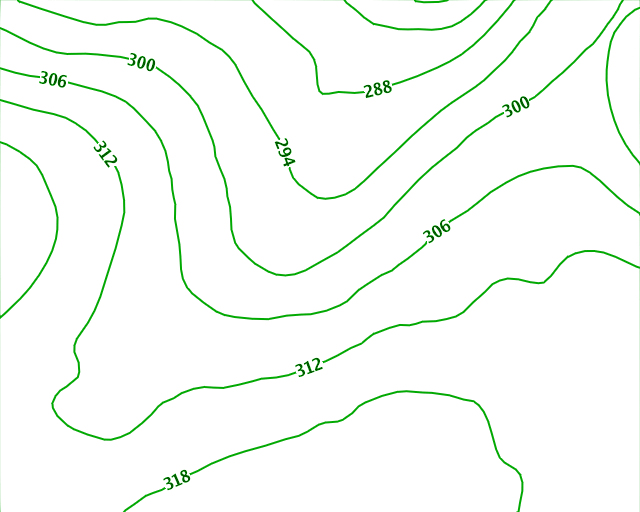
Showalter index indicates the unstable areas. According to this parameter, the region of Italy and central Europe was quite unstable.
At 00 UTC the Showalter index shows good agreement with the convection
over North Italy, but quite a large shift over the Mediterranean.
In the next steps it can be seen that the field of Showalter index gives very good indication of instability
over the northern Italy and central Europe, where the convection was taking place.
Red values of Showalter are in good correlation with the strongest convective
development over northern Italy and Slovenia.
At 18 UTC, in the last frame, the field of Showalter index indicated instability more to the east, whereas there was still strong convection over Slovenia.
At 18 UTC, in the last frame, the field of Showalter index indicated instability more to the east, whereas there was still strong convection over Slovenia.
Positive Vorticity Advection maxima are found behind the cold-front and in the region where cyclogenesis occurs over the Atlantic.
There are also some small maxima in the pre-frontal area, indicating the conditions favorable for the development of convection. The locations of these maxima do not coincide perfectly with the cloud structures, but merely give an indication of possible development.
There are also some small maxima in the pre-frontal area, indicating the conditions favorable for the development of convection. The locations of these maxima do not coincide perfectly with the cloud structures, but merely give an indication of possible development.
Wind vectors at 300 hPa with the threshold of above 30 m/s are
displayed.
Relative humidity field shows very good correspondence with the cloud structures in the images, especially the
Water Vapour image. Besides the high values of humidity within the frontal zone, there is a maximum ahead the front,
which corresponds nicely to the prefrontal convective clouds.