Authors
| ZAMG |
| Jarno Schipper |
Austria: 21 June 2007
In this chapter we will have a closer look on the convection over Austria. We will again have a more detailed look on the different satellite images, including some RGBs. This chapter will be finalised by some radar images to pinpoint the areas where hail was reported.
21 June: Meteosat 9 Satellite Imagery
Meteosat 9 IR10.8: Time sequenceThe first chapter dealing with the synoptic situation describes the convective developments seen over Central Europe on 21 June using plain Meteosat 9 infrared 10.8 μm. The channel is appropriate as it pictures the ice in high clouds quite clearly. In a sequence of 15 minutes the satellite images are presented and described.
Meteosat 9 Enhanced IR10.8: Time sequence
In this chapter again Meteosat 9 infrared 10.8 μm are shown, but the images have been artificially colour enhanced. This will improve the discrimination of where the evolution from water into ice is taking place during the several convective stages. In a sequence of 15 minutes the satellite images are presented and described.
Meteosat 9 WV6.2: Time sequence
The chapter presents the several convective developments over Central Europe using Meteosat 9 WV6.2 channel. The channel is suitable as it gives an idea of the upper tropospheric humidity (UTH) and gives a view of the upper air dynamics. For the 21st June a sequence of 15 minute images are presented.
Meteosat 9 HRVIS: Time sequence
This chapter will show the HRVIS images of 21st June. Especially with the smaller scale cells the high resolution channel allows us a very good monitoring of the convective development. In a sequence of 15 minutes the satellite images are presented and described.
Meteosat 9 composite WV6.2μm-WV7.3μm; IR3.9μm-IR10.8μm; NIR1.6μm-VIS0.6μm: selected time sequence
In this chapter the convective developments over Central and over South-East Europe is studied using the so-called "severe convection RGB". On red the brightness temperature difference (BTD) of the two water vapour channels 6.2 and 7.3. On green the BTD of the infrared channels 3.9 and 10.8 and on blue the BTD of the two visible channels 1.6 and 0.6, respectively, are pictured.
Meteosat 9 composite WV6.2μm-WV7.3μm; IR9.7μm-IR10.8μm; WV6.2iμm: time sequence
In this chapter the convection is studied using the "Airmass RGB". Unlike the Severe Convection RGB discussed previously this RGB does not use any visible channels making it thus also suitable to detect nighttime convection. The receipe of this RGB is that on red the brightness temperature difference (BTD) of the two water vapour channels 6.2 and 7.3 is pictured. On blue the BTD of the infrared channels 9.7 (Ozone channel) and 10.8 and finally on green WV channel 6.2. Using this channel combination different airmass are recognised. Polar and Tropical Airmass are pictured in blue and green, resp. The WV dark stripes discussed previously are pictured in red.
21 June: Radar
Austrian RadarLarge hail is regularly observed in association with intense thunderstorms (as in this case study) and is often the cause of severe damage on e.g. crops, roofs and cars. Hail is a local phenomenon, in both time and space, so that it can not be easily detected using satellite imagery or with surface observations (since the density is to coarse). Due to its widespatial coverage and relatively fine spatial and temporal resolution, weather radar appears as a valuable tool for the real-time detection of hail (Holleman, 2002). For the 21st June the Radar is shown over Austria in combination with the wind gusts associated to the convective storms.
Austria: 22 June 2007
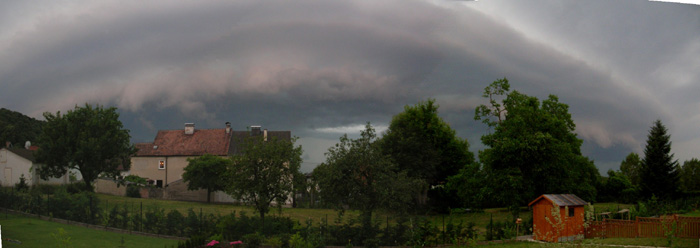
Also on 22nd June Austria was plagued by convection with associated hail reports. In the afternoon hours with an increasing insolation a large MCS develops sweeping over lower Austria. In the this chapter we will look at the different satellite image and describe the processes taking place.
 |
| Roll cloud moving in St. Andrä-Wördern 22nd June 2007: 1500UTC |
22 June: Meteosat 9 Satellite Imagery
Meteosat 9 IR10.8: Time sequenceIn this first set of images the convective developments seen over Austria on 22 June are presented and described using plain Meteosat 9 infrared 10.8 μm. The channel is appropriate as it pictures the ice in high clouds quite clearly. In a sequence of 15 minutes the satellite images are presented and described.
Meteosat 9 Enhanced IR10.8: Time sequence
In this chapter again Meteosat 9 infrared 10.8 μm is shown, but the images have been artificially colour enhanced. This will improve the discrimination of where the evolution from water into ice is taking place during the several convective stages. In a sequence of 15 minutes the satellite images are presented and described.
Meteosat 9 WV6.2: Time sequence
The convective developments over Austria are shown with the help of Meteosat 9 WV6.2 channel. The channel is suitable as it gives an idea of the upper tropospheric humidity (UTH) and gives a view of the upper air dynamics. For the 22nd June a sequence of 15 minute images are presented.
Meteosat 9 HRVIS: Time sequence
This chapter will show the HRVIS images of 22nd June. Especially with the smaller scale cells the high resolution channel allows us a very good monitoring of the convective development. In a sequence of 15 minutes the satellite images are presented and described.
Meteosat 9 composite WV6.2μm-WV7.3μm; IR3.9μm-IR10.8μm; NIR1.6μm-VIS0.6μm: selected time sequence
In this chapter the convective developments over Austria are studied using the so-called severe convection RGB. On red the brightness temperature difference (BTD) of the two water vapour channels 6.2 and 7.3. On green the BTD of the infrared channels 3.9 and 10.8 and on blue the BTD of the two visible channels 1.6 and 0.6, respectively, are pictured.
Meteosat 9 composite WV6.2μm-WV7.3μm; IR9.7μm-IR10.8μm; WV6.2iμm: time sequence
This final chapter presents the Airmass RGB to visualise the convection over Austria.