Interactive overlays: 19th June 2006:00UTC



General information
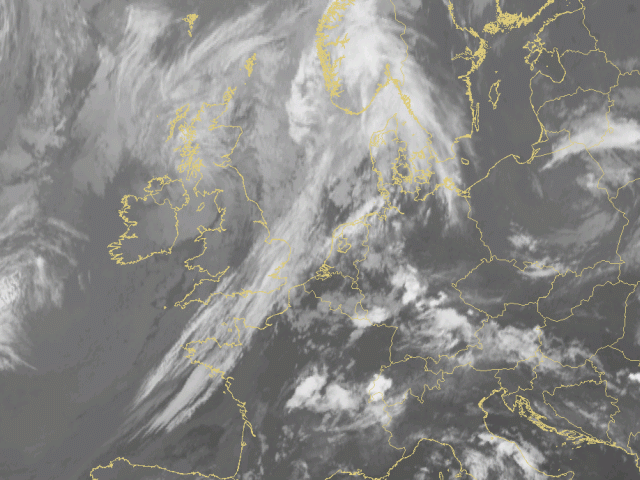
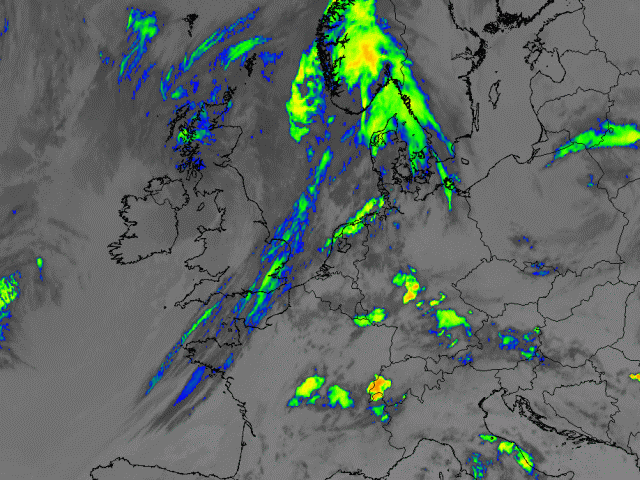
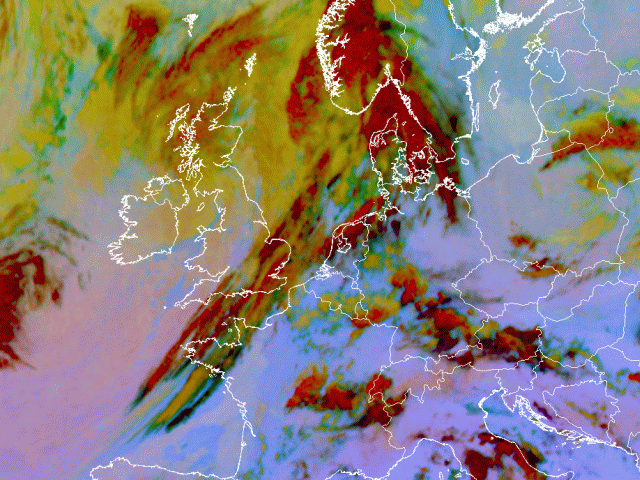
Over Central Europe still some remnant CBs can be seen. They are situated in the warm sector of a frontal depression which lies over the British Isles.
Over Central Europe still some remnant CBs can be seen. They are situated in the warm sector of a frontal depression which lies over the British Isles.
Enhanced IR10.8
The cold cloudtops of the remnant CBs is well visible.
The cold cloudtops of the remnant CBs is well visible.
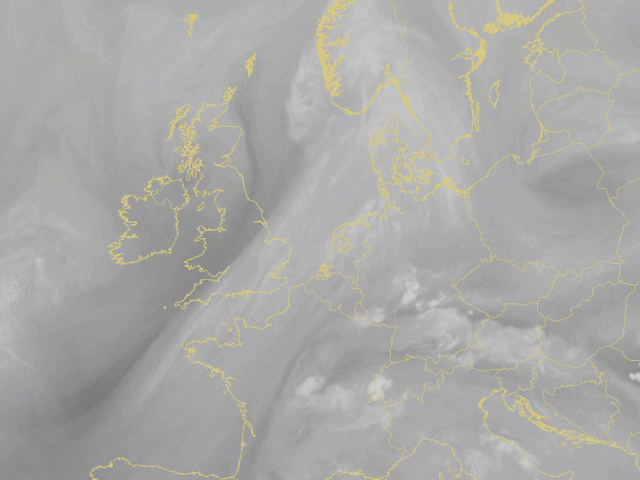
WV6.2
Situated along the boundaries of moist and dry air some remnant CBs are seen over Germany.
Situated along the boundaries of moist and dry air some remnant CBs are seen over Germany.
Airmass RGB
Dust RGB
Severe Convection RGB
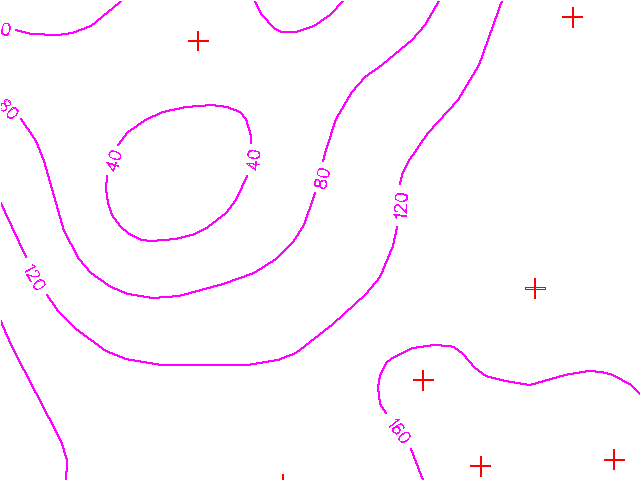
Geopotential Height 1000 hPa.
A surface low marks the location of former tropical storm Alberto. Over Switzerland a ridge of high pressure is found. A cyclonic cloud feature over Poland and Russia is not reflected at the surface.
A surface low marks the location of former tropical storm Alberto. Over Switzerland a ridge of high pressure is found. A cyclonic cloud feature over Poland and Russia is not reflected at the surface.
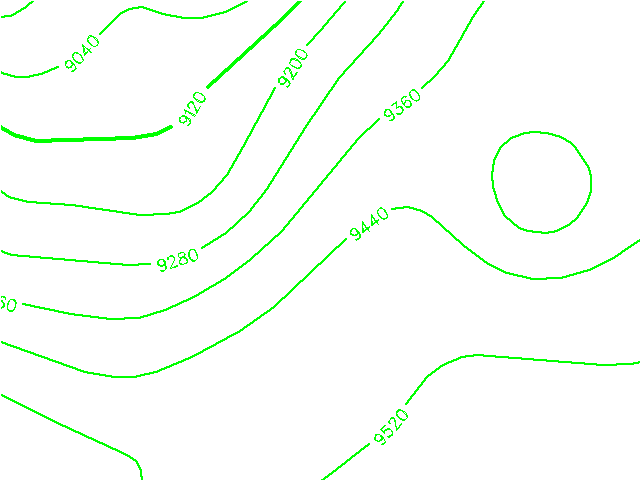
Geopotential Height 300 hPa.
The isolated low at the surface in association to the depression Alberto is not observed over Great Britain at 300 hPa. Instead the isohypsen show a trough with a tighter gradient over the English Channel. Further east over Poland a clear upper level low is observed. This system will slowly wander south east. Situated in a ridge still some remnant CBs are observed over Germany and France.
The isolated low at the surface in association to the depression Alberto is not observed over Great Britain at 300 hPa. Instead the isohypsen show a trough with a tighter gradient over the English Channel. Further east over Poland a clear upper level low is observed. This system will slowly wander south east. Situated in a ridge still some remnant CBs are observed over Germany and France.
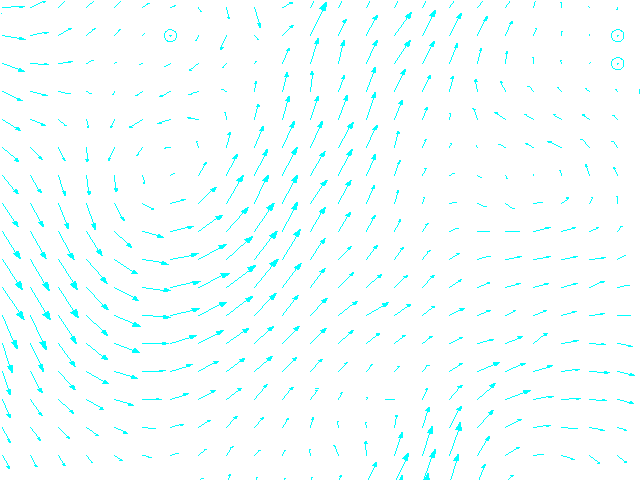
Wind 850 hPa.
Most of the convection is governed by high pressure and therefore anticyclonic flow in the warm sector. This is also seen in these wind vectors at 850 hPa.
Most of the convection is governed by high pressure and therefore anticyclonic flow in the warm sector. This is also seen in these wind vectors at 850 hPa.
Thermal Front Parameter and Equivalent Thickness
In the image the thermal front parameter (blue) and the relative topography (green) are superimposed on IR10.8 imagery. Remarkable is that there is no TFP indicated in the model over the Cold Front situated over Normandy, Bretagne and further north over Engaland and the North Sea. Over Germany some TFP maxima are observed over the remnant CBs. The thermal advection induced by the rising motions is most likely causing this strong signal in the TFP. The thickness ridge over Central Europe in the warm sector is well pronounced.
In the image the thermal front parameter (blue) and the relative topography (green) are superimposed on IR10.8 imagery. Remarkable is that there is no TFP indicated in the model over the Cold Front situated over Normandy, Bretagne and further north over Engaland and the North Sea. Over Germany some TFP maxima are observed over the remnant CBs. The thermal advection induced by the rising motions is most likely causing this strong signal in the TFP. The thickness ridge over Central Europe in the warm sector is well pronounced.
Temperature Advection 700 hPa.
Apart from the remnant CBs where we see CA at 700 hPa and a negative horizontal transport of warm air, most of the warm sector is characterised by warm air advection.
Apart from the remnant CBs where we see CA at 700 hPa and a negative horizontal transport of warm air, most of the warm sector is characterised by warm air advection.
Showalter Index
This index gives a good indication where the atmosphere is unstable and where convective development may be expected. A Showalter index between 1 and 4 gives the indication that thunderstorms are possible but that a trigger is still needed. From this treshold downward the chance on thunderstorms increase. Values under –3 are associated to very heavy thunderstorms. In this set of images the treshold of Showalter Index = 0 is pictured using the pink line. This allow an easy discrimination of the potential convective areas. Such an area can be seen here stretched over central Europe. Over the Alps (a region where convergence will be seen) the SI is even below –3.
This index gives a good indication where the atmosphere is unstable and where convective development may be expected. A Showalter index between 1 and 4 gives the indication that thunderstorms are possible but that a trigger is still needed. From this treshold downward the chance on thunderstorms increase. Values under –3 are associated to very heavy thunderstorms. In this set of images the treshold of Showalter Index = 0 is pictured using the pink line. This allow an easy discrimination of the potential convective areas. Such an area can be seen here stretched over central Europe. Over the Alps (a region where convergence will be seen) the SI is even below –3.
ThetaE 850 hPa.
High Theta-E values are an indication for instability. A Theta-E ridge or tongue is often the burstpoint for convective activity. A pronounced Theta-E maximum is found over Germany. Its instability is reflected in IR10.8 by some Cbs. Further south a secondary maximum gives indication of an unstable atmosphere over Switzerland.
High Theta-E values are an indication for instability. A Theta-E ridge or tongue is often the burstpoint for convective activity. A pronounced Theta-E maximum is found over Germany. Its instability is reflected in IR10.8 by some Cbs. Further south a secondary maximum gives indication of an unstable atmosphere over Switzerland.
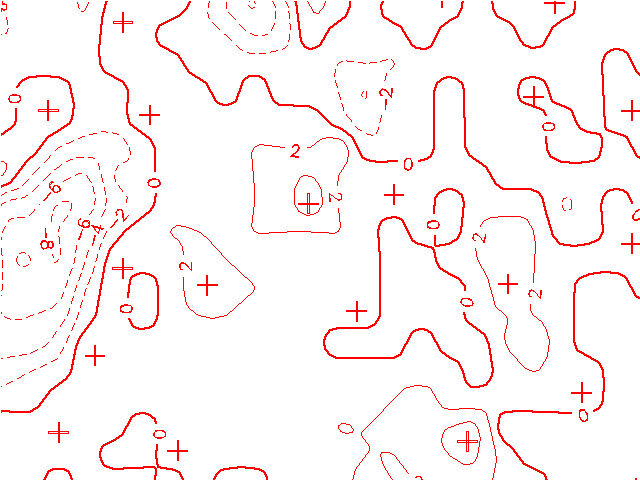
Divergence 925 hPa.
The divergence is pictured as the dashed lines in this set of image. Solid is the convergence and that is what we are after in these images as they show near the surface where there is rising motions and where there is convection. Over Germany, France and Austria remnant CBs are marked by convergence and rising motions.
The divergence is pictured as the dashed lines in this set of image. Solid is the convergence and that is what we are after in these images as they show near the surface where there is rising motions and where there is convection. Over Germany, France and Austria remnant CBs are marked by convergence and rising motions.
Divergence 700 hPa.
In this image the convergence (solid) and divergence (dashed) from the Aladin model are superimposed on Meteosat 8 IR10.8 imagery. Over Germany and Austria some remnant CBs are marked by outflow and divergence at 700 hPa.
In this image the convergence (solid) and divergence (dashed) from the Aladin model are superimposed on Meteosat 8 IR10.8 imagery. Over Germany and Austria some remnant CBs are marked by outflow and divergence at 700 hPa.