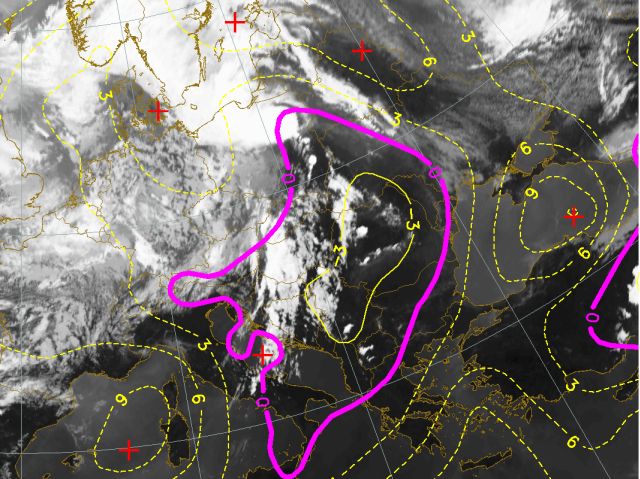
9th July 2004: 12UTC
In this chapter the IR10.8 images are overlaid with the Showalter index. It gives a good indication where the atmosphere is unstable and where convective development may be expected. Showalter indices between 1 and 4 give the indication that thunderstorm are possible but that a trigger is still needed. From this threshold downward the chance on thunderstorms increases. Values under –3 are associated to very heavy thunderstorms. In this set of images the threshold of Showalter Index = 0 is pictured using the pink line. This allows an easy discrimination of the potential convective areas. Such an area can be seen here stretched over the Eastern Europe. Locally we see values of below -3 where convection has already started (Carpathian Mountains).
9th July 2004: 18UTC
Extreme values are still found over Rumania and Bulgaria where the Showalter Index has minima under -3. That the atmosphere is unstable here is also immediately visible in the IR imagery with the cold bright cloud tops indicating where the convectivity is found.
10th July 2004: 00UTC
With the front slowly drifiting eastward we see extreme values of a negative Showalter Index over Rumania and Ukraine. SI has minima under -3 (and locally -6). That the atmosphere is extremely unstable here is also immediately visible in the IR imagery with the numerous MCSs observed.
10th July 2004: 06UTC
The frontal system slowly moves east and so does the level of convection. Still a large unstable region with Showalter Index under 0 and -3 is seen over Bulgaria, Romania and Ukraine. Within the Showalter Index a ridge is recognised that marks the position of the warm sector between cold and warm front.
10th July 2004: 12UTC
Over the Carpathian Mountains the onset of the rapid convective development is about to start. The ground for this rapid development is also spotted by the SI with values of -6 indicating an extremely unstable situation in which convective development is inevitable.
10th July 2004: 18UTC
From Bulgaria up north far in to Ukraine large MCSs are recognised. The region is marked by a Showalter Index of -3 indicating the unstable conditions.
11th July 2004: 00UTC
From Rumania to Ukraine a large MCS is recognised. It is marked by a Showalter Index of -3 indicating the unstable conditions.