Interactive overlays: 9th July 2004:12UTC
General information
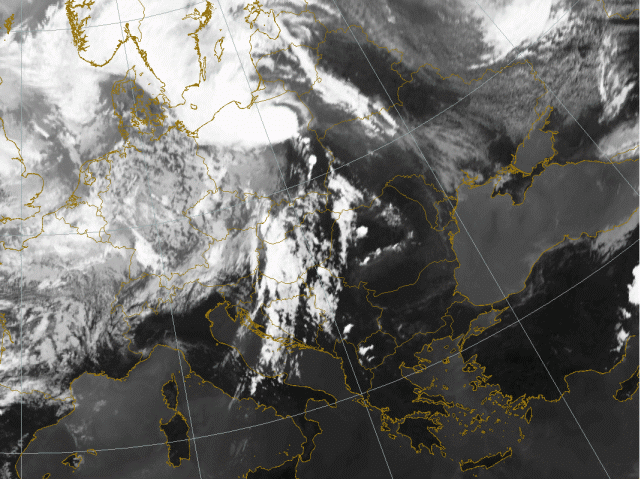
Also in this IR10.8 image without any enhancements the thunderclouds can be seen over Poland and more to the south over Hungary and Slovakia. Bot of these MCS systems will wander of to Ukrain.
Also in this IR10.8 image without any enhancements the thunderclouds can be seen over Poland and more to the south over Hungary and Slovakia. Bot of these MCS systems will wander of to Ukrain.
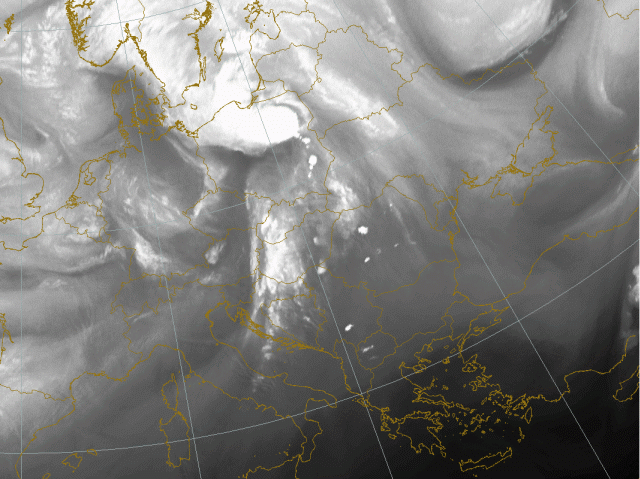
WV6.2
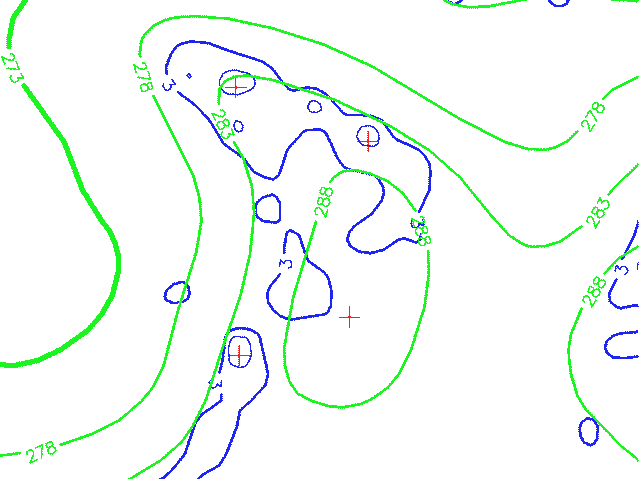
Geopotential Height 1000 hPa.
A depression is located over the northern part of Central Europe. Further south over the Balkan area some convective activity is observed. A closer look reveals over the Carpathian Mountains the onset to more convection. Over Ukrain the flow is dominantly cyclonic. More to the south a ridge of high pressure is observed.
A depression is located over the northern part of Central Europe. Further south over the Balkan area some convective activity is observed. A closer look reveals over the Carpathian Mountains the onset to more convection. Over Ukrain the flow is dominantly cyclonic. More to the south a ridge of high pressure is observed.
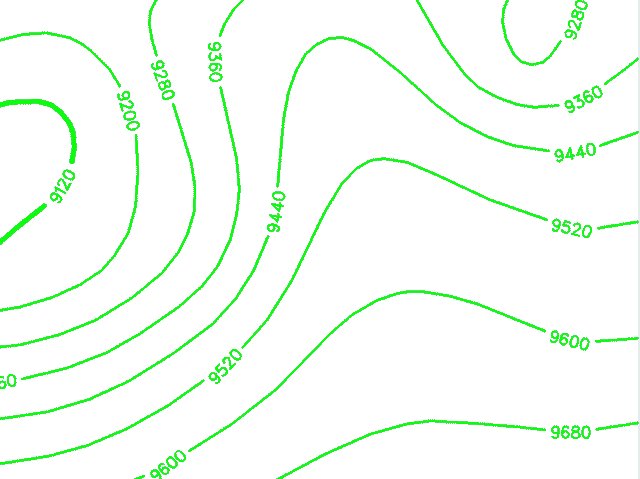
Geopotential Height 300 hPa.
Eastern Europe is under influence of anticyclonic flow and int he isophypses a large fontal system is observed. Most of the convection is seen at the front side of an upper level trough.
Eastern Europe is under influence of anticyclonic flow and int he isophypses a large fontal system is observed. Most of the convection is seen at the front side of an upper level trough.
Thermal Front Parameter and Equivalent Thickness
The thermal front parameter (blue) and equivalent thickness are discussed. In the first image a frontal system can be seen over eastern Europe. The cold front is situated over the Adriatic Sea, Croatia, Slovenia, Hungary and further north into Poland. The warm front is harder to discriminate just from clouds and model and was from the surface analysis placed over Finland. The occlusion point is consisting of a large convective system. Further south where a thickness ridge is seen in the warm sector between cold and warm front also numerous isolated and some large convective cells are observed.
The thermal front parameter (blue) and equivalent thickness are discussed. In the first image a frontal system can be seen over eastern Europe. The cold front is situated over the Adriatic Sea, Croatia, Slovenia, Hungary and further north into Poland. The warm front is harder to discriminate just from clouds and model and was from the surface analysis placed over Finland. The occlusion point is consisting of a large convective system. Further south where a thickness ridge is seen in the warm sector between cold and warm front also numerous isolated and some large convective cells are observed.
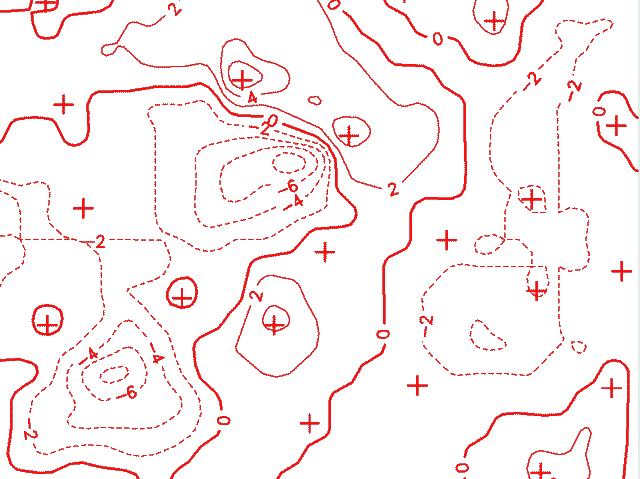
Temperature Advection 700 hPa.
In this first image we see the frontal system that is cyclonically curved over eastern part of Europe. Western and Central Europe is marked by distinct cold air advection maxima. The cold front part and also the occluded cloud band are marked by pronounced WA maxima. These maxima may slightly contribute to the upward motion and convection.
In this first image we see the frontal system that is cyclonically curved over eastern part of Europe. Western and Central Europe is marked by distinct cold air advection maxima. The cold front part and also the occluded cloud band are marked by pronounced WA maxima. These maxima may slightly contribute to the upward motion and convection.
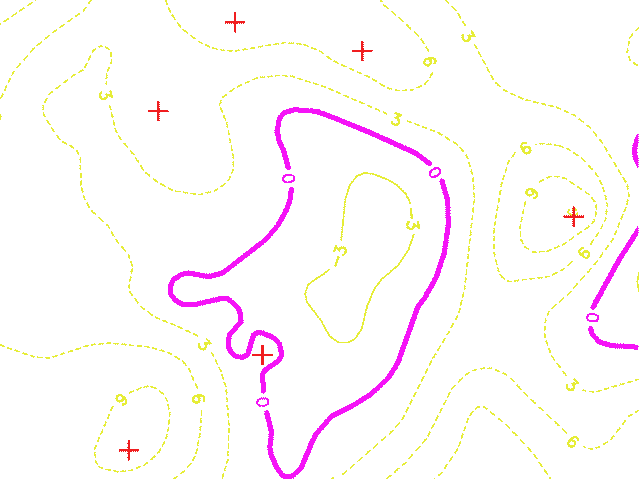
Showalter Index
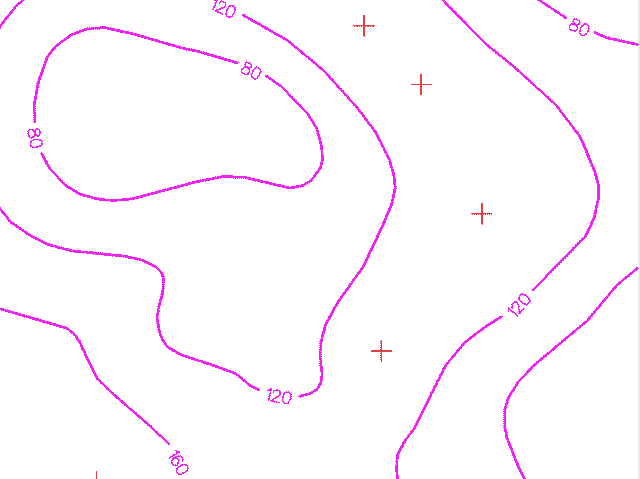
The Showalter index gives a good indication where the atmosphere is unstable and where convective development may be expected. Showalter indices between 1 and 4 give the indication that thunderstorm are possible but that a trigger is still needed. From this threshold downward the chance on thunderstorms increases. Values under –3 are associated to very heavy thunderstorms. In this set of images the threshold of Showalter Index = 0 is pictured using the pink line. This allows an easy discrimination of the potential convective areas. Such an area can be seen here stretched over the Eastern Europe. Locally we see values of below -3 where convection has already started (Carpathian Mountains).
The Showalter index gives a good indication where the atmosphere is unstable and where convective development may be expected. Showalter indices between 1 and 4 give the indication that thunderstorm are possible but that a trigger is still needed. From this threshold downward the chance on thunderstorms increases. Values under –3 are associated to very heavy thunderstorms. In this set of images the threshold of Showalter Index = 0 is pictured using the pink line. This allows an easy discrimination of the potential convective areas. Such an area can be seen here stretched over the Eastern Europe. Locally we see values of below -3 where convection has already started (Carpathian Mountains).
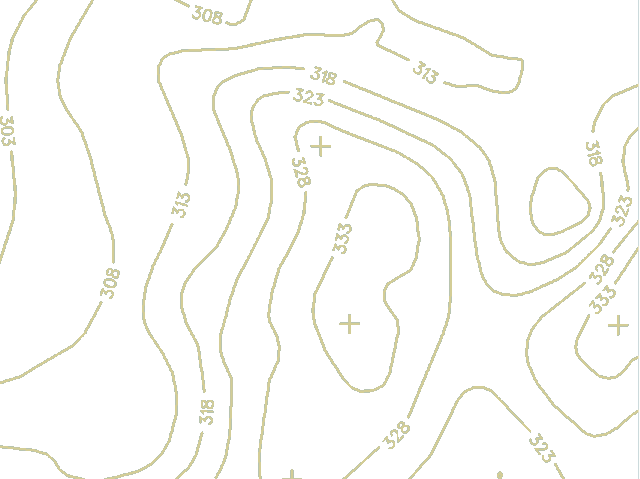
ThetaE 850 hPa.
High theta-E values are an indication for instability. A theta-E ridge or tongue is often the burst point for convective activity. A pronounced theta-E maximum is found over Southeastern Europe indicating high danger for TS development (value of 333K!). The convergence and its instability are already reflected in IR10.8 by some Cbs.
High theta-E values are an indication for instability. A theta-E ridge or tongue is often the burst point for convective activity. A pronounced theta-E maximum is found over Southeastern Europe indicating high danger for TS development (value of 333K!). The convergence and its instability are already reflected in IR10.8 by some Cbs.
Surface Observation
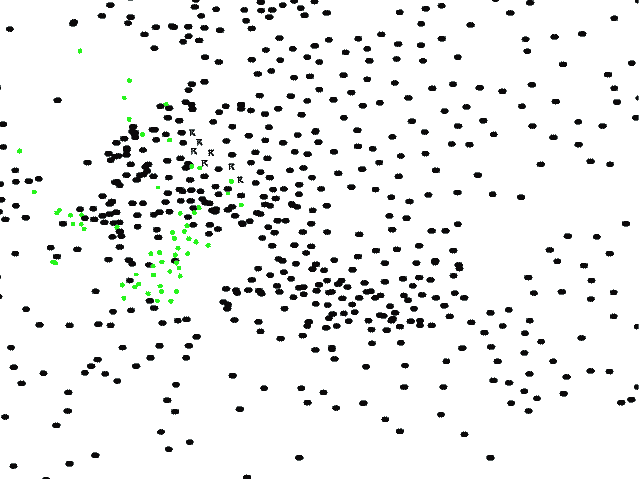
Rain (green dots) and thunderstorms are observed over central Europe and are found just behind the frontal system.

Rain (green dots) and thunderstorms are observed over central Europe and are found just behind the frontal system.
