Description of products and tools
Observations
In the wind journal you can see the average wind speed, wind gusts in the moment of observation (50th minute) and maximum of gusts observed in that hour respectively. So a line of numbers 4-8-9 means that the average wind is 4 m/s, the gusts at the 50th minute are 8 m/s, but maximum wind gusts in that hour are 9 m/s. Wind directions in Latvian are shown in the image and written down below.
North = Z; East = A; South = D; West = R
In the Minute data you can see the observations in 30 surface observation station around Latvia. You can observe air temperature, wind direction, mean wind speed and wind speed in gusts, relative humidity, atmospheric pressure and at some stations even visibility.
METAR data is available every 30 minutes, while SYNOP data is available with 3 hour time step.
NWP model data
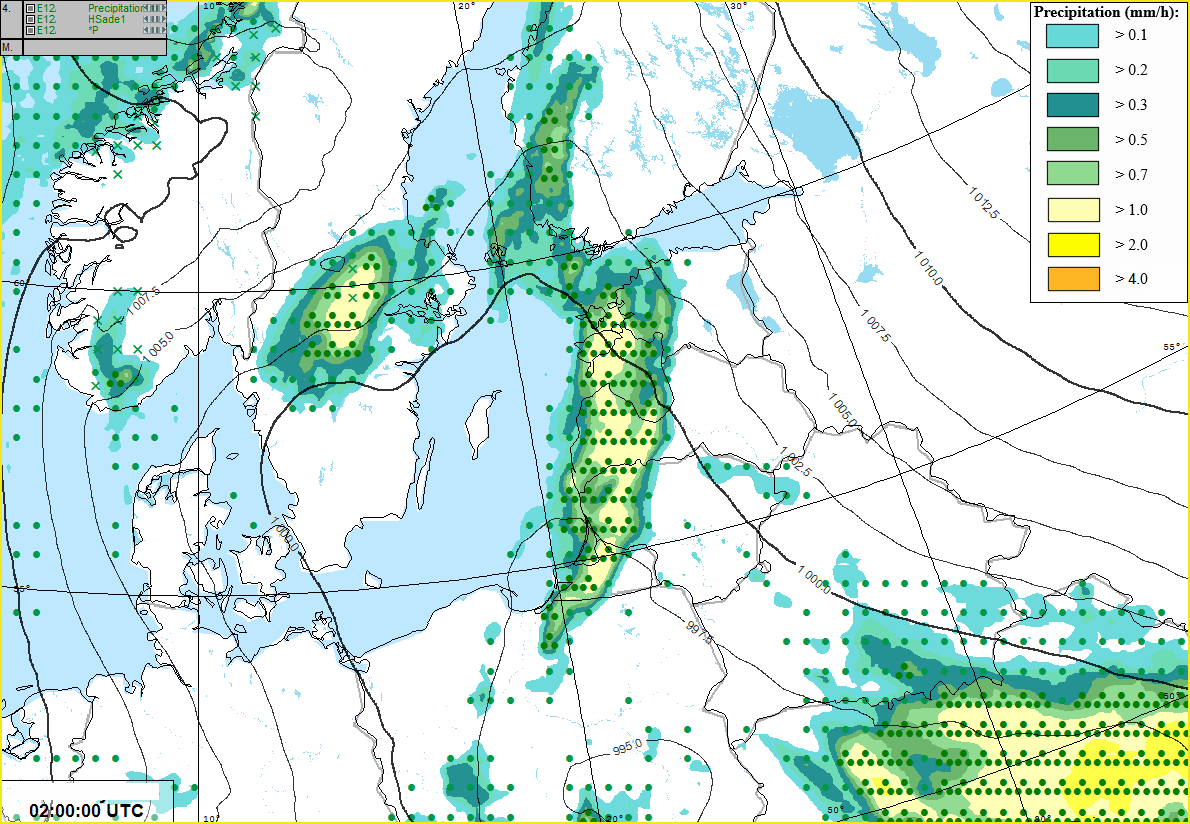
The model data provided are available for different regions. ECMWF data shows a wider region around Latvia, while Hirlam data is more detailed and shows only Baltic States. The horizontal resolutions for ECMWF is 9 km and for Hirlam it is 7.5 km.
 |
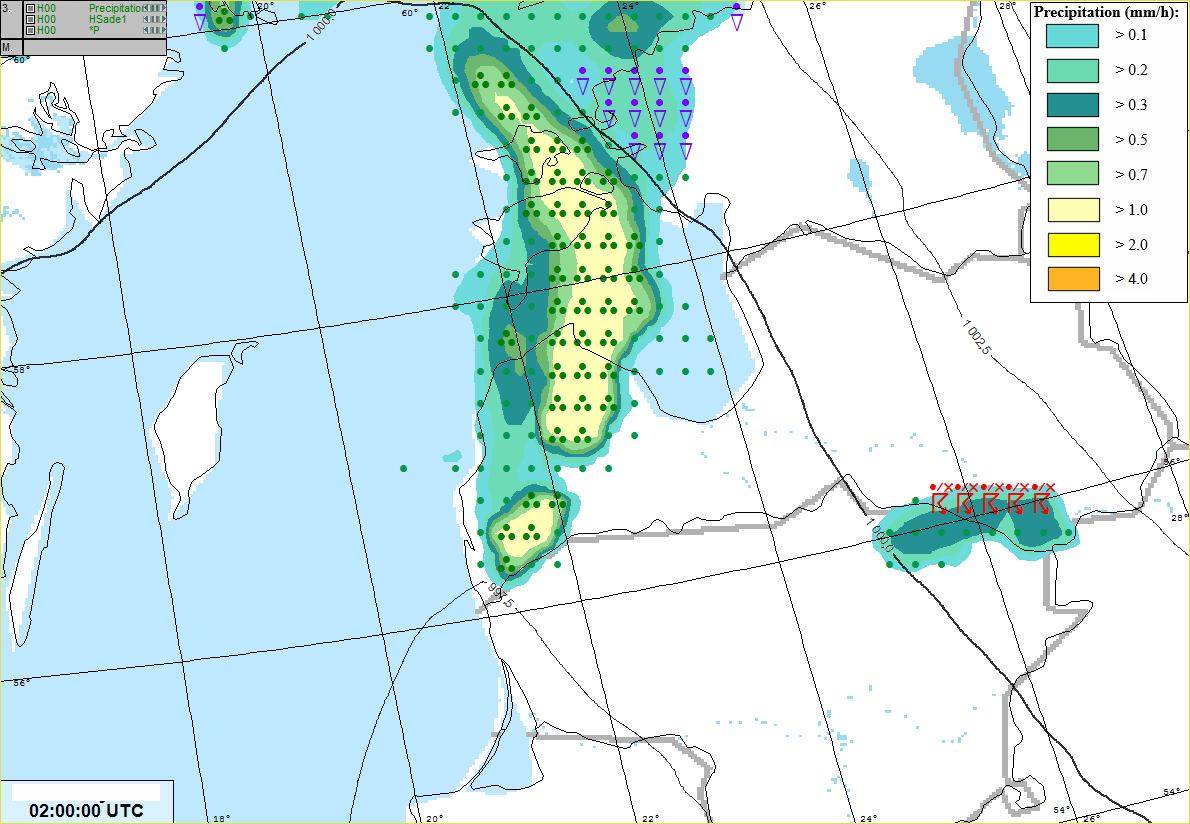 |
Figure 1: NWP model data, left ECMWF, right Hirlam
Frontal analysis
There are 2 frontal analysis available. AVIO surface charts are more local and drawn by an aviation forecaster, while General maps are made by general forecasters and they are with a lot bigger surface area.
 |
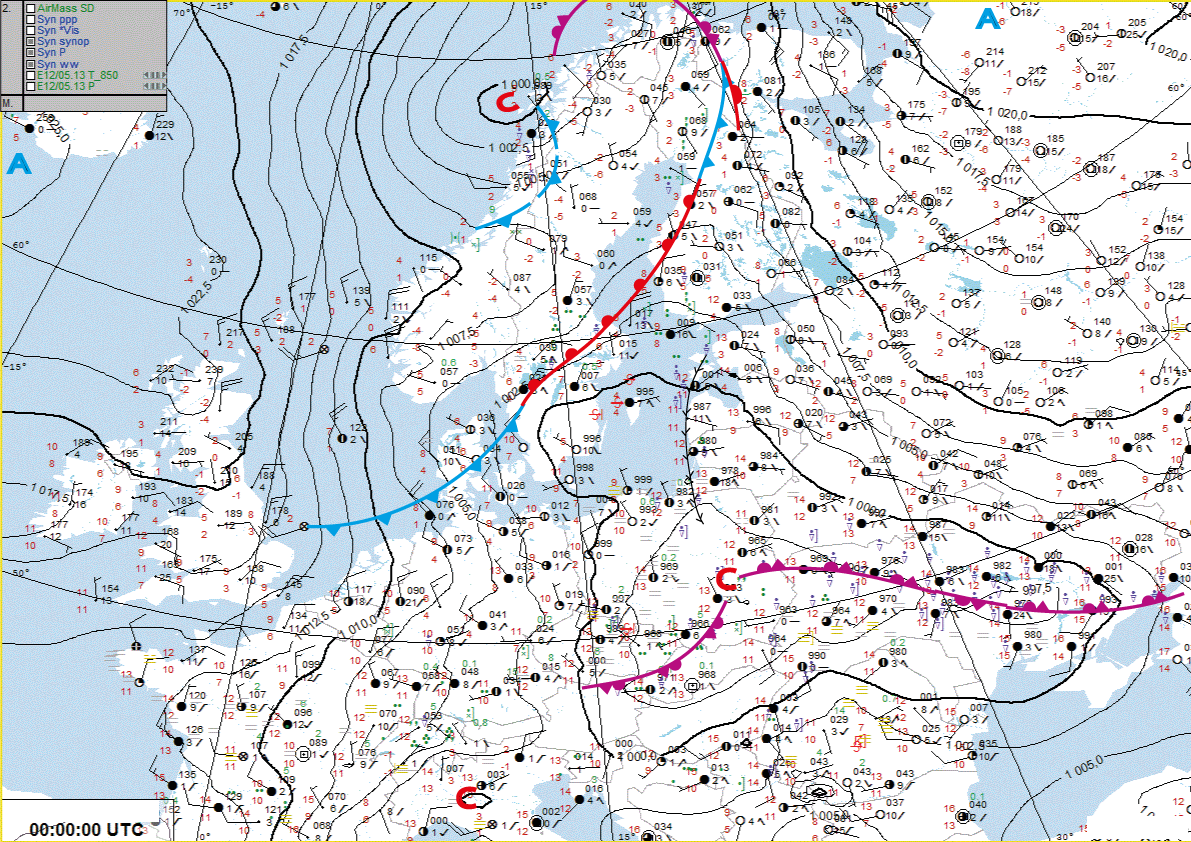 |
Figure 2: Surface analysis, left aviation surface analysis, right general surface analysis
ePort data
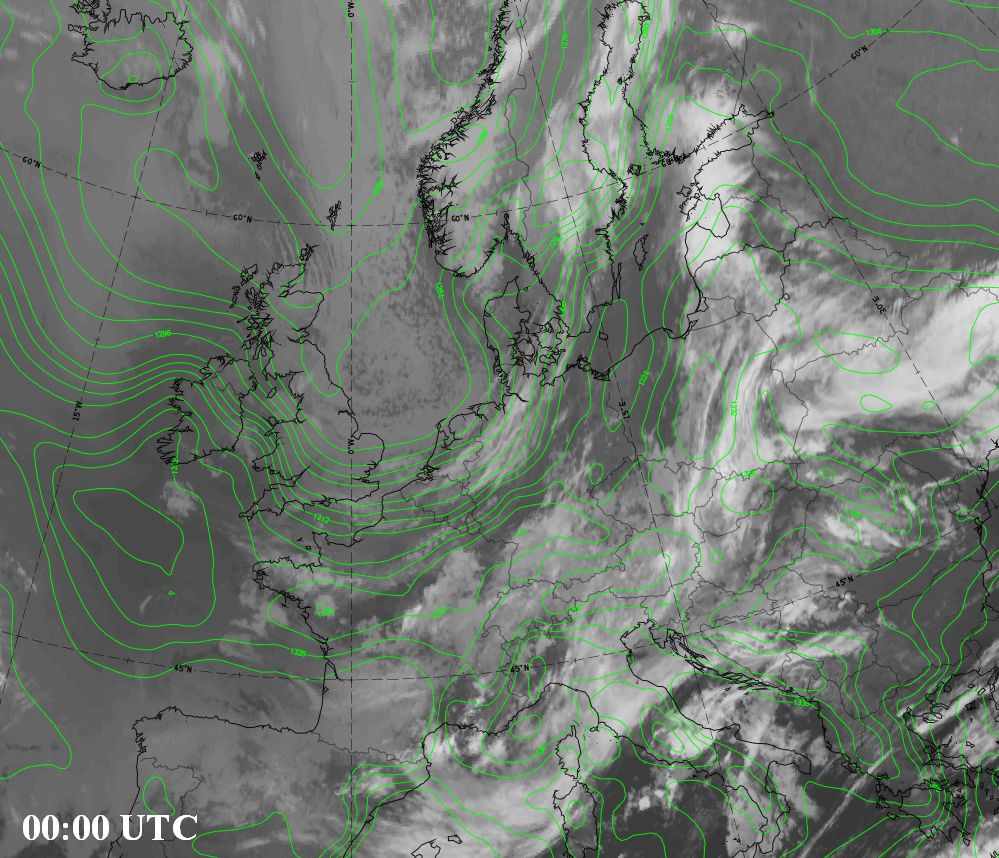
In the weather simulator EUMeTrain ePort archive data has been used. You can view different satellite images in combination with NWP data and parameters. There will be an update to the images at 06:00 UTC.
 |
 |
Figure 3: ePort data, left equivalent thickness, right isotachs
Radar data
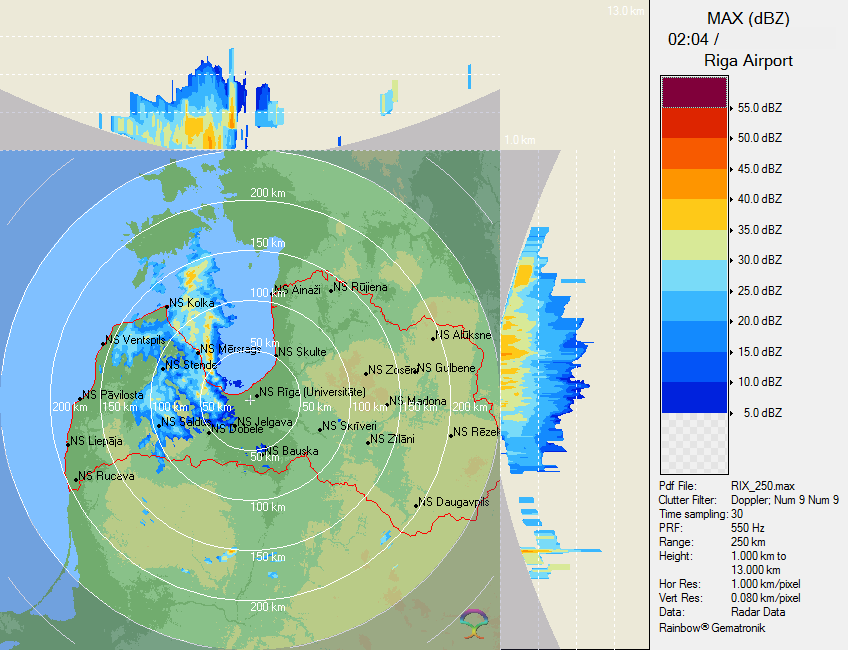
There are many radar products provided in the weather simulator. The radar is located 1-3 km from the airport Riga and around 10 km from the Riga city centre. So the centre of the radar images can be assumed as the place for airport Riga. It is a C-band radar, which covers the territory of Latvia and also northern part of Lithuania and southern part of Estonia. The radar images will refresh every 10 minutes.
 |
 |
Figure 4: Radar data, left MAX, right SWAD
Satellite data
For satellite data application you can look at RGB quick guides given in the link below.
* - Take notice that Water Vapor (6.2) images are inverted. That means, that the darker colors show more water vapor content. So light colors show dry regions.
http://www.eumetrain.org/rgb_quick_guides/index.html
Lightning data
In the weather simulator for the lightning data Blitzortnung.org archive data has been used. It will update every 10 minutes, and the colors represent the time - how long ago the specific lightning was registered.
WAREP journal
Warep is a regional coding for Warning report of the actual occurrence of hazardous weather phenomena.
In this case Warep can be received from seven observation stations all around Latvia - Rīga, Alūksne, Daugavpils, Skrīveri, Dobele, Liepāja, Ventspils.
* TECHNICAL NOTE: For the best interactive experience throughout this module please use the most recent versions of Firefox or Internet Explorer browser!