Before we start
This simulator is more complex than the other ones, because it is not only a meteorological simulator but also involves a hydrological component. Here you can see how the weather predictions and situations affect other services and why there is a need for close collaboration. In an ideal situation, you as a meteorologist would be paired up with a hydrologist, but since there might be no such possibility, you will get some basic information on hydrological data in the introduction.
Weather situation before October 15th
A few days before today's exercise, there was a rainy episode caused by a cyclone (figure 1). You can take a look at the amount of precipitation in the images below.
Figure 1: Surface analysis of synoptic situation on October 10th. There is a well defined cyclone above Italy with a warm front over Croatia.
Use the mouse cursor to slide through images.
Figure 2, a)-d): 24h precipitation amounts during the last four days (11 October - 14 October)
Hydrological data - Product explanation
1. South East Europe Flash Flood GuidanceSystem (SEEFFGS)
Current situation:
Merged Mean Areal Precipitation
Catchment accumulated rainfall in the last 6 hours. It is based on satellite data (Microwave-adjusted Global Hydroestimator and Global Hydroestimator) and the data from meteorological stations.
Take a look at the data for the previous day. There is a legend on the right side of the image. If there was no rain the catchment will be white.
Use the mouse cursor to slide through images.
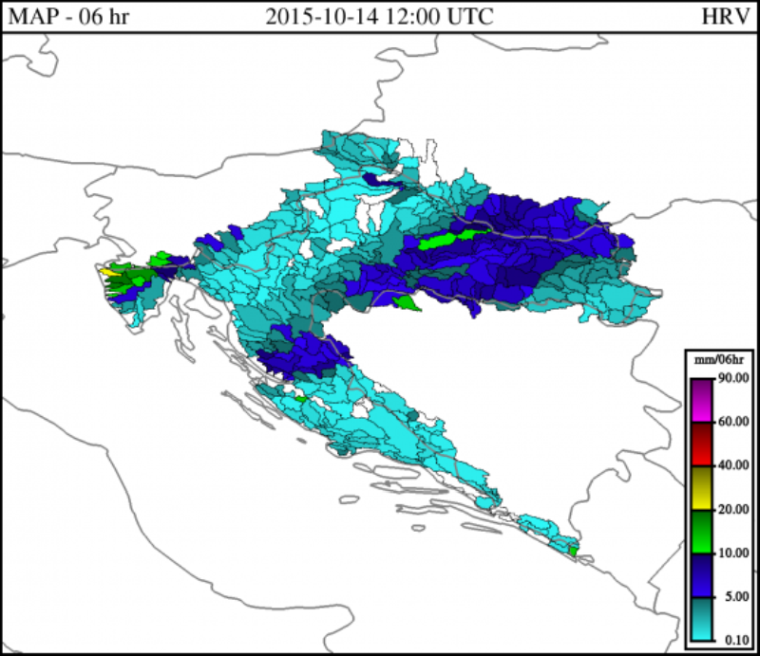
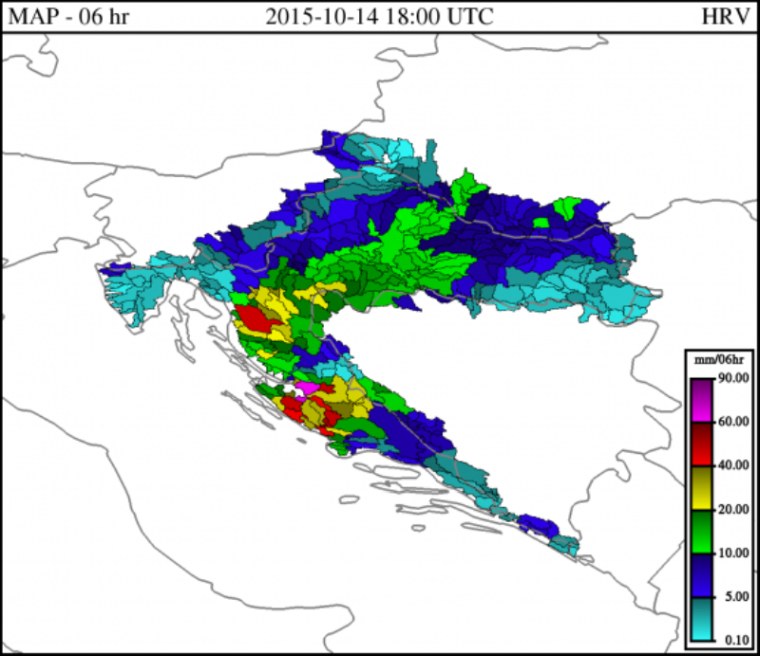
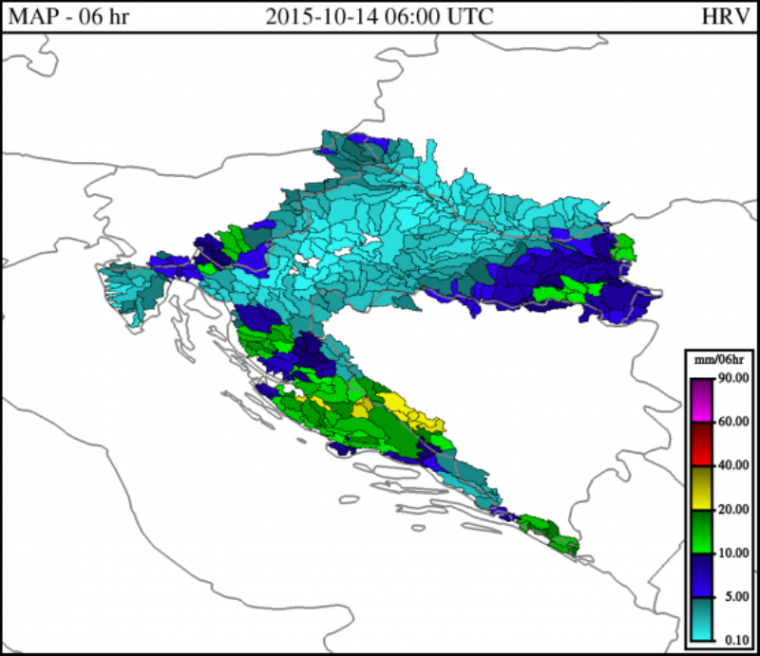
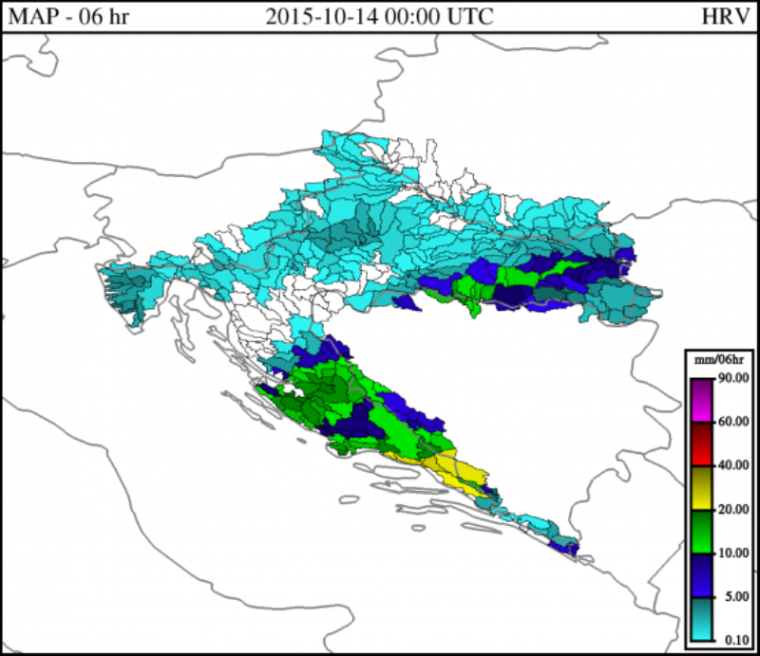
Figure 3 a)-d): Catchment accumulated rainfall in the last 6 hours on October 14th
Average Soil Moisture
Average Soil Moisture is a result of the Sacramento model. It shows soil moisture in the last 6 hours before the time of the image. To get familiar with the product, please take a look at the data provided for the day before. There is a legend on the right side of each image showing saturation of a catchment. Gray means dry, while the darkest blues shows almost completely or completely saturated catchment.
Use the mouse cursor to slide through images.
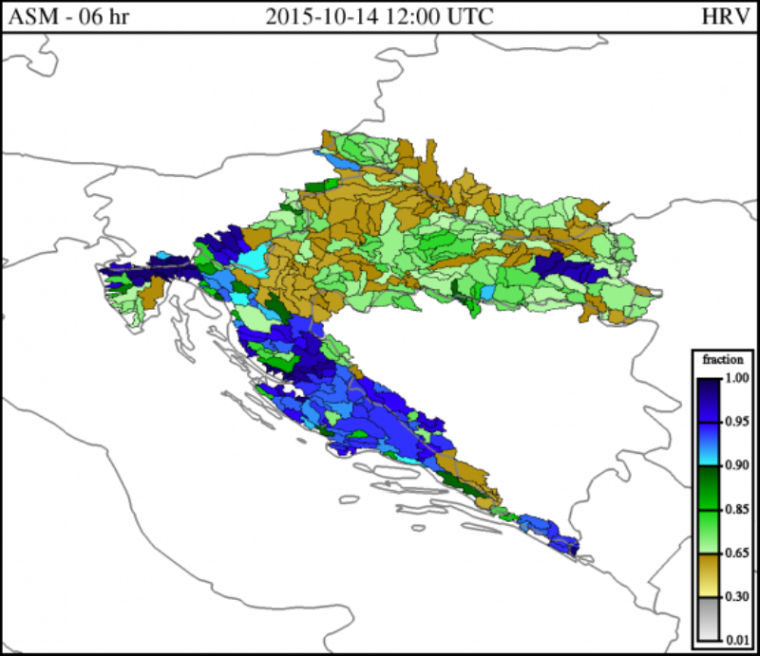
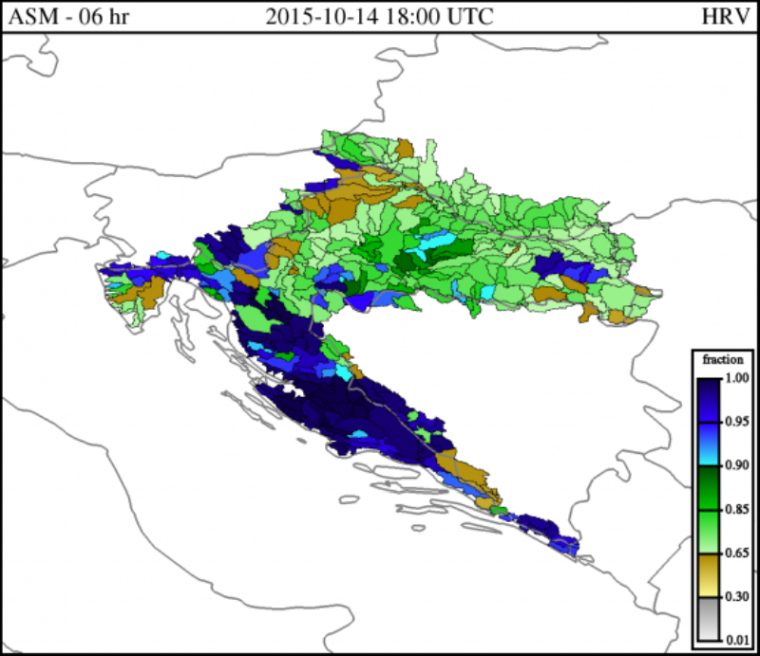
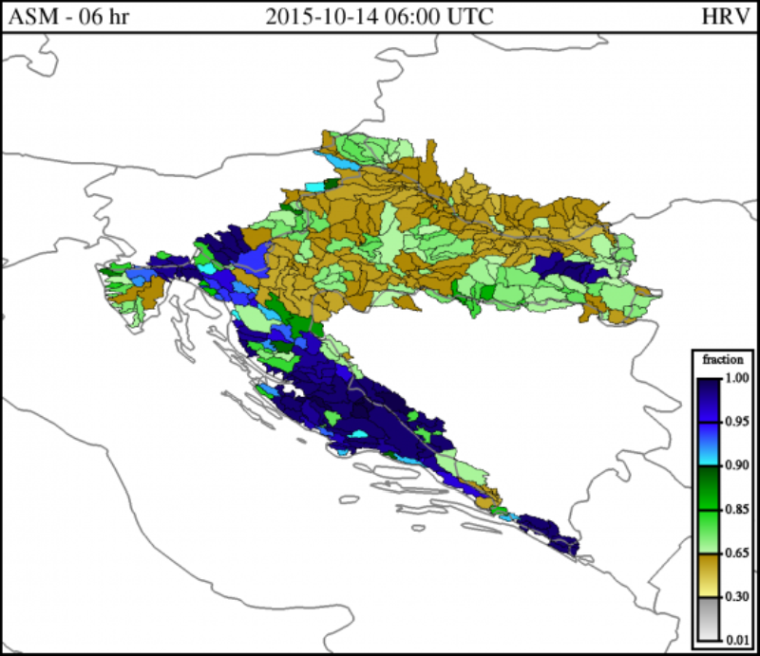
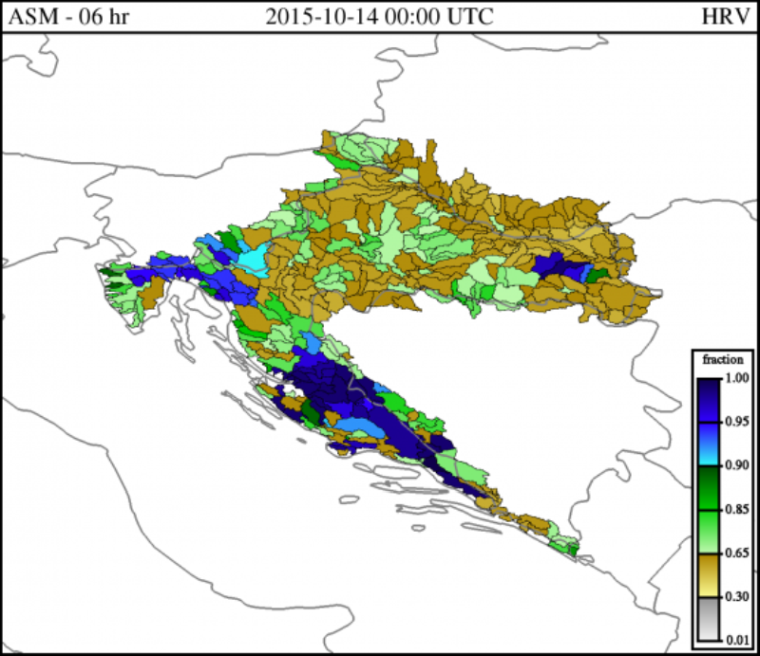
Figure 4, a)-d): Average soil moisture for catchments on October 14th
Forecasts:
Forecast Mean Areal Precipitation
Forecast of the mean areal precipitation for each catchment is based on Aladin model. It provides forecast 6 hours in advance. The same legend is used as for Merged Mean areal precipitation (figure 3).
EFAS (European Flood Awareness System) forecast
Flash flood forecast for the next 120h. Big purple triangle shows the probability of exceeding a 20 year return period magnitude of the surface runoff index, for the forecasted start of the event is in < 72 hours. It is calculated every 12 hours.
|
|
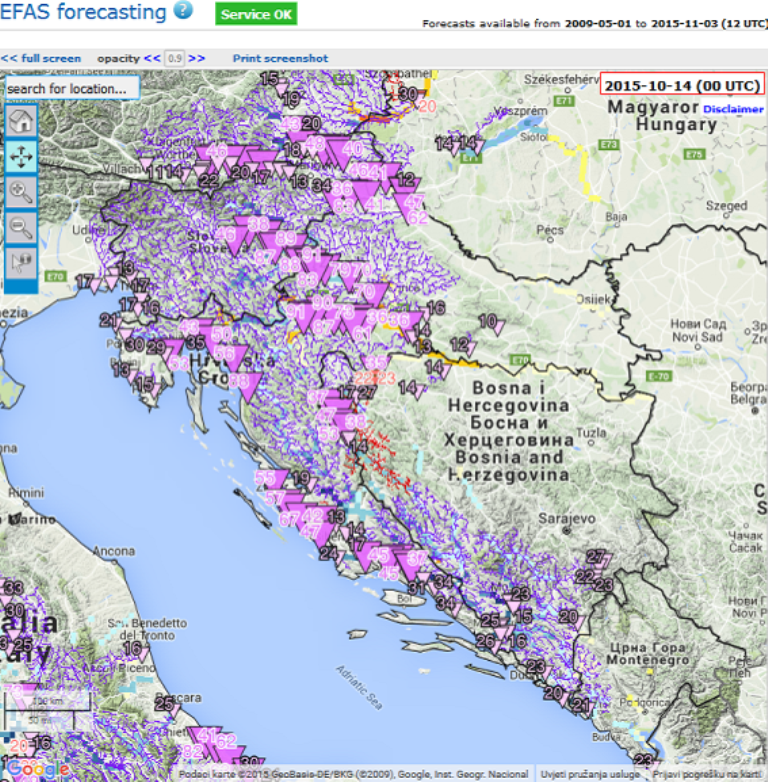
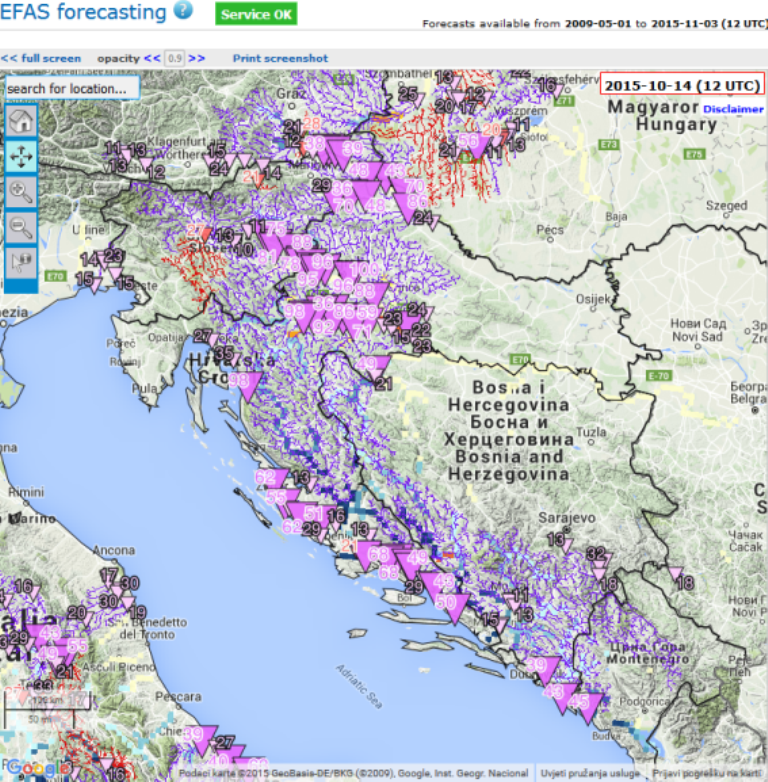
Figure 5: Flash flood forecast on October 14th for 00 UTC and 12 UTC
Different river tributaries are colored according to the return period:
- Red - a return period >5 and <20 years. Significant flooding is expected.
- Yellow - a return period >2 and <5 years. Bankfull conditions or slightly higher expected. If flooding occurs no significant damages are expected.
- Blue - a return period >1.5 years and <2 years. Water levels higher than normal or up to bankfull conditions but no flooding is expected.
The river banks are colored according to river level legend (figure 6)
DHMZ's Sava river catchment operational hydrological forecast
There is also a forecast model developed in DHMZ and Croatian Waters for river discharges and water level for the Sava catchmentin Croatia.
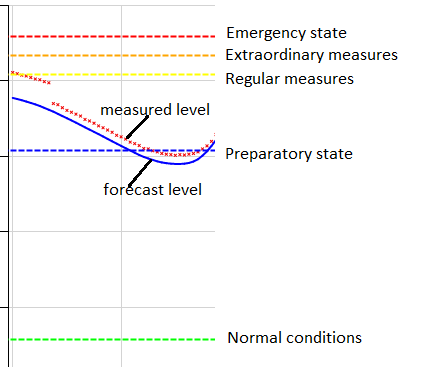
Figure 6: River water level forecast
Forecasting area
The forecasting area is shown below (figure 7). City of Karlovac lays on 4 rivers Dobra, Kupa, Korana and Mrežnica. In this exercise two of them, Kupa and Korana (figure 8) are of interest to us.
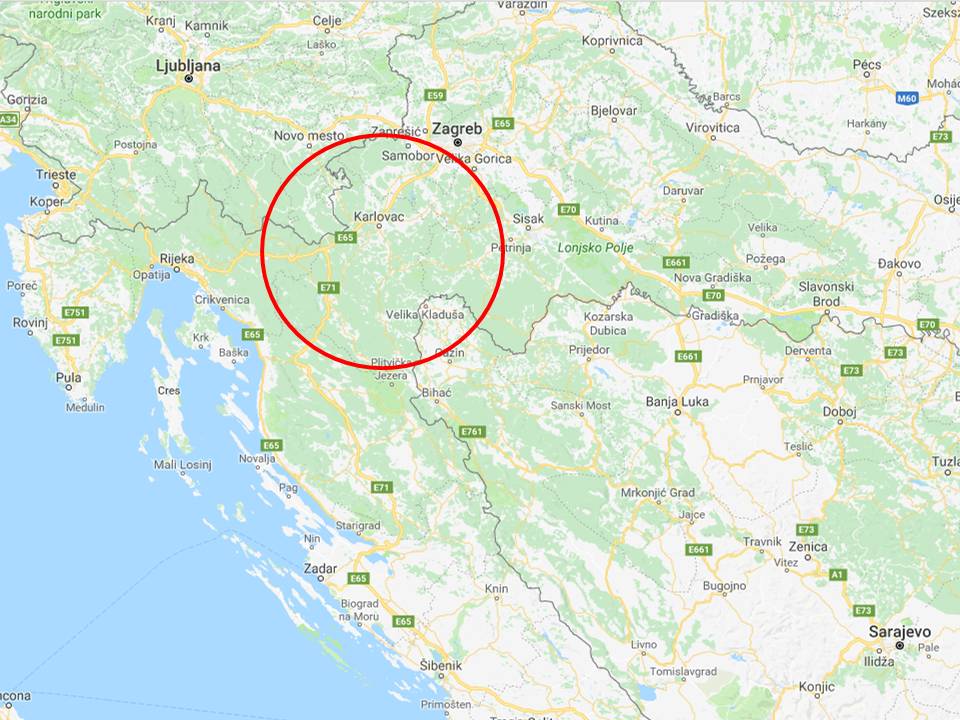
Figure 7: Area of interest of the simulator
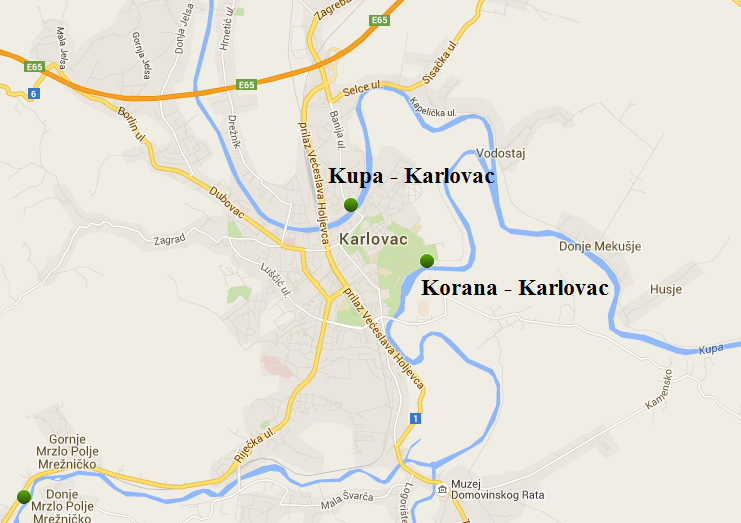
Figure 8: Rivers Kupa and Korana flow through Karlovac
* TECHNICAL NOTE: For the best interactive experience throughout this module please use the most recent versions of Firefox or Internet Explorer browser!