Motivation
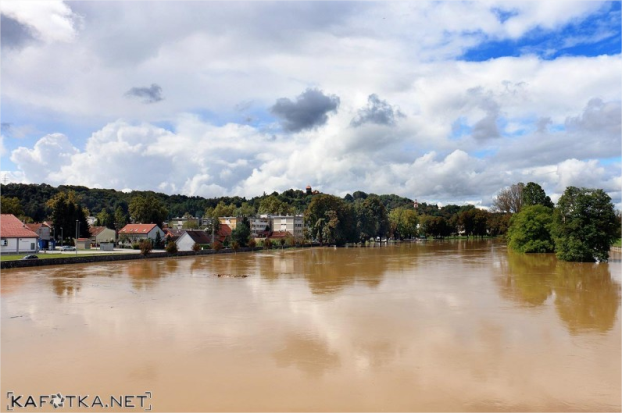
Since Karlovac city lays on four rivers, it is very vulnerable to floods. High river levels are becoming more common and there was even flooding a year before, in 2014, therefore this situation was closely watched by hydrologists and meteorologists but also by general public.
|

|
Figure 1 and 2: River Kupa in Karlovac in 2014 (left) and Karlovac in 2015 (right)

|

|
Figure 3 and 4: Korana in 2015
|
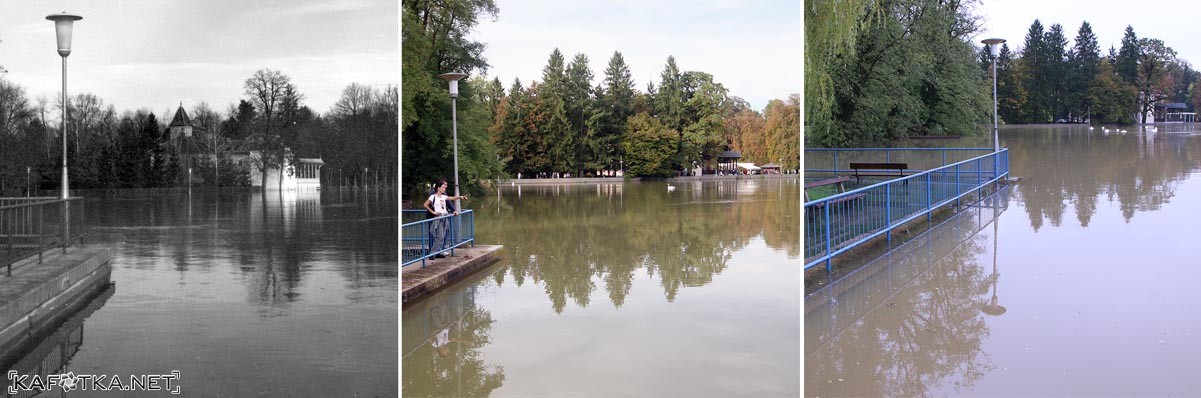
Figure 5: Comparison of flood situation on Korana in 1966 (left), 2014 the middle and 2015 (right)
After a longer time period with heavy rain there was an indication for flooding possibility and the flood alert siren was activated on October 15th at 20:00. Government and the civil service were well informed days ahead so they were well prepared, and since there was flooding a year before, the residents knew what to do and how to prepare. Firefighters and soldiers were at most endangered areas building damps with sand bags and pumping out water.
What happened?
Synoptic situation
Almost the whole European continent was under anticyclonic influence. Meanwhile above Croatia there was a shallow, semi stationary cyclone that persisted for a few days before and after the flooding(figure 6).
Figure 6: Surface synoptic analysis, October 15th, 2015 at 6 UTC
In the upper levels of the atmosphere (figure 7), the northeastern Europe is under the influence of a ridge. On the other hand, over the central and western Europe there is a cyclonic vortex, an Upper Level Low, causing warm air advection over Croatia in an unstable environment. In the meanwhile a great amount of moisture originated from the North Atlantic and the Mediterranean Sea and an extra amount from the Adriatic (figure 8).
Figure 7: Geopotential at the surface and 500hPa relative topography
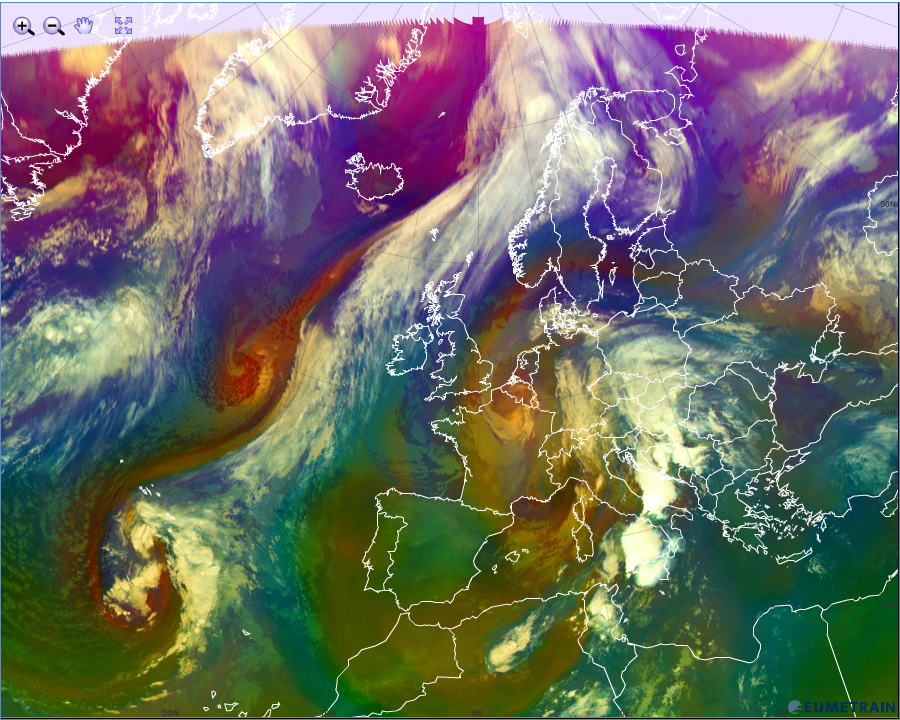
Figure 8: Airmass RGB on October 15th 2015
Hidrological Situation
As mentioned in the introduction, the weather situation and precipitation on October 15th was just icing on the top of weather conditions from previous days. Because of frequent rain episodes over the Kupa and Korana catchments the groundwater levels were high as well as soil moisture. That is why the flood was no surprise, but the new record for high water level of river Korana (852 cm) was.
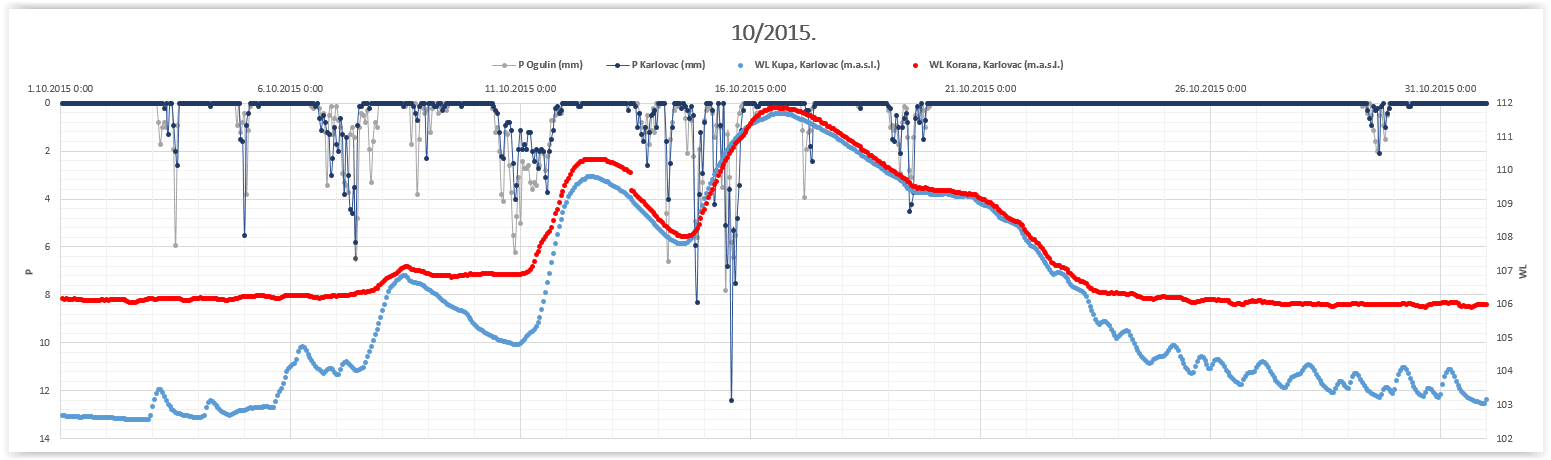
Figure 9: Daily precipitation October 2015 in Ogulin and Karlovac vs. water levels of Karlovac Kupa and Karlovac, Korana. OGULIN P ave Oct = 146.8 mm, P Max Oct = 458.1 mm, P Oct 2015 = 306 mm. KARLOVAC P ave Oct = 98.3 mm, P Max Oct = 316.7 mm, P Oct 2015 = 270 mm.
Used meteorological models, Aladin and ECMWF predicted 10 do 30 mm of rain in 24h and 40 to 60 mm respectively, giving an indication for heavy rain. Measured rainfall for Karlovac city since 8 am until 8 pm on 15 October was 53 mm and for other relevant catchments around 35 mm. The river's response to that precipitation was fast as visible at Image 10.
It was the first time for the newly developed DHMZ's Kupa/Upper Sava river catchment operational hydrological forecast (MIKE11 software) to be put to the test. It made a good forecast for the water level of Kupa, but was underestimating for the water level of Korana (Image 10).
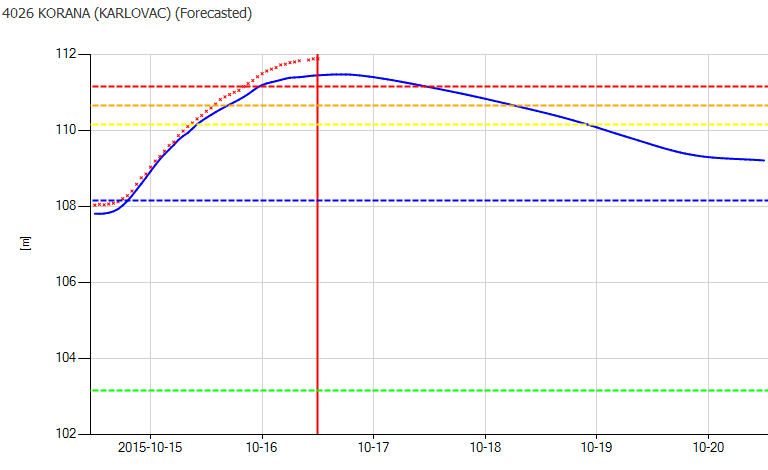
Figure 10: Water level of river Korana. Full blue line is forecasted water level of Korana and red stars represent water level measures
That water wave resulted in a new water level maximum for the hydrological station Karlovac, Korana with measured +852 cm (or 111.882 m a.s.l.).
Though well informed and well prepared, civil service still needed to evacuate about 200 people who could not run away in time or did not listen to the warnings. There were no casualties or cattle loss, only infrastructural damage which could not be prevented by accessible means. Flood reached 255 houses and 84 farm buildings. This situation is an example of a good collaboration between the scientists and civil service.
==================================================================
* TECHNICAL NOTE: For the best interactive experience throughout this module please use the most recent versions of Firefox or Internet Explorer browser!