Table of Contents
Cloud Structure In Satellite Images
Thickness Ridge (THR) cloud is a system with the appearance of a band of cloud which can be found in the thickness ridge ahead of a frontal cloud band. It often contains convective clouds in the summer season. The clouds in the thickness ridge may be associated with the frontal system in its northern parts, or may be separate. No characteristic life cycle can be observed in the cloud features of a thickness ridge cloud system.
Basic channels:
- IR imagery:
- Mostly fibrous and/or dense cloud, white or light grey;
- Cellular features within the cloud band, indicating embedded convection;
- WV imagery:
- The cloud features in the IR image can be seen as white features in an extended grey area;
- for some cases a distinct black zone appears between the frontal cloud band and the Thickness Ridge Cloud band.
- VIS imagery:
- The VIS image generally shows light grey shades, representing middle to high translucent clouds, with white spots indicating embedded convection cells.
RGBs:
Airmass RGB:
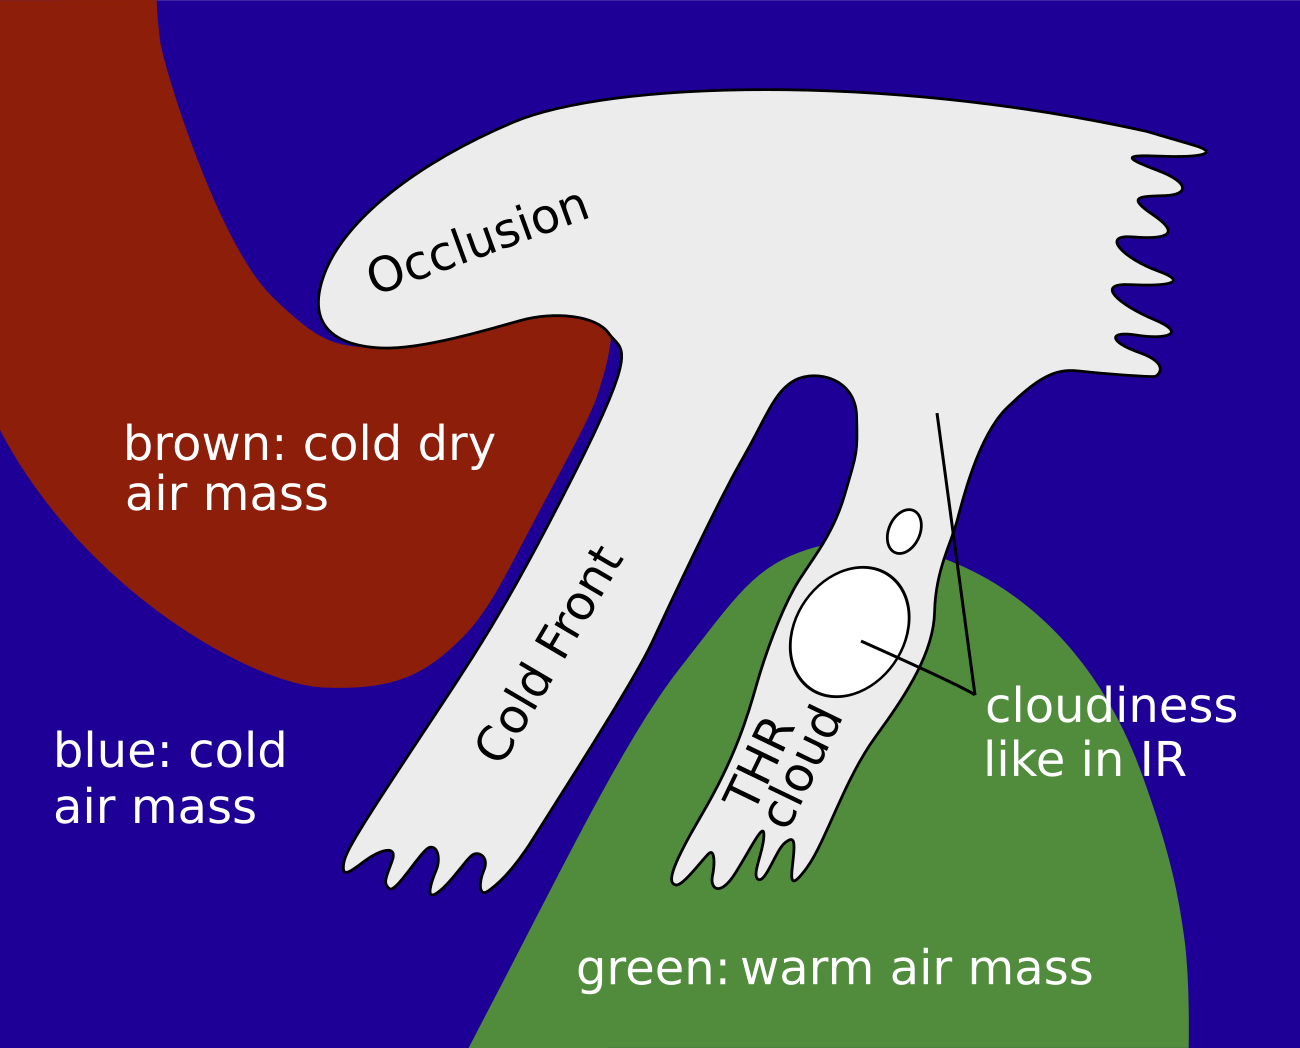
According to the location of the THR cloudiness ahead of a cold front cloud band, greenish colours indicate warm air masses in the southern and south-eastern parts of the cloud system. In front of the THR cloud usually blue to greenish colours indicate warm to cold airmasses which are governed by the different synoptic situations there.
The THR clouds have a similar appearance in the IR image.
Dust RGB
Ahead of, and to the south of the THR cloud blue to pinkish blue colours appear where there are cloud free areas.
The THR cloud itself consists of a mixture of ochre, dark-red and black cloud areas and stripes. These features are dependent upon the thickness and the height of the cloud, from the mid-level up to the thicker ice cloud and finally up to the high-level cloud fibres.
 |
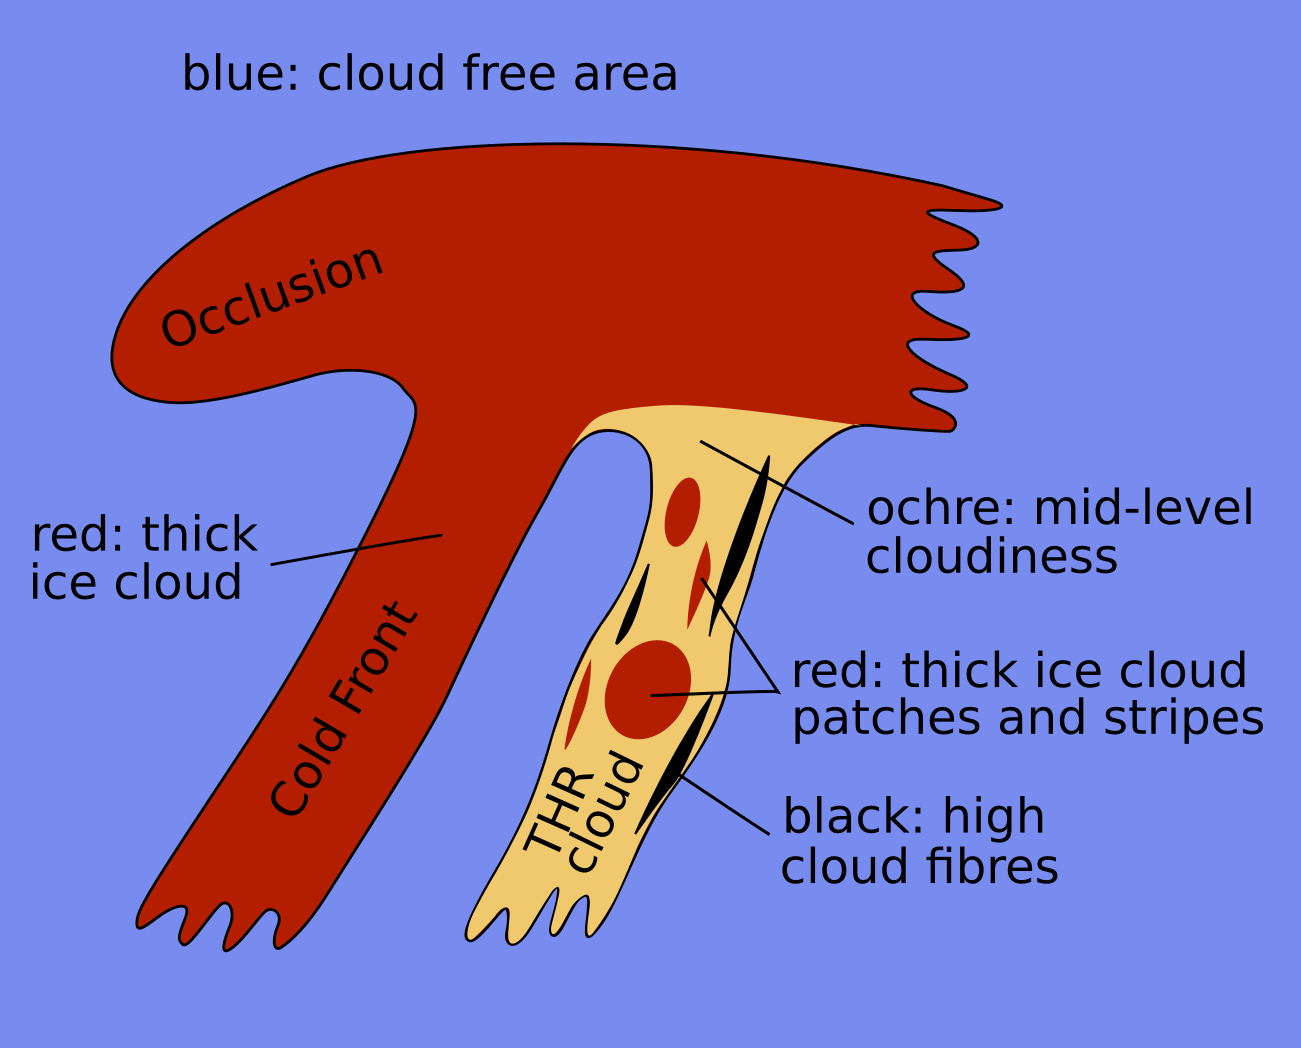 |
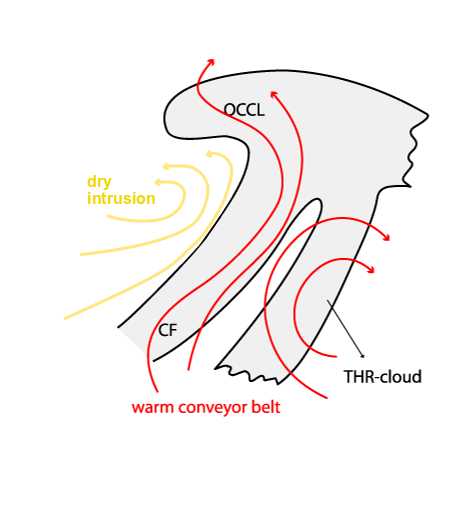
Legend: Schematics for basic RGBs, Left: airmass RGB; right: dust RGB
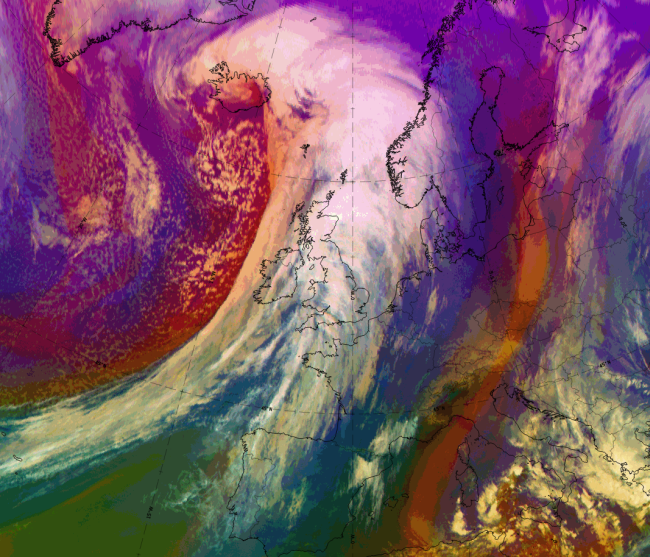
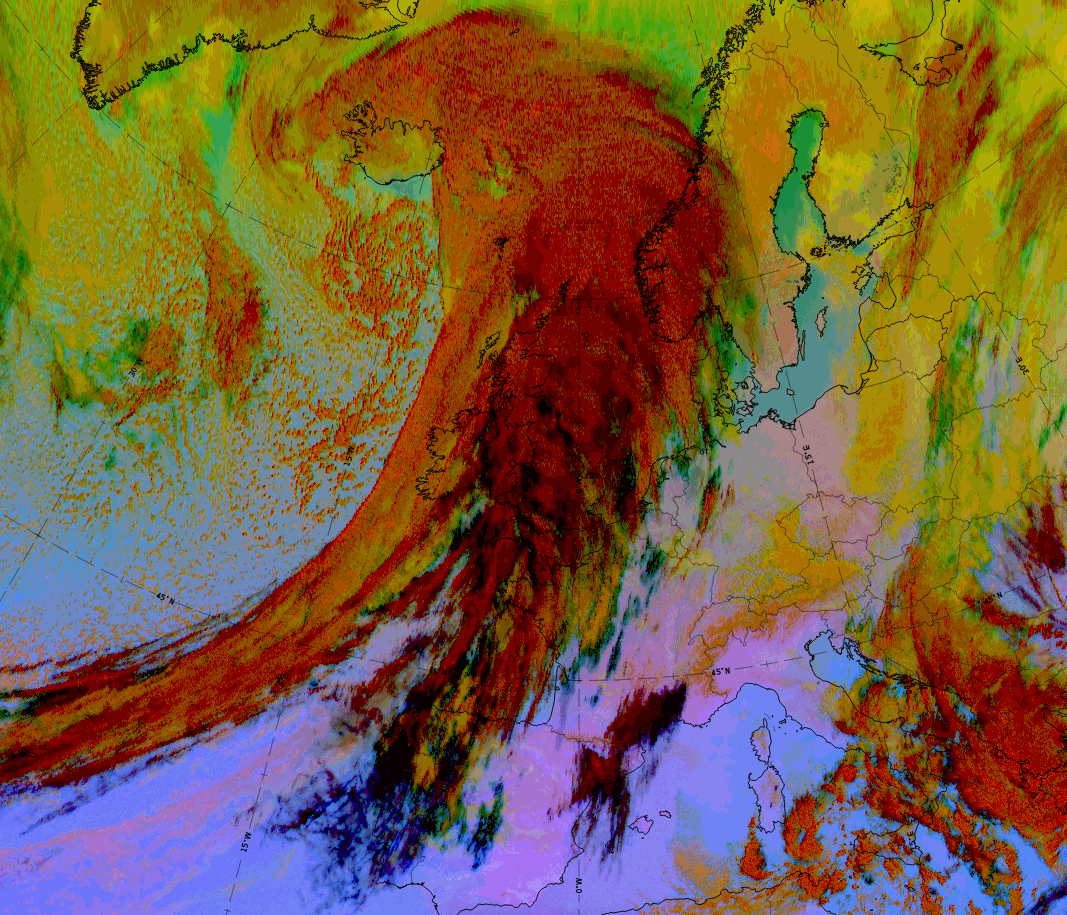
The case from 10 December 2019 at 12 UTC is a good example for a winter case over Western Europe. The THR cloudiness is in front of, and parallel to, the cloud band of the Cold Front and extends from the British Isles over western France to Northwestern Spain and Portugal. Its cloud fraction merges in the warm sector with the cloud fraction associated with the Warm Front shield.
|
|
|
|
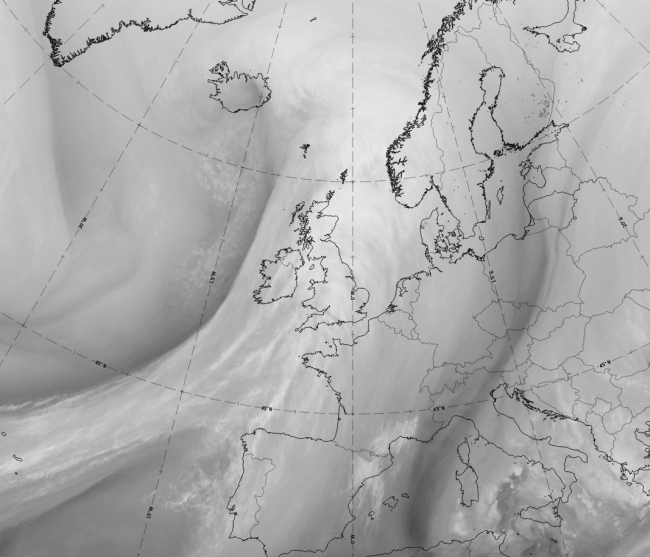
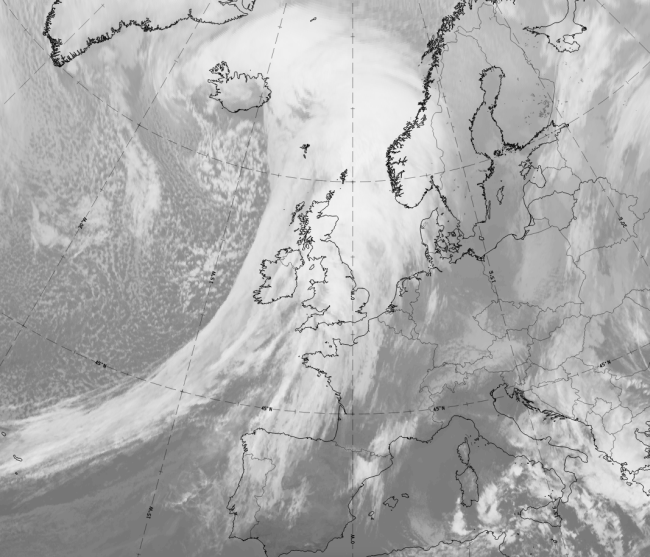
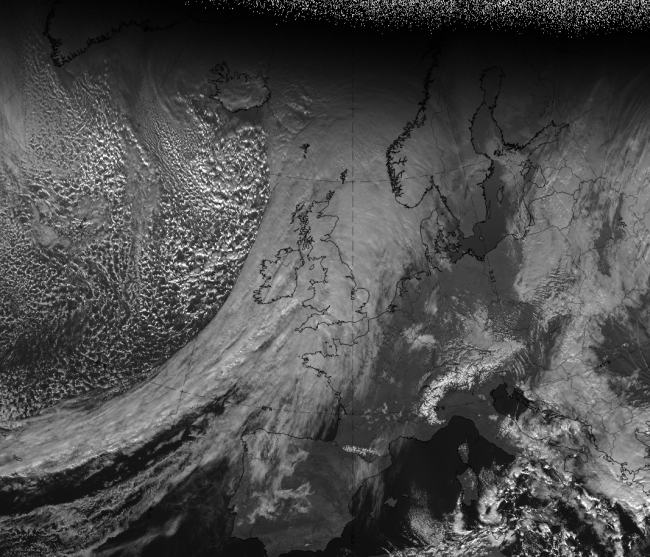
10 December 2019 at 12UTC: 1st row: IR (above) + HRV (below); 2nd row: WV (above) + Airmass RGB (below); 3rd row: Dust RGB + image gallery.
*Note: click on the Dust RGB image to access image gallery (navigate using arrows on keyboard)
| IR | Bright and structured in patches and fibres. |
| HRV | Dark grey fibrous. |
| WV | Bright structures can be recognised within the grey shield of high WV content. |
| Airmass RGB | The cloud is similar to the appearance in the IR images, with blue colours representing the cold airmass - except in the southern regions where the cloud feature is overrun by green colours representing the warm air mass in the southern warm sector. |
| Dust RGB | Dark-red colours indicate thick ice cloud, black indicates high translucent cloud fibres and some ochre areas indicate the mid-level cloud below. |
Meteorological Physical Background
Generally Thickness Ridge Cloudiness is situated within a rising warm conveyor belt and is generally found within a ridge or a closed maximum of equivalent thickness.
Relative streams provide a good explanation of the physical processes of Thickness Ridge Cloudiness formation:
- A rising warm conveyor belt is associated with the Thickness Ridge Cloudiness;
- An upper relative stream/dry intrusion can be seen to the rear of the frontal cloud band;
- The warm conveyor belt dominates the Thickness Ridge Cloudiness over a thick layer and sometimes influences a part of the frontal cloud band (Drier upper relative streams are far behind the Thickness Ridge Cloudiness and usually not involved in the physics of the cloud itself).
|
|
11 April 2008/06.00 UTC IR - Meteosat 9 IR10.8 image; blue: thermal front parameter, green: equivalent thickness 500/850 hPa,
position of vertical cross section indicated
|
|

|
The above image shows Thickness Ridge Cloudiness over the Mediteranean Sea. The position of the front is indicated by the Thermal Front Parameter. The line of the vertical cross section is superimposed.
|
11 April 2008/06.00 UTC - ECMWF Vertical cross section; black: isentropes (ThetaE)
|
|

|
A maximum of ThetaE is observed in the area of the Thickness Ridge Cloudiness. This maximum is an indication of a tongue of warm air. It consists of a maximum of closed isolines in the lower layers indicating unstable conditions. These unstable conditions only exist in the area just above the ThetaE maximum. Bellow this maximum the atmosphere is conditionally stable because of the increase of ThetaE with height.The height of the maximum differs according to the seasons.
|
20 June 2000/06.00 UTC - Meteosat IR image, blue: thermal front parameter 500/850 hPa, green: equivalent thickness 500/850 hPa,
position of vertical cross section indicated
|
20 June 2000/06.00 UTC - Vertical cross section; black: isentropes (ThetaE), orange thin: IR pixel values, orange thick: WV pixel
values
|

|

|
The left image above shows the Thickness Ridge Cloudiness over the Baltic Sea. The position of the Thickness Ridge Cloudiness within the thickness ridge and the frontal system is indicated by the TFP. The line of the cross section is superimposed. The selection of the isentropic surfaces from the vertical cross sections was made following an analysis of the vertical distribution of the isentropes. The surfaces of 318K and 324K represent the relative streams within and above the superadiabatic stratification.
|
20 June 2000/06.00 UTC - Meteosat IR image; magenta: relative streams 318K - system velocity: 284° 8 m/s, yellow: isobars 318K,
position of vertical cross section indicated
|
20 June 2000/06.00 UTC - Meteosat IR image; magenta: relative streams 324K - system velocity: 284° 8 m/s, yellow: isobars 324K,
position of vertical cross section indicated
|

|

|
In both of the above images the distribution of relative streams shows a dominating rising warm conveyor belt at all levels. In the left image the warm conveyor belt at the 318K isentropic surface can be observed, rising from about 500 hPa up to about 450 hPa over the area of Thickness Ridge Cloudiness. In the higher isentropic surfaces of 324K the warm conveyor belt continues to rise from 400 hPa to about 350 hPa.
The tongue of warm air transported in the warm conveyor belt is also indicated by distinct warm temperature advection and a maximum in the
ridge of equivalent potential temperature.
The rising warm conveyor belt stream causes condensation.
The embedded convective cloudiness is a bit of a contradiction.
The Thickness Ridge Cloudiness is mostly consisting of fibrous cloudiness and is seldom associated with precipitation.
During the summer season there can be strong convective activity within the thickness ridge (compare
Convective cloud features in typical synoptic environments - The warm sector
). Furthermore, because of the thermal energy and the high relative humidity within the thickness ridge this convective activity can be very
strong.
Key Parameters
- Equivalent thickness and Thermal front parameter (TFP):
Within the ridge of the equivalent thickness (not accompanied by a TFP), the TFP zones are connected to the consecutive CF and the WF if existing. - Equivalent potential temperature at 850 hPa:
The thickness ridge cloud lies within a ridge or a maximum of the equivalent potential temperature at 850 hPa - Height Contours at 1000 hPa and 500 hPa:
The Thickness Ridge Cloudiness is situated within the ridge of the 1000 hPa and the 500 hPa height, in front of a frontal system - Temperature advection (TA) at 700 hPa:
A distinct maximum of WA is superimposed upon the Thickness Ridge Cloudiness. - Showalter index:
There is usually a stable stratification associated with Thickness Ridge Cloudiness, but during the summer season the area within the thickness ridge is often unstable.
Equivalent thickness and Thermal front parameter (TFP)
|
|
11 April 2008/06.00 UTC - Meteosat 9 IR10.8 image; blue: thermal front parameter (TFP), green: equivalent thickness 500/850 hPa
|

|

|
|
|
13 January 2008/00.00 UTC - Meteosat 9 IR10.8 image; blue: thermal front parameter (TFP), green: equivalent thickness 500/850 hPa
|

|
|
|
|
09 January 2008/12.00 UTC - Meteosat 9 IR10.8 image; blue: thermal front parameter (TFP), green: equivalent thickness 500/850 hPa
|

|
In all three cases THR Cloudiness is found within a ridge of equivalent thickness. In the 13th January case the equivalent thickness ridge is very pronounced and one can also nicely recognize Cold and Warm front Cloud bands. In 9th January case frontal cloudiness is very weak. The first example of 11th of April one can declare as "front-disconnected" type and the other ones as "front-connected" types but without intensive convection because these are winter cases.
|
|
11 April 2008/06.00 UTC - Meteosat 9 IR10.8 image; magenta: equivalent potential temperature 850 hPa
|

|

|
|
|
13 January 2008/00.00 UTC - Meteosat 9 IR10.8 image; magenta: equivalent potential temperature 850 hPa
|

|
|
|
|
09 January 2008/12.00 UTC - Meteosat 9 IR10.8 image; magenta: equivalent potential temperature 850 hPa
|

|
Height Contours at 1000 hPa and 500 hPa
|
|
11 April 2008/06.00 UTC - Meteosat 9 IR10.8 image; magenta: height contours 1000 hPa, cyan: height contours 500 hPa
|

|

|
|
|
13 January 2008/00.00 UTC - Meteosat 9 IR10.8 image; magenta: height contours 1000 hPa, cyan: height contours 500 hPa
|

|
|
|
|
09 January 2008/12.00 UTC - Meteosat 9 IR10.8 image; magenta: height contours 1000 hPa, cyan: height contours 500 hPa
|

|
Temperature advection (TA) at 700 hPa
|
|
11 April 2008/06.00 UTC - Meteosat 9 IR10.8 image; red dashed: temperature advection - CA 700 hPa, red solid: temperature advection
- WA 700 hPa
|

|

|
|
|
13 January 2008/00.00 UTC - Meteosat 9 IR10.8 image; red dashed: temperature advection - CA 700 hPa, red solid: temperature advection - WA 700 hPa
|

|
|
|
|
09 January 2008/12.00 UTC - Meteosat 9 IR10.8 image; red dashed: temperature advection - CA 700 hPa, red solid: temperature
advection - WA 700 hPa
|

|
Showalter index
|
|
11 April 2008/06.00 UTC - Meteosat 9 IR10.8 image; yellow: Showalter index 500/850 hPa, purple Showalter index 500/850 hPa is 0.
|

|

|
|
|
13 January 2008/00.00 UTC - Meteosat 9 IR10.8 image; yellow: Showalter index 500/850 hPa
|

|
|
|
|
09 January 2008/12.00 UTC - Meteosat 9 IR10.8 image; yellow: Showalter index 500/850 hPa
|

|
Whereas in the first case the values of Showalter index are nicely related to the cloudiness within the Thickness Ridge, in the last two examples (winter cases) the values of Showalter index are lower than 3, but for the whole frontal region and not specifically for the THR clouds.
Typical Appearance In Vertical Cross Sections
- Isentropes:
A vertical cross section taken across the Cold Front - Thickness Ridge Cloudiness - Warm Front shows the typical frontal gradient of isentropes connected to the Cold Front and Warm Front. In between a maximum of isentropes is observed in the area of the Thickness Ridge Cloudiness. This maximum is an indication of a tongue of warm air. It consists of a maximum of closed isolines in the lower layers indicating unstable conditions. The height of the maximum differs according to the seasons and can be very extreme in summer. The upper part over the maximum has some similarities with an "isentropic trough" usually associated with an Occlusion, but corresponding to a rising warm conveyor belt which is superimposed upon the unstable zone. Depending on the season the layer of the warm conveyor belt can be rather deep. - Temperature advection:
As the Thickness Ridge Cloudiness appears in front of a Cold Front, it generally exists within positive temperature advection (WA) at all levels. This is, in effect, the dominating warm conveyor belt. - Relative humidity:
Although there is a maximum of humidity at the low levels, the rising air of the warm conveyor belt leads to a secondary relative humidity maximum associated with Thickness Ridge Cloudiness in middle and upper levels. - Divergence:
Although there is a distinct convergence maximum in lower levels, there is a broad zone of convergence representing the warm conveyor belt stream at middle and higher levels. - Vertical motion (Omega):
Convergence in lower levels leads to a distinct maximum of upward motion in middle and even higher levels.
|
|
11 April 2008/06.00 UTC - Meteosat 9 IR10.8 image; blue: thermal front parameter (TFP), green: equivalent thickness 500/850 hPa;
position of vertical cross section indicated
|

|

|

|

|
|
09 January 2008/12.00 UTC - Meteosat 9 IR10.8 image; blue: thermal front parameter (TFP) 500/850 hPa, green: equivalent thickness
500/850 hPa; position of vertical cross section indicated
|
13 January 2008/06.00 UTC - Meteosat 9 IR10.8 image; blue: thermal front parameter (TFP) 500/850 hPa, green: equivalent thickness
500/850 hPa; position of vertical cross section indicated
|
Isentropes, equivalent potential temperature
|
|
11 April 2008/06.00 UTC - Vertical cross section; black: isentropes (ThetaE)
|

|

|
The above diagram shows a typical appearance of isentropes associated with Thickness Ridge Cloudiness in summer time. The tongue of warm air represented by a maximum, or at least a bulge of the isentropes within the centre of a vertical cross section, is the most evident feature with Thickness Ridge Cloudiness.
|
|
09 January 2008/12.00 UTC - Vertical cross section; black: isentropes (ThetaE)
|

|
|

|
|
|
|
13 January 2008/06.00 UTC - Vertical cross section; black: isentropes (ThetaE)
|
The lower of the diagrams shows a common distribution of the isentropes for the winter season, where the warm air tongue is not so strong. The cross-sections show the typical distribution of the isentropes in the summer and the winter season.
Temperature advection
|
|
11 April 2008/06.00 UTC - Vertical cross section; black: isentropes (ThetaE), red thin: temperature advection - CA, red thick:
temperature advection - WA
|

|

|
|
|
09 January 2008/12.00 UTC - Vertical cross section; black: isentropes (ThetaE), red thin: temperature advection - CA, red thick:
temperature advection - WA
|

|
|
|
|
13 January 2008/06.00 UTC - Vertical cross section; black: isentropes (ThetaE), red thin: temperature advection - CA, red thick:
temperature advection - WA
|

|
In the upper of the above cross-sections, distinct WA, representing the rising warm conveyor belt, can clearly be seen in the right half of the cross-section. The maximum located at the right-hand side both at lower levels and at upper levels can clearly be linked to the Thickness Ridge Cloudiness.
Relative humidity
|
|
11 April 2008/06.00 UTC - Vertical cross section; black: isentropes (ThetaE), blue: relative humidity
|

|

|
|
|
09 January 2008/12.00 UTC - Vertical cross section; black: isentropes (ThetaE), blue: relative humidity
|

|
|
|
|
13 January 2008/06.00 UTC - Vertical cross section; black: isentropes (ThetaE), blue: relative humidity
|

|
A broad zone of increased relative humidity in all levels is connected to the Cold Front, whereas a maximum in the right-hand side of the image, in the upper levels, is connected to the Thickness Ridge Cloudiness.
Divergence
|
|
11 April 2008/06.00 UTC - Vertical cross section; black: isentropes (ThetaE), magenta thick: convergence, magenta thin: divergence
|

|

|
|
|
09 January 2008/12.00 UTC - Vertical cross section; black: isentropes (ThetaE), magenta thick: convergence, magenta thin: divergence
|

|
|
|
|
13 January 2008/06.00 UTC - Vertical cross section; black: isentropes (ThetaE), magenta thick: convergence, magenta thin: divergence
|

|
Vertical motion (Omega)
|
|
11 April 2008/06.00 UTC - Vertical cross section; black: isentropes (ThetaE), cyan thick: vertical motion (omega) - upward motion,
cyan thin: vertical motion (omega) - downward motion
|

|

|
|
|
09 January 2008/12.00 UTC - Vertical cross section; black: isentropes (ThetaE), cyan thick: vertical motion (omega) - upward
motion, cyan thin: vertical motion (omega) - downward motion
|

|
|
|
|
13 January 2008/06.00 UTC - Vertical cross section; black: isentropes (ThetaE), cyan thick: vertical motion (omega) - upward
motion, cyan thin: vertical motion (omega) - downward motion
|

|
The correspondence between upward motion and THR cloudiness is the best in the last example, where negative values of omega are found in the region of Thickness Ridge. In the first two examples there is hardly any upward motion in the region of the Thickness Ridge.
Weather Events
The Thickness Ridge cloud band is multi-layered and normally exists without significant precipitation except in cases with embedded convection.
| Parameter | Description |
| Precipitation |
|
| Temperature | Rising temperatures in the warm sector |
| Wind | Mostly weak winds with a southerly component |
| Other relevant information | Multi layered mid- and high-level clouds |
The case from 10 December 2019 at 12 UTC is a good example for a winter case with little to no convection at all.
|
|
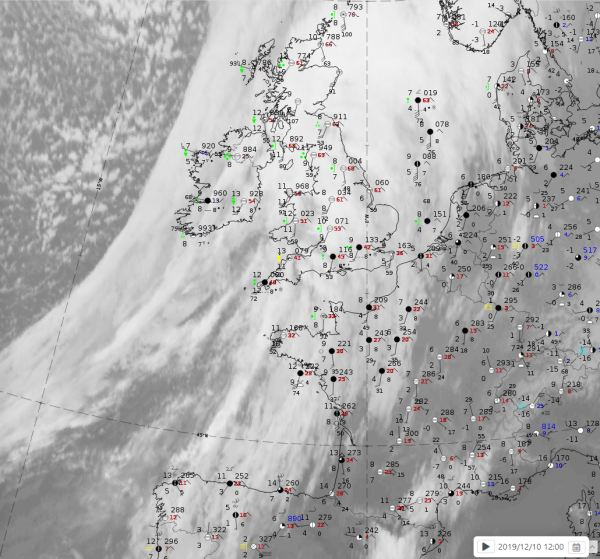
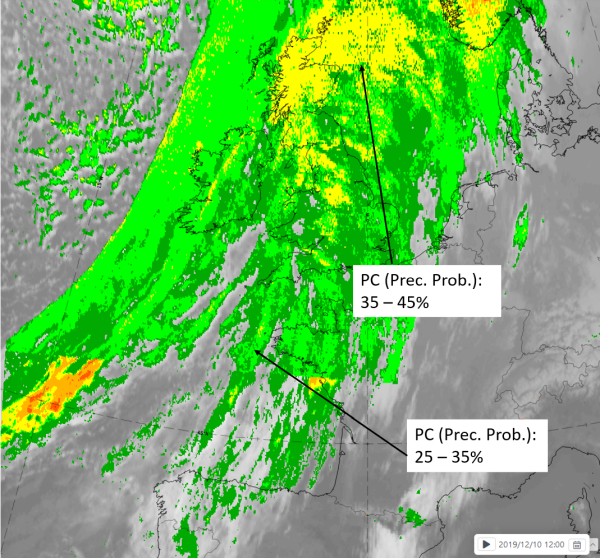
Legend: 10 December 2019 at 12UTC: IR + synoptic measurements (above) + probability of moderate rain (Precipitting clouds PC - NWCSAF).
Note: for a larger SYNOP image click this link.
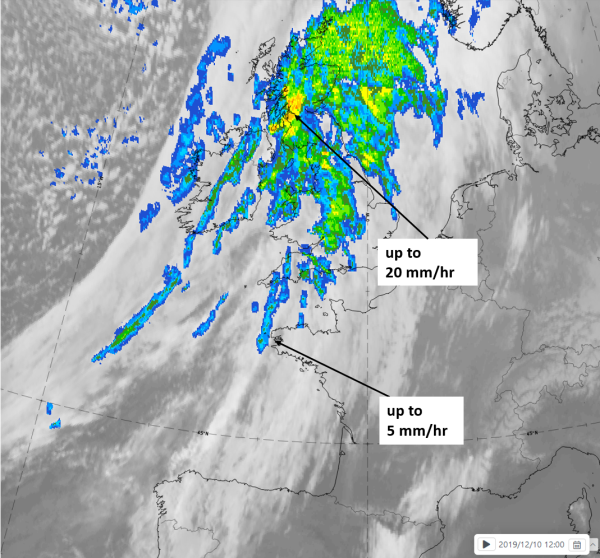
In the case from 10 December 2019/12 UTC (left side), the synoptic observations do not report any precipitation in the southern half from Spain into the English Channel, where very low precipitation probabilities exist. In the northern half over the image, over the British Isles, there are some areas with higher probabilities of precipitation. This is in the northern region of the warm sector where cloud associated with the THR and the warm front are difficult to distinguish and delineate.
|
|
|
|
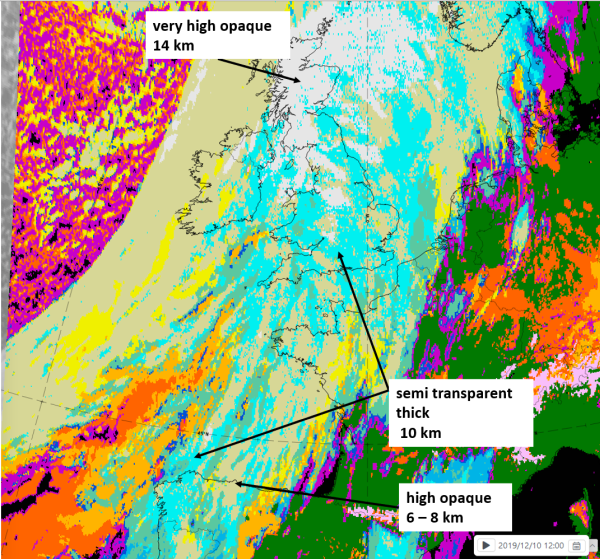
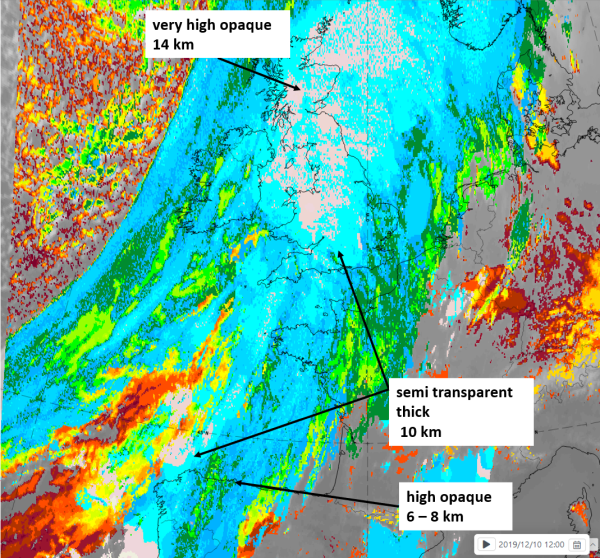
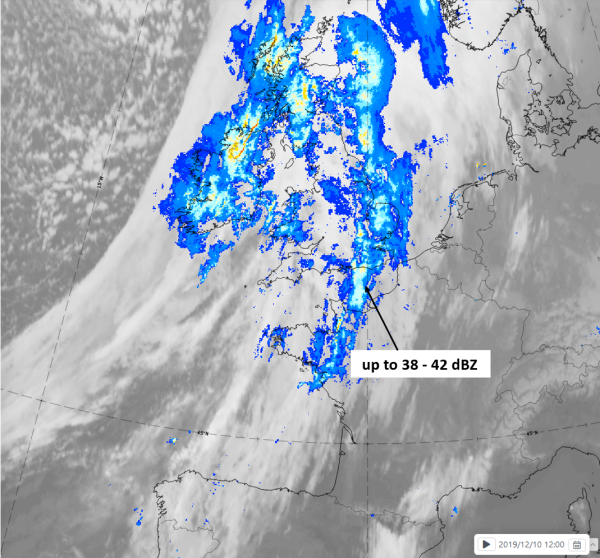
10 December 2019 at 12 UTC
1st row: Cloud Type (CT NWCSAF) (above) + Cloud Top Height (CTTH - NWCSAF) (below); 2nd row: Convective Rainfall Rate (CRR NWCSAF) (above) + Radar intensities from Opera radar system (below).
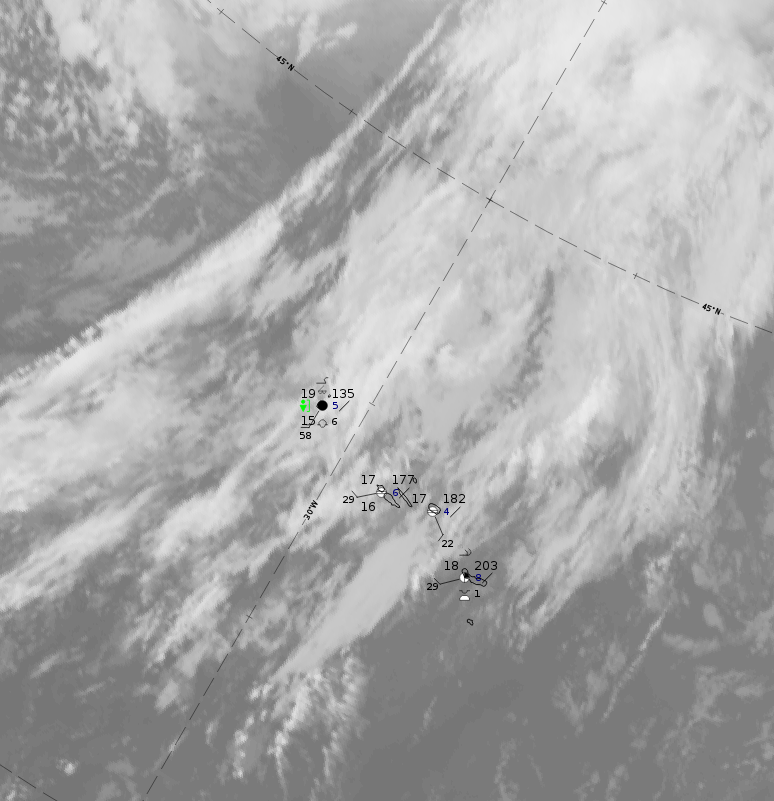
In the case of 18 April 2020 at 12 UTC THR cloudiness is over the Atlantic ahead of a weak cold frontal cloud band; although there are few ground observations, weather stations from the Azores Islands do indicate a situation more typical for the summer cases.
 |
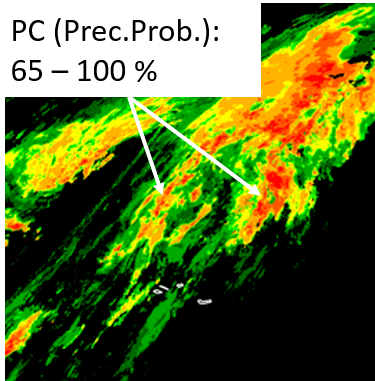 |
Legend: 18 April 2019 at 12UTC: l: IR and synoptic measurements; r: IR and precipitating cloud (probability of precipitation from NWCSAF)
For identifying values for Cloud type (CT), Cloud type height (CTTH), precipitating clouds (PC), and Opera radar for any pixel in the images look into the legends. (link).
References
General Meteorology and Basics
- KURZ M. (1990): Synoptische Meteorologie - Leitf?en f?r die Ausbildung im Deutschen Wetterdienst; 2. Auflage, Selbstverlag des Deutschen Wetterdienstes
- CONWAY B. J., GERARD L., LABROUSSE J., LILJAS E., SENESI S., SUNDE J. and ZWATZ-MEISE V. (1996): COST78 Meteorology - Nowcasting, a survey of current knowledge, techniques and practice; Phase 1 report; Office for official publications of the European Communities
General Satellite Meteorology
- BADER M. J., FORBES G. S., GRANT J. R., LILLEY R. B. E. and WATERS A. J. (1995): Images in weather forecasting - A practical guide for interpreting satellite and radar imagery; Cambridge University Press
Specific Satellite Meteorology
- BROWNING K. A. (1985): Conceptual models of precipitation systems; Met. Mag., Vol. 114, p. 293 - 317
- BROWNING K. A. and HILL F. F. (1985): Mesoscale analysis of a polar trough interacting with a polar front; Quart. J. R. Meteor. Soc., Vol. 111, p. 445 - 462
- BROWNING K. A. (1986): Conceptual models of precipitation systems; Weather&Forecasting, Vol. 1, p. 23 - 41
- BROWNING K. A. (1990): Organization of clouds and precipitation in extratropical cyclones; in: Extratropical Cyclones, The Erik Palmen Memorial Volume, Ed. Chester Newton and Eero O Holopainen, p. 129 - 153
- CARLSON T. N. (1980): Airflow through mid-latitude cyclones and the comma cloud pattern; Mon. Wea. Rev., Vol. 108, p. 1498 - 1509
- CARLSON T. N. (1987): Cloud configuration in relation to relative isentropic motion; in: Satellite and radar imagery interpretation, preprints for a workshop on satellite and radar imagery interpretation - Meteorological Office College, Shinfield Park, Reading, Berkshire, England, 20 - 24 July 1987, p. 43 - 61
- GREEN J. S. A., LUDLAM F. H. and MCILVEEN J. F. R. (1966): Isentropic relative - flow analysis and the parcel theory; Quart. J. R. Meteor. Soc., Vol. 92, p. 210 - 219
- Hobbs, P. V., J. D. Locatelli, and J. E. Martin, 1996: A new conceptual model for cyclones generated in the lee of the Rocky Mountains. Bull. Amer. Meteor. Soc., 77, 1169-1178.
- WANG P-Y and HOBBS P. V. (1983): The mesoscale and microscale structure and organization of clouds and precipitation in mid-latitude cyclones. Part X: Wavelike rainbands in an occlusion; J. Atmos. Sci., Vol. 40, p. 1950 - 1964
- MATEJKA T. J., HOUZE Jr. R. A. and HOBBS P. V. (1980): Microphysics and dynamics of clouds associated with mesoscale rainbands in extratropical cyclones; Quart. J. R. Meteor. Soc., Vol. 106, p. 29 - 56
- LOCATELLI, J. D., M. T. STOELINGA, R. D. SCHWARTZ, and P. V. HOBBS, 1997: Surface convergence induced by cold fronts aloft and prefrontal surges. Mon. Wea. Rev., 125, 2808-2820.
- BLUESTEIN, H.B., 1993: Synoptic Dynamic Meteorology in Midlatitudes, Volume II, Oxford Univ. Press