Table of Contents
Cloud Structure In Satellite Images
- In satellite images a developing Spanish Plume event is characterized by a south/southwest - north/northeast oriented Cold Front cloud band moving eastwards towards the Iberian Peninsula and Western Europe. As the Cold Front approaches France and the Iberian Peninsula, clusters of Cumulonimbus Clouds (Cb) develop in the mainland. As the clusters grow, they acquire an oval MCS - like appearance with a larger horizontal extent.
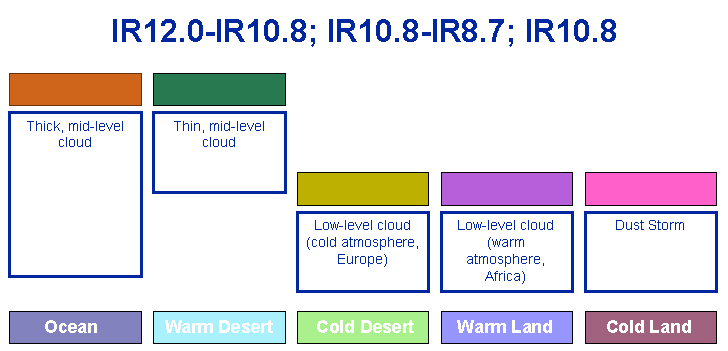
- In IR, WV and VIS images, the Plume is characterized by rapidly brightening cloud pixels, indicating strong vertical development of convective cells, which soon extend through the whole troposphere. In Dust RGB composite imagery (IR12.0-IR10.8; IR10.8-IR8.7; IR10.8) the convective cells are characterized in the beginning by isolated red-orange pixels.
- In the WV images, a smooth grey zone extends from the Spanish plateau in a northerly direction towards France, the Benelux and the British Isles. Within this zone the first signs of developing Cb cells are easy to detect as tiny white spots emerging from the greyer environment.
- The contrast between the clouds and cloud-free area is distinct, especially at the upstream edges of cloud clusters. In the case of strong upper level winds, high level cloudiness is transported downstream leading to an extended white cloud shield (the anvil) in IR but a fibrous grey texture in VIS. The brightest grey shades can be found in the active part upstream. This feature is best recognizable in Dust RGB (IR12.0-IR10.8; IR10.8-IR8.7; IR10.8) imagery, where the cloud clusters, i.e. red-orange areas, are well distinct from the environment. The kelly green or dark blue areas allow the identification of high cloudiness transported by strong upper winds.
- In the mature and subsequent stages, numerous convective clusters may develop along the "Spanish Plume". This process is extremely pronounced in Dust RGB images (IR12.0-IR10.8; IR10.8-IR8.7; IR10.8), where red-orange isolated pixels rapidly spread into very large red-orange areas. More on the different colors observed in this Dust RGB can be found here .
|
|
|
03 July 2005/18.00 UTC - Meteosat 8 IR10.8 enhanced image
|
03 July 2005/21.00 UTC - Meteosat 8 IR10.8 enhanced image
|
|
|
|
|
|
04 July 2005/00.00 UTC - Meteosat 8 IR10.8 enhanced image
|
04 July 2005/03.00 UTC - Meteosat 8 IR10.8 enhanced image
|
|
03 July 2005/21.00 UTC - Meteosat 8 Dust RGB image (IR12.0-IR10.8, IR10.8-IR8.7 and IR10.8)
|
04 July 2005/03.00 UTC - Meteosat 8 Dust RGB image (IR12.0-IR10.8, IR10.8- IR8.7 and IR10.8)
|
|
|
In WV imagery the pre-convection environment often shows a moist mid-tropospheric warm conveyor belt extending from the Spanish plateau northwards. The first small-scale convective cells are easily detected in either IR or WV images. The Pyrenees - mountains sometimes cause some Lee Cloudiness, which can partly hide convective development in its earliest stage. The Lee Cloudiness can, however, also be used as an indicator of the existing moist southerly air flow.
The water vapour images below clearly show the Cold Front cloudiness over the northwestern coast of Iberian peninsula, and the broad moist upper-level tropospheric flow known as the "Spanish Plume" lying ahead of it over the Spanish plateau and western parts of continental Europe. Individual Cb cells can be found embedded within this moist zone.
|
03 July 2005/18.00 UTC - Meteosat 8 WV6.2 image
|
03 July 2005/21.00 UTC - Meteosat 8 WV6.2 image
|
|
|
|
|
|
04 July 2005/00.00 UTC - Meteosat 8 WV6.2 image
|
04 July 2005/03.00 UTC - Meteosat 8 WV6.2 image
|
The rapidly growing convective cells often form a long chain. The chain is oriented parallel to the Cold Front, but the distance between the chain and the front may vary. Local topographic forcing also determines the precise location at which the storms will form. Favoured locations for new development seem to be in northern Spain, near the coast of France and in the French Massif, from where the cells move north or northeastwards with the upper level flow.
During the earliest hours of development small-scale convective cells quickly grow both horizontally and vertically. This can be seen as rapid increase in brightness in all channels. Most strikingly, this increase in brightness can be seen in WV images, as the contrast between the individual developing cumulonimbus tops (bright white) and the environment (greyer shades) is well marked.
While the convective cells along the Spanish Plume grow, the Cold Front cloudiness gradually becomes less distinct as can be seen both from IR and WV images. Sometimes a relatively dry upper layer between the Cold Front and the Spanish Plume becoming narrower as the front overtakes the convective plume area may be observed. At later stages the Cold Front cloudiness may either merge with the convective cloudiness or gradually weaken with no interaction.
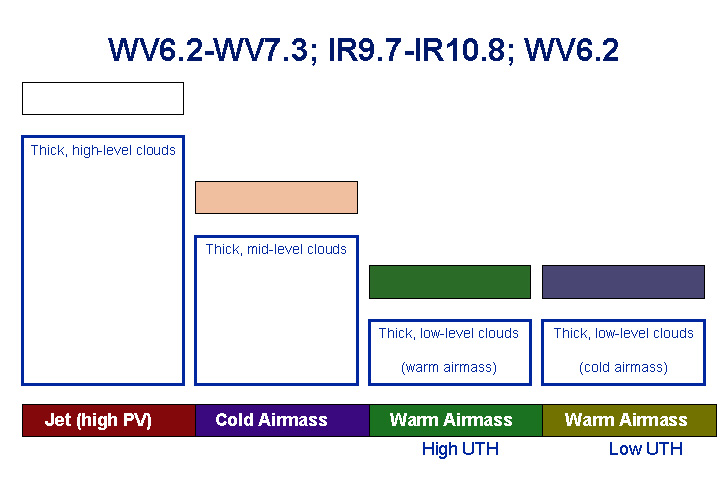
The above mentioned process can be clearly identified by means of Airmass RGB imagery (WV6.2-WV7.3; IR9.7-IR10.8; WV6.2i). As shown by the two images below, in the beginning the Spanish Plume is characterized by the typical greenish or bluish area within which bright white spots appear, indicating the developing convective cells. The purplish red area related to the cold air mass lies relatively far on the rear side of the elongated greenish yellow cloud layer of the cold front. In the mature stage the cold front cloudiness has dissolved, while the cold air mass is located immediately upstream of the spread Spanish Plume. More on the different coolers observed in this Airmass RGB can be found here .
|
03 July 2005/21.00 UTC - Meteosat 8 Airmass RGB image (WV6.2-WV7.3, IR9.7-IR10.8 and WV6.2i)
|
04 July 2005/06.00 UTC - Meteosat 8 Airmass RGB image (WV6.2-WV7.3, IR9.7-IR10.8 and WV6.2i)
|
|
|
Meteorological Physical Background
The Spanish Plume is, by definition, an incident where warm air is lifted from the Spanish plateau ahead of an eastward-moving upper-level trough over the Bay of Biscay. In conventional upper-air and surface synoptic maps this incident can typically be illustrated as follows:
|
Upper-level flow within Spanish plume. Solid lines: upper level (500 or 300 hPa) geopotential height; blue solid line: the upper
trough; yellow arrow: jet stream axis
|
Low-level flow within Spanish plume. Open red arrow: the warm conveyor belt; open blue arrow: the dry intrusion. Area within red
solid line: a typical area of high ThetaE values at 850 hPa. Black solid lines: surface isobars. Classical surface fronts also shown
|
|
|
The strong heating of air near the surface over the Spanish plateau causes convergence and ascent, enhanced by the dynamical forcing of the eastwards moving upper-level trough. This leads to the formation of a thermal low over the Iberian Peninsula. The thermal low sets up a low-level cyclonic flow over the peninsula (Phase A), which includes the formation of a convergence line over the plateau. This induces the advection of cooler air and descending motion across the coastal areas of the Iberian Peninsula and western France from the Bay of Biscay and warm air advection over the interior of the peninsula. Therefore in the area east of the surface trough the advection of warm air enhances the ascents within the warm plume (Phase B), further accelerating decrease of surface pressure.
The approaching Cold Front has an important role in the further development of the Spanish Plume in two ways:
- As the front approaches the continent, the existing thermal gradient intensifies. This causes the strengthening of winds ahead of the upper-level trough and wind adjustment in the lower levels; consequently an intensification of warm air advection and ascent within the warm plume ahead of the surface trough takes place (Phase C).
- The possible over-running of cold air at upper levels from behind the front, and further destabilization of the already highly unstable air within the Spanish Plume, can trigger deep convection.
|
The development of the Spanish plume; solid lines: surface flow, dashed lines: thermal advection at low levels, WA and CA warm and
cold air advection maximum, respectively.
|
|
|
|
|
|
As thunderstorms develop along the plume, the ascending motion is often rapidly compressed into a relatively narrow band. This band quickly becomes the Cold Front, while the old Cold Frontal zone tends to lose its intensity. This is due to subsidence of air immediately behind the Plume. This feature can be seen as increasing gradient of isentropes along the Plume.
The example below illustrates this process: a Cold Front approaching from the west gradually loses its intensity (as seen by a steady and later decreasing gradient of isentropes), while in the area of the Spanish Plume the ThetaE gradient increases and the Cold Front actually seems to "jump" forward.
|
03 July 2005/18.00 UTC - Meteosat 8 IR10.8 image; green: equivalent thickness, magenta: Equivalent potential temperature 850 hPa
|
04 July 2005/00.00 UTC - Meteosat 8 IR10.8 image; green: equivalent thickness, magenta: Equivalent potential temperature 850 hPa
|
|
|
|
|
|
04 July 2005/06.00 UTC - Meteosat 8 IR10.8 image; green: equivalent thickness, magenta: Equivalent potential temperature 850 hPa
|
This process is similar to Non-Orographic Convergence Lines and Thickness Ridge Cloudiness, as they have rather similar life cycles: the line of convection ahead of the old front becomes the dominant feature, and the remnants of the old front are either absorbed into the developing convective cloud line or simply decay.
Stability (soundings)
The pronounced instability at low and middle levels is clearly seen in the soundings. Often there is a lid of warm air near 850 hPa level. This lid delays the initiation of surface-based convection. Consequently, Convective Available Potential Energy (CAPE) is stored until it is released either by thermal advection or ascending motion. The triggering is often explosive, and can result in severe thunderstorms.
Cooling aloft, ahead of the advancing upper-level trough, and heating from below due to warm advection and solar insolation further destabilizes the atmosphere.
The amount of potential instability increases remarkably when the low-level moist air is capped by significantly drier air at medium levels (400-600 hPa). Upper-level dry air intrusion from behind may support explosive convection once convection is initiated.
The wind often veers considerably with height, which means a moist south-southeasterly flow at low levels, and a steady or increasingly south-westerly flow at middle and upper levels.
|
27 June 2001/00.00 UTC - Radiosounding Uccle; The location of Uccle (06447) is shown in the Meteosat 7 IR image from 27 June 2001/00.00 UTC at the upper right corner of the sounding graph
|
|
|
Key Parameters
- Stability index on isobaric surfaces:
Showalter index values below 3 units are expected. - Equivalent potential temperature at 850 hPa:
Tongue of high values of ThetaE; deep convection develops in the area of maximal values. - Thermal Front Parameter (TFP):
TFP associated with the gradually weakening Cold Front, and potential new front development ahead of the original Cold Front.
Stability index on isobaric surfaces
|
|
04 July 2005/00.00 UTC - Meteosat 8 IR10.8 image; yellow: Showalter index
|
|
|
Equivalent potential temperature at 850 hPa
|
|
04 July 2005/00.00 UTC - Meteosat 8 IR10.8 image; magenta: Equivalent potential temperature 850 hPa
|
|
|
Thermal Front Parameter (TFP)
|
|
04 July 2005/00.00 UTC - Meteosat 8 IR10.8 image; blue: thermal front parameter
|
|
|
Typical Appearance In Vertical Cross Sections
Within the area of the Spanish Plume the isentropes reveal unstable conditions.
- Unstable stratification:
The isentropes of equivalent potential temperature show an unstable stratified troposphere within the lower and mid-levels of the troposphere, which is characterized by values decreasing with height. They often also show a super-adiabatic behaviour within the lower layers of the troposphere. - Temperature advection:
The vertical distribution of temperature advection is characterized by distinct WA in the low and mid-levels of the troposphere. CA can sometimes already be found above, but in the early stages of the Spanish Plume CA is most often still lagging behind. Later, during the MCS development, CA is often found above the Spanish Plume and is associated with low-level WA. - Convergence:
The field of divergence generally indicates convergence within the lower and mid-levels, divergence at upper levels.
|
|
04 July 2005/00 UTC - Meteosat 8 IR10.8 image; position of vertical cross section indicated
|
|
|
Unstable stratification
|
|
04 July 2005/00.00 UTC - Vertical cross section, black: isentropes (ThetaE)
|
|
|
Temperature advection
|
|
04 July 2005/00.00 UTC - Vertical cross section, red thick: positive temperature advection - WA, red thin: negative temperature
advection - CA, black: isentropes (ThetaE)
|
|
|
Convergence
|
|
04 July 2005/00 UTC - Vertical cross section, magenta thick: convergence, magenta thin: divergence, black: isentropes (ThetaE)
|
|
|
Weather Events
The weather events in the Spanish plume are similar to those more commonly observed in MCS (see Cb And MCS - Weather Events ).
| Parameter | Description |
| Precipitation |
|
| Temperature | Sudden temperature drops in intensive showers, otherwise high temperatures and dewpoints outside the showers. |
| Wind (incl. gusts) | Strong gusts, even tornadoes possible. |
| Other relevant information |
|
|
04 July 2005/03.00 UTC - Meteosat 8 IR10.8 image; weather events (green: rain and showers, red: thunderstorm with precipitation,
yellow: fog, black: no actual precipitation or thunderstorm with precipitation)
|
|
|
References
- McCallum, E. and Waters, A. J., 1993: Severe thunderstorms over south-east England, 20/21 July 1992: Satellite and radar perspective of a mesoscale convective system. Weather, 48, pp. 198-208.
- Browning, K. A., and Hill, F. F., 1984: Structure and evolution of a mesoscale convective system near the British Isles. Quart. J. Roy. Met. Soc, 110, pp. 897-913.
- Webb, J. D. C. and Pike, W. S., 1998: Thunderstorms and hail on 7 June 1996: An early season 'Spanish plume' event. Weather, 53, pp. 234-241.
- Morris, R. M., 1986: The Spanish Plume - testing the forecaster's nerve. Meteorol. Mag., 115, 349-357.
- Young, M. V., 1995: Severe thunderstorms over south-east England on 24 June 1994: A forecasting perspective. Weather, 50, pp. 250-256.
- van Delden, A., 1998: The synoptic setting of a thundery low and associated prefrontal squall line in western Europe. Meteorology and Atmospheric Physics, Vienna, Austria. Vol. 65, no. 1-2, pp. 113-131.