Table of Contents
Cloud Structure In Satellite Images
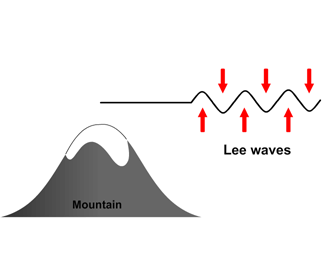
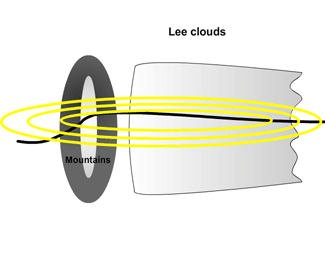
Lee Cloudiness is one result of orographically influenced air flow on the lee side of a mountain. Depending on the atmospheric conditions two types of cloudiness can be observed:
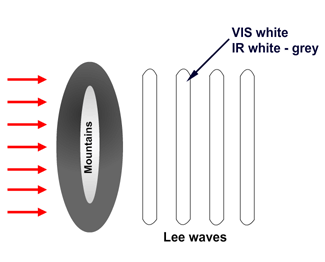
- Lee Wave Clouds, which are characterised by narrow middle level cloud bands perpendicular to the wind direction and parallel to the mountain chain. The length of the wave varies in range from about 3 - 40 km. They can easily be observed with high resolution images (e.g. Meteosat Second Generation and METOP polar orbiting satellite). Their crests are always white in the visible image but in the IR image they can vary from white to dark grey depending on their temperature (cloud top height).
|
|
|
|
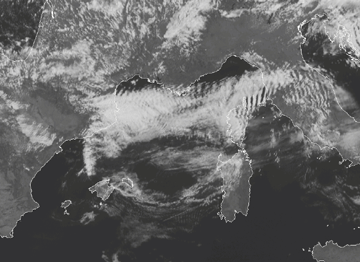
04 July 2007/09.30 UTC - Meteosat 9 HRVIS image
|
|
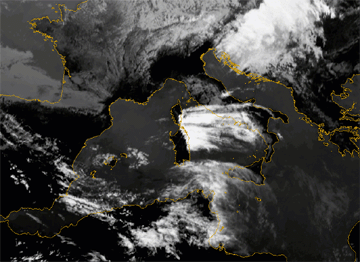
The image shows well developed Lee Waves over Corsica, formed by the mountains in the northern part. To the west even Lee Waves that developed over the Pyrenees are observed.
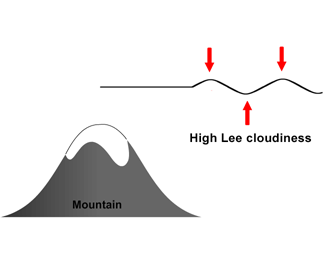
- High Lee Cloudiness consisting of cirrus clouds that extend from the mountain chain over the leeward side, and continue for up to 1000 km. They are also formed by Lee Waves but have a much larger wave length. They are very bright in the IR image with cloud top temperatures ranging from -35 to -55°C but rather grey or translucent in the VIS image. Sometimes in strong winds they become detached from the mountain and then seem to start far away from the obstacle.
|
|
|
|
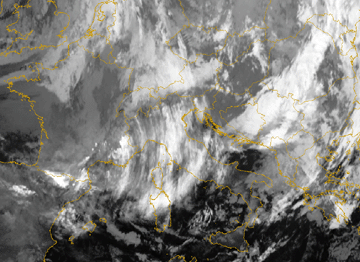
12 November 2006/23.30 UTC - Meteosat 8 IR10.8 image
|
|
High and thin Lee clouds have formed over the Southern part of the Alps. The cloudiness is extending very far to the south, across Italy.
|
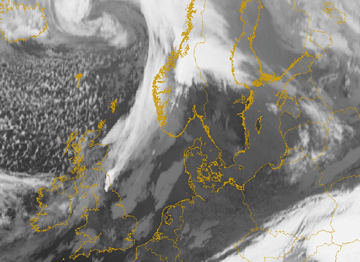
11 April 2005/23.30 UTC - Meteosat 8 IR10.8 image
|
|
The image reveals two areas with high Lee cloudiness. First, Lee clouds that formed over England and are in the image found over the North Sea. Second area of interest is over the Norwegian mountains where high Lee Cloudiness is being formed and is extending far into Sweden and the Baltic Sea. The sharp boundary of the mountain ridge on which the Lee clouds develop is well observed for both areas.
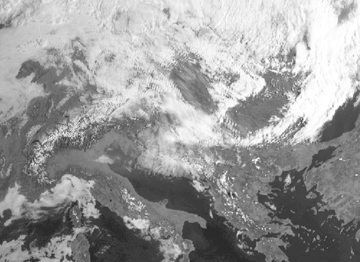
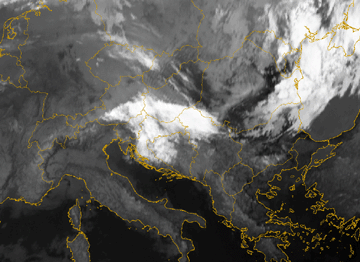
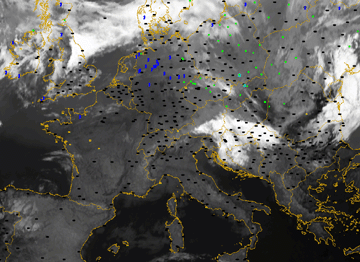
Sometimes Lee Wave Clouds and High Lee Cloudiness can be observed together. In this case the IR image is the best tool for the identification of High Lee Cloudiness, just south of the Austrian Alps; the HRVIS image for the lower Lee Wave Clouds over Slovakia and Hungary is also evident. The high resolution shows the existence of Lee waves very well
|
18 March 2005/07.45 UTC - Meteosat 8 HRVIS image
|
18 March 2005/06.00 UTC - Meteosat 8 IR10.8 image
|
Sometimes the Lee Waves are situated immediately behind the mountain and the High Lee Cloudiness is found further downwind.
|
28 June 2005/04.45 UTC - Meteosat 8 HRVIS image
|
28 June 2005/04.45 UTC - Meteosat 8 IR10.8 image
|
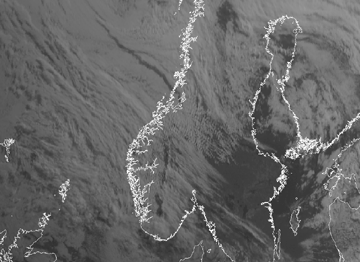
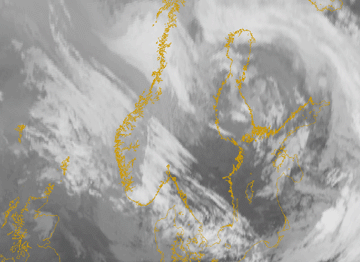
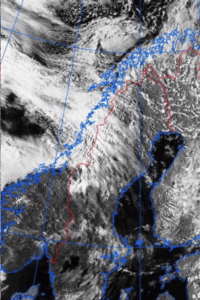
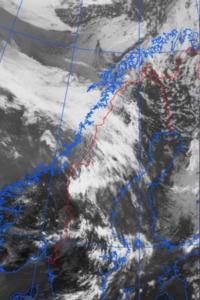
The two images above show Lee Cloudiness over the Norwegian Mountains. Lee Waves are situated immediately behind this mountain chain whereas high Lee cloudiness is found extending far to the east over Southern Norway and Southern Sweden.
Both types of Lee Cloudiness are frequently found over many mountain chains in Europe. In Europe they can be found at the Pyrenees, the Alps, the Carpathians Mountains, the Scandinavian Mountains, the Central Mountains in France, Iceland, the Apennines, the Cantabrian Mountains, the High Tatra, the mountains of Scotland, the mountains of England (Wales), Corsica and the East coast of Spain. Lee Cloudiness can also be found sometimes in Portugal, Greece, the Azores, the Baleares and the Faeroes Islands.
Lee Cloudiness normally has a duration of only several hours. Only in very few cases will it survive more than one day. The spatial scale ranges from small cloud patches (limitation is the resolution of the observation) up to several hundred kilometres.
Lee Wave Clouds are detected quite easily in VIS images. Identification of High Lee Cloudiness is more difficult; for instance High Lee Cloudiness and MCSs can have the same shape and brightness. Since Lee Cloud is associated with its mountain there is normally no propagation upwind. So discrimination between Lee Cloudiness and other possibly superimposed conceptual models such as moving systems is possible. Satellite loops can also be used to determine if Lee Cloudiness is detached from the mountain chain by strong winds.
|
08 May 2005/09.00 UTC - Meteosat 8 IR10.8 image
|
08 May 2005/04.30 UTC - Meteosat 8 IR10.8 image; 04.30 - 12.00 UTC half-hourly image Loop
|
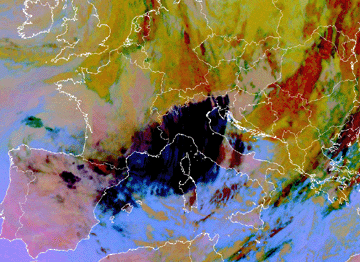
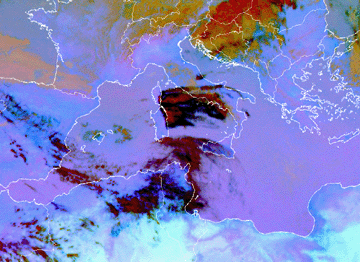
Lee Cloudiness can also easily be detected with the help of RGB satellite images computed from the different Meteosat Second Generation IR images. Especially with the Dust RGB the high Lee clouds are easily discriminated.
|
12 November 2006/23.00 UTC - Meteosat 8 Dust RGB image
|
08 May 2005/09.00 UTC - Meteosat 8 Dust RGB image
|
Although it would seem inappropriate to use the Dust RGB for detecting Lee clouds the above two examples shows the contrary. The Dust RGB was originally designed for the detection and monitoring of dust. The RGB is comprised of the brightness temperature difference (BTD) of channels IR12.0 and IR10.8 on red, the BTD of IR10.8 and IR8.7 on green and finally on blue channel IR10.8 is projected. The BTD of IR12.0 and IR10.8 is a measure of the optical thickness which makes this RGB so useful. The high, cold and thin lee clouds appear as black in this RGB.
Appearance in AVHRR images
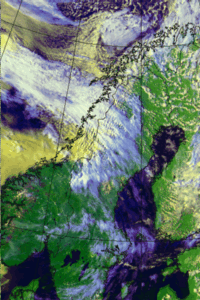
- Narrow cloud lines parallel to the mountain ridge line consist mostly of low or middle level clouds with a width of about 3 - 40 kilometres for both the cloud and the cloud-free lines. In NOAA 124 images they have white or yellow colour and in NOAA 345 images mostly cyan or light red colour.
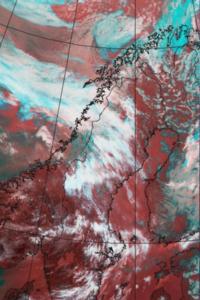
- The NOAA 345 image is the most suitable tool to study High Lee Cloudiness. In the 345 image Lee Clouds are seen as white and are well identifiable against the dark red colour of the surface.
- A stationary Ci plume of High Lee Cloudiness can extend hundreds of kilometres downwind from the mountain ridge and has a sharp edge over the mountain chain. In AVHRR images the plume may have either a uniform or striped appearance. Ci plumes develop at high levels, therefore they are seen as white or blue in NOAA 124 images and mainly white in NOAA 345 images.
- Lee Clouds are sometimes associated with strong down slope winds causing a narrow dry zone along the lee slope. This can result in a gap in the Lee Cloudiness just behind the mountain ridge, clearly identifiable in AVHRR images.
|
28 July 1999/15.34 UTC - NOAA RGB image (channel 1, 2 and 4)
|
28 July 1999/15.34 UTC - NOAA RGB image (channel 3, 4 and 5)
|
|
28 July 1999/15.34 UTC - NOAA Ch2 image
|
28 July 1999/15.34 UTC - NOAA Ch4 image
|
This example illustrates both of the above-mentioned Lee Cloud types. A strong west-northwesterly jet stream is blowing across the Norwegian mountains causing narrow cloud lines parallel to the mountain ridge; these lines are best seen in the NOAA 124 image. The Cirrus plume extends a few hundred kilometers downstream to central Sweden.
Meteorological Physical Background
There are two possibilities for air to flow past a mountain ridge. Either the air parcels go around the mountain or it is forced to rise over
the mountain: Which of these cases occurs, is dependent on several parameters:
The static stability (N), the height of the mountain or mountain ridge (h) and the wind component perpendicular to the mountain (U). The term
Nh/U combining these parameters gives an idea whether there is a flow across the mountain or not: If U is small the mountain is difficult to
cross; also if N increases (i.e. the atmosphere becomes more stable) the mountain will be more difficult to cross.
But even in the case of air partially streaming around the mountain, those streamlines approaching a greater height will cross the mountains.
When the wind has a component perpendicular to a mountain chain the air accumulation due to deceleration of wind speed by the obstacle on the upwind side creates high pressure. Part of the air is deflected upward giving rise to mountain waves. According to the theory of internal gravity waves, an air parcel within a stable stratified atmosphere will start to oscillate, as long as the waves are damped by friction.
Waves can only occur in a stable atmosphere. An air parcel which is removed from its original place cannot oscillate if there is no returning force. Lee Cloudiness will form where there is a sufficient supply of humidity near the wave crests and where there is upward motion. In the regions with downward motion the clouds will evaporate. The result is the pattern of parallel cloud lines perpendicular to the mountains.
One parameter to describe the state of the atmosphere in this situation is the Brunt - Vaisala frequency N2 which is defined by the following equation:

where
| T | temperature |
| θ | potential vorticity |
| g | gravity constant |
| cp | specific heat at constant pressure |
| N2>0 | stable atmosphere |
| N2 = 0.02 -0.03 | inversions |
| N2 = 0 | neutral atmosphere |
Another important parameter is the Scorer parameter (symbolised by I) which combines stability and characteristics of the wind field; it is approximated by following equation:

where
| U(z) | profile of the wind speed on the windward side of the mountains |
| N(z) | Brunt-Vaisala frequency |
The typical profile of the Scorer parameter shows a high gradient in low levels due to increasing wind speeds. Higher levels often show values of about 0.0005/m, rarely exceeding 0.001/m. The smaller the Scorer parameter the easier Lee waves are formed.
This parameter and the dimension of the mountain (L) determine if Lee Waves can be formed. The broader the mountain the easier waves can be formed. This relation can be expressed (assuming N and U are constant with height) by:

Indicating that no Lee Waves are formed, but perturbations which decrease with height.

Lee Waves are formed.
The dimension of a critical width (L) is several kilometres, increasing with wind speed, but decreasing with increasing stability. If a mountain is not wide enough, Lee Waves will not develop.
Lee Waves are a form of vertical energy propagation. At higher levels the density of the air is less, which means the amplitude has to increase. Therefore the wavelength increases with height, which clearly is reflected in the more extended area of High Lee Cloudiness.
The wavelengths also depend on the shape of the mountains. There often is a dominating wave length.
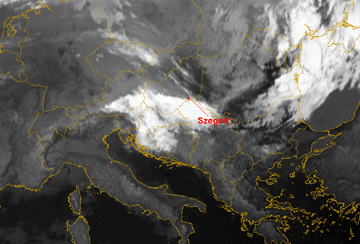
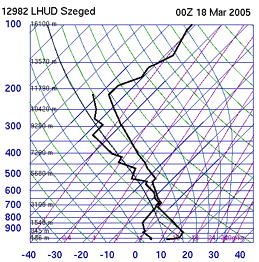
The example from 18 March 2005 shows some of the parameters mentioned above. The image shows a region with Lee Cloudiness extending from the South Alps to Hungary, Slovenia and Croatia. The nearest available radio sounding was Szeged which is indicated on the image. The Lee Cloud is quite high in this case and can be found just below 300 hPa.
|
18 March 2005/06.00 UTC - Meteosat 8 IR10.8 image
|
18 March 2005/00.00 UTC - radio sounding Szeged
|
The air column over Szeged shows a stable layer restricted by an inversion around 700 hPa. The Lee Cloudiness under consideration is within a stable layer. This is in agreement with the above mentioned statement that Lee Cloud can only develop in a stable atmosphere.
Trapped Lee Waves
A special class of Lee Waves are called "Trapped Lee Waves". This phenomenon is characterised by waves only occurring at lower levels. They occur when the vertical distribution of the Scorer-parameter can be approximated by two levels: an upper level with a quite low value for I(z), (due to the increase of wind speed and the decrease of the Brunt - Vaisala- frequency) and a lower level with a much higher value for I(z). In some cases (depending on the mountain range) the upper atmosphere cannot form waves, but the lower levels can. So the waves are trapped in this lower layer. In satellite imagery the height of the Lee Wave varies significantly from case to case. The trapped Lee Wave theory might be an explanation for apparently low cloud tops.
Sometimes in the lee of the mountains one can find inversions or at least strong stability near the surface and quite strong winds above it. Waves are found in these layers. In these situations displacements are large, which might result in a breaking of the waves.
N - S oriented mountain chain
If the N. - S. extent of a mountain range is large, effects of earth rotation are no longer negligible. As a consequence the flow over the mountain is no longer symmetrical. Due to changes in wind speed during ascent there is a changing in the strength of the Coriolis force. When a westerly flow passes a long mountain range extending north to south (e.g. the Scandinavian mountains) there will tend to be higher wind speeds to the south and lower wind speeds to the north.
Determination of Wind speed
The wind direction is quite similar at all levels but the wind speed increases with height. The typical wind speed lies between 10 and 20 m/s at the 700 hPa level, between 15 and 25m/s at the 500 hPa level and 15 to 35 m/s at the 300 hPa level. In literature it is said that - depending on the shape and scale of the mountain chain - the maximum wind is either found at the top of the mountain ridge or at the leeward side. Since ECMWF data were used in the study made by ZAMG, no change in the wind field by the mountains can be seen (restriction due to resolution).
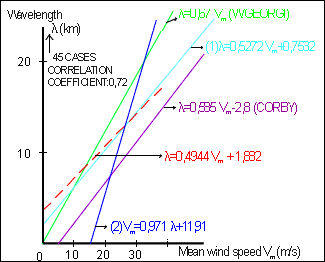
There is a connection between mean wind speed and wave length of Lee Waves, although with rather a low coefficient of correlation. It can be approximated by a linear function (the higher the wind speed the longer the waves). However, such a linear regression is only valid for a certain indicated area.
The above figure shows the correlation between mean wind speed and Lee Wave length (Cruette, 1976).
The straight lines symbolise different linear regressions found by several authors for different regions.
Unsolved problems
There are some unsolved questions relating to Lee Cloudiness which is discussed below:
Lee Cloud exceeds the mountain ridge line
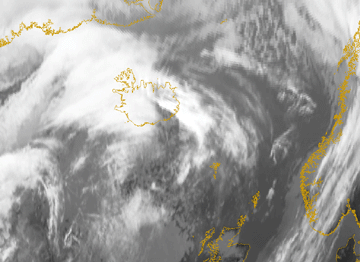
There are cases which give the impression that Lee Cloudiness is more extensive than suggested by the orography. This can even lead to apparent "Lee Cloudiness" over the sea.
|
22 March 2007/12.00 UTC - Meteosat 8 IR10.8 image
|
|
This effect is sometimes observed east of Iceland but it is difficult to find an explanation.
Cloud stripes parallel to the wind direction
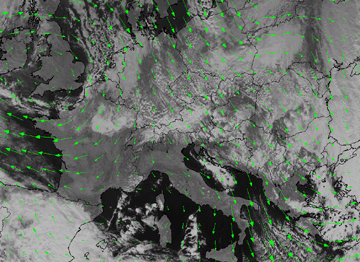
There are sometimes cloud stripes aligned parallel to the wind direction. They look like waves, but they are, in fact, perpendicular to the typical direction of Lee Waves.
There are some possible explanations:
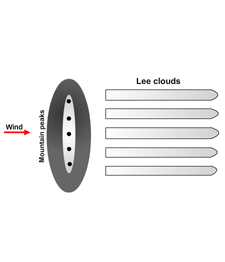
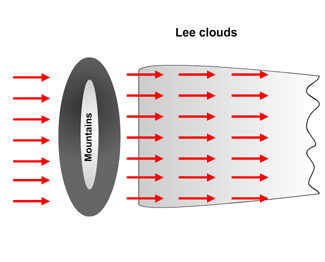
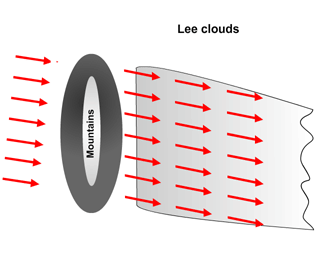
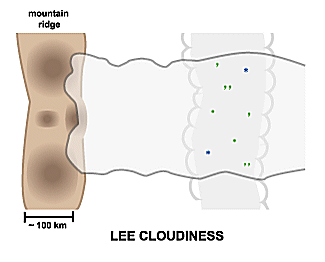
The single lee bands are generated separately by each mountain, so the cloudiness follows the orography (as shown below). Arguments in favour are:
- The stripes usually occur at the same location.
- These stripes seem to be partially developed Lee Cloudiness, i.e. the airflow over the mountain range does not show wave characteristic over the whole length of the chain but only over some specific locations favoured.
|
|
03 November 2006/12.00 UTC - Meteosat 8 HRVIS image; green: wind vectors 850 hPa
|
Key Parameters
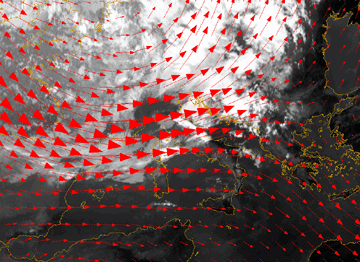
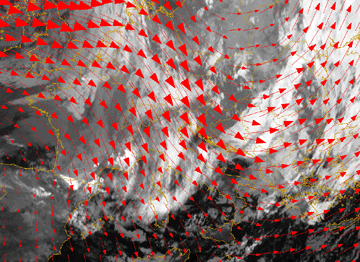
Wind direction with respect to the orientation of the mountain chain is the most important parameter when detecting Lee Cloudiness of either type. The wind direction need not necessarily be perpendicular to the mountain chain but there must be a normal component. In the Pyrenees region most wind directions can produce High Lee Cloudiness (only east winds were found not to do so, but this is more due to general climatology). The orientation of the developed High Lee Cloud is consistent with the direction of the wind flow causing it.
|
|
04 July 2007/06.00 UTC - Meteosat 8 IR10.8 image; red: wind vectors 500 hPa
|
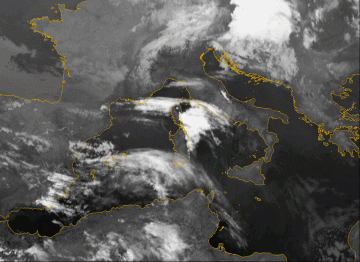
In this case there are westerly winds. The Lee Cloudiness is formed over the mountains in Corsica which are oriented perpendicular to the wind direction. The Lee clouds can be found over the Mediterranean and extend even over Italy.
|
|
13 November 2006/00.00 UTC - Meteosat 8 IR10.8 image; red: wind vectors 500 hPa
|
The image shows Lee Cloud formation at the Austrian and Swiss Alps: Wind flow from the north results in High Lee Cloudiness south of the mountain ridges. The cloud features are parallel to wind direction.
|
|
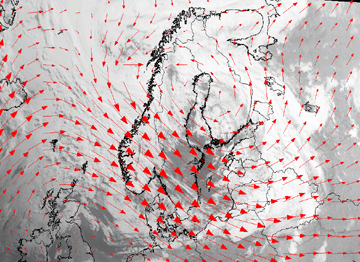
28 June 2005/04.45 UTC - Meteosat 8 HRVIS image, red: wind vectors 500 hPa
|
Lee Waves formed over mountains in Norway are orientated perpendicular to the wind direction.
Jet axis and thickness
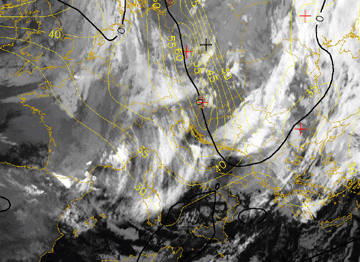
High Lee Cloudiness often occurs along the right (anticyclonic) side of a jet stream, and sometimes in the jet exit region. Often it can be observed in baroclinic zones on the leading side of the synoptic-scale thickness ridge.
|
|
13 November 2006/00.00 UTC - Meteosat 8 IR10.8 image; yellow: isotachs 300 hPa, black: zero line of shear vorticity 300 hPa
|
In this image Lee Cloudiness at the Alps is situated along the anticyclonic side of the jet axis, indicated by the zero line (solid) of shear vorticity.
Stability (Showalter index)
The Showalter index ranges from 3 to 12 which indicate a stable atmosphere.
Looking more closely at stability (Showalter index is only the mean value of a layer) radio sondes mostly show a stable layer on top of a conditionally unstable layer. Above there is again a conditionally unstable layer. (see Meteorological physical background ).
Typical Appearance In Vertical Cross Sections
As Lee Cloudiness is a small- to meso-scale feature at high levels, vertical cross sections of a global model are not very indicative.
Weather Events
Since Lee Cloudiness develops in a stable stratified atmosphere and is characterised by clouds with generally small vertical extent, normally there is no convective activity nor precipitation.
| Parameter | Description |
| Precipitation |
|
| Temperature |
|
| Wind (incl. gusts) |
|
| Other relevant information |
|
|
|
18 March 2005/06.00 UTC - Meteosat 8 IR10.8 image; weather events (green: rain and showers, blue: drizzle, cyan: snow, red:
thunderstorm, black: no precipitation)
|
References
- CRUETTE (1976): Experimental study of mountain lee - waves by means of satellite photographs and aircraft measurements, Tellus, 28, 1976, 9-523
- DURAN, KLEMP (1982): The effects of moisture on trapped lee - waves, Quart. J. Roy. Met. Soc. 39, 1982, 2490-2506
- LOTT, TEITELBAUM (1993): Topographic waves generated by a transient wind, J. Atmosph. Sci., 50, 1993, 2607 - 2624
- PITTS, LYONS (1990): Airflows over two dimensional escarpment, Quart. J. Roy. Meteor. Soc., 116, 1990, 363-378
- RALPH , NEIMAN ET AL (1997): Observations, Simulations, and Analysis of Nonstationary Trapped Lee Waves, J. Atmosph. Sci. 54, 10, 1997, 1308 - 1333
- SCORER (1949): Theory of waves in the lee mountains, Quart. J. Roy. Met. Soc., 75, 1949, 41 - 56
- SHUTTS, BROAD (1993): A case study of lee waves over the Lake District in northern England, Quart. J. Met. Soc., 119, 511, 1993, 77-408
