Table of Contents
Cloud Structure In Satellite Images
- The satellite image shows an area of increased cloud fraction (vertically and horizontally) within the frontal cloud band which also has a PVA maximum at 300 hPa superimposed on it (see Key parameters );
-
the increased cloud fraction can appear in two forms:
- Lumpy structure, which indicates embedded CBs
- Wave-like configuration, as a consequence of formation by cyclonic vorticity;
Appearance in the basic channels
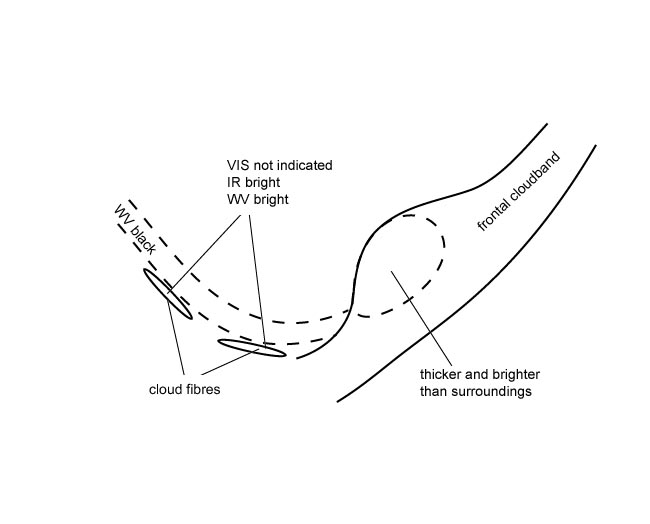
- VIS, IR and WV images show bright grey shades, indicating thick cloudiness (see Typical appearance in vertical cross section );
- this cloud feature is clearly brighter than the surrounding frontal cloudiness (see Key parameters );
- at the rear of the frontal cloud band, WV imagery indicates a jet axis pointing approximately perpendicular to the cloud band by a Black Stripe as well as Cloud Fibres which may also be seen in the IR image.
|
Appearance in the basic RGBs
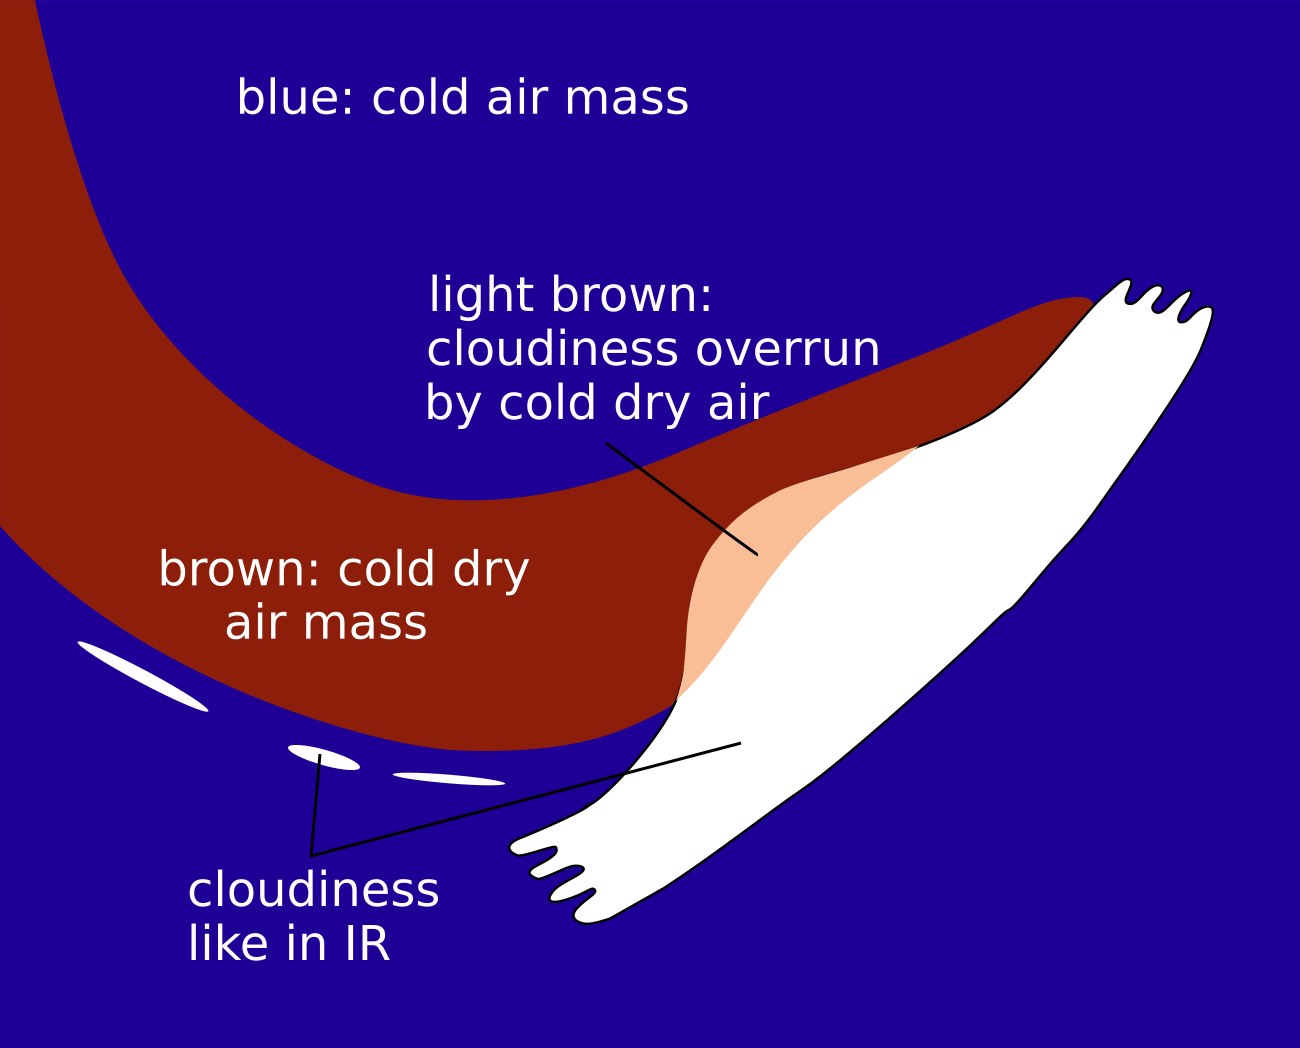
Airmass RGB
The increased cloud fraction associated with the “FI by Jet” area develops at the rear of the frontal cloud band. Behind the frontal cloud band and near the increased area of an “FI by Jet” there is a more or less broad, dark brown stripe which represents the dry cold air on the cyclonic side of the jet streak.
The increased cloud area of the “FI by Jet” looks very similar in the IR image. Sometimes there is a brownish shade at the rear of the “FI by Jet” area which shows that dry air is overrunning the frontal cloud band.
Dust RGB
At the rear of the “FI by Jet” cloud area the dust RGB shows blue colours where there are no other clouds. However, overall, there is the typical cold air cloudiness in this cold air outbreak which appears as ochre cells in the dust RGB. Some of them can also have a dark red appearance if they reach a greater vertical extension.
The cloud area of the "FI by Jet" sometimes shows up as dark red with some lumpy texture indicative of the thick convective cloud which is often higher and also thicker than in the surrounding Cold Front cloud band.
 |
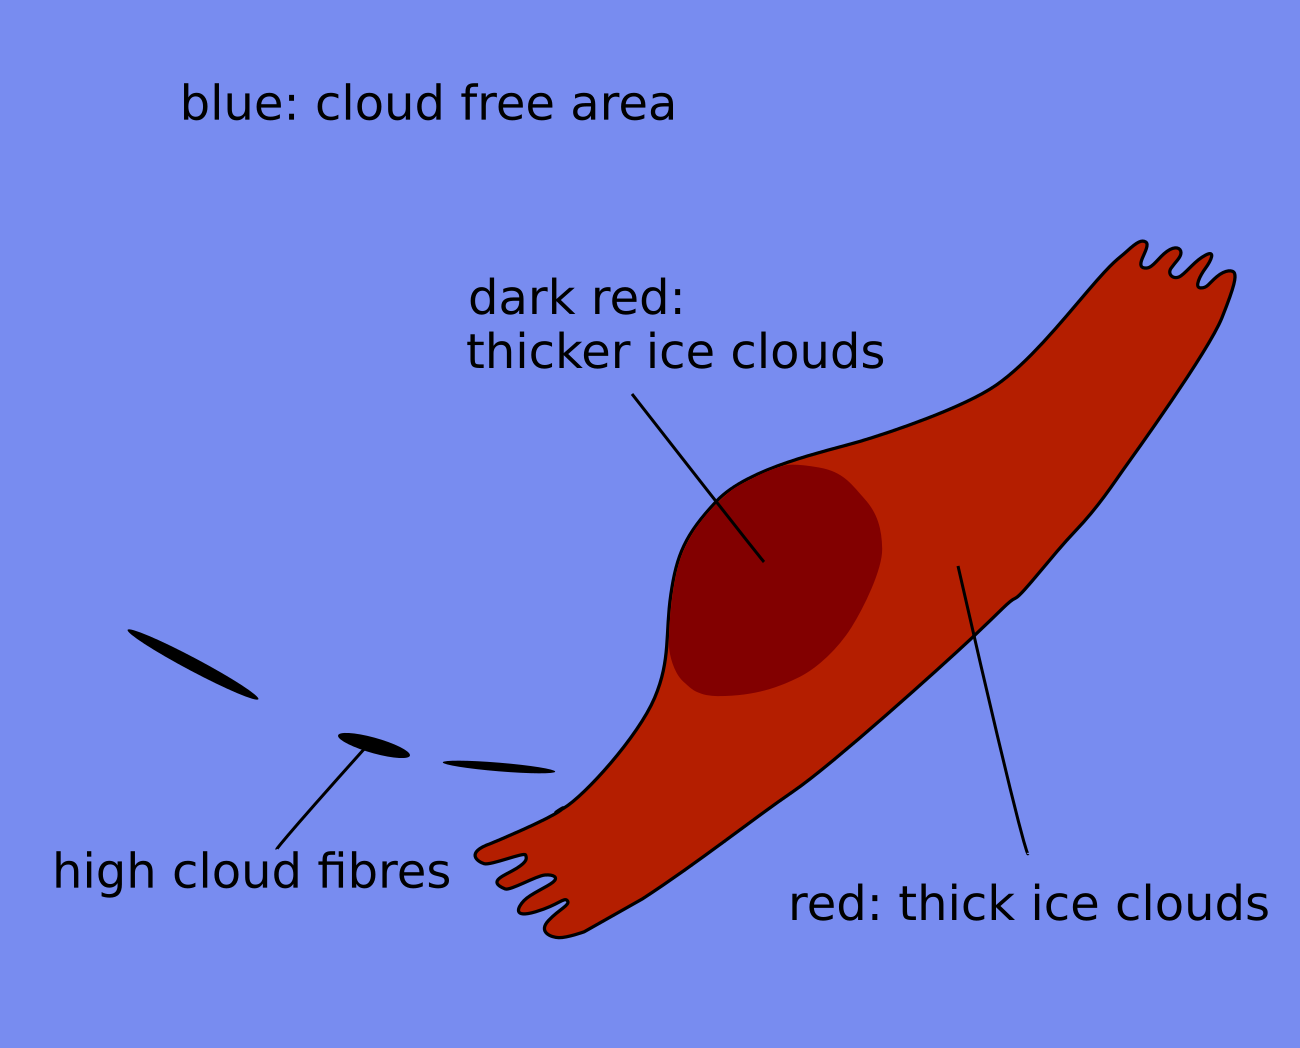 |
Legend: Schematics of basic RGBs.Left: Airmass RGB; right: dust RGB.
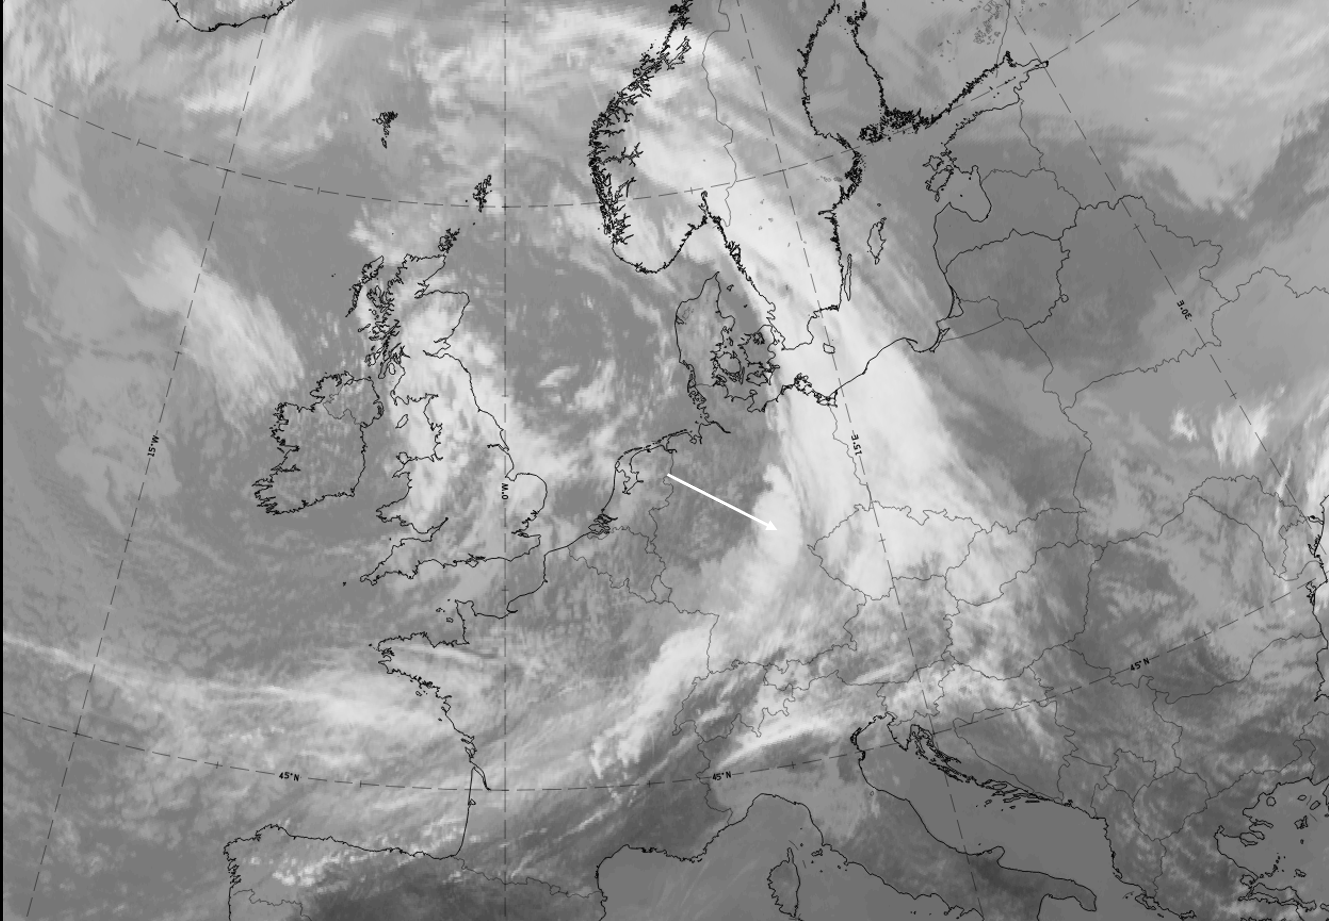
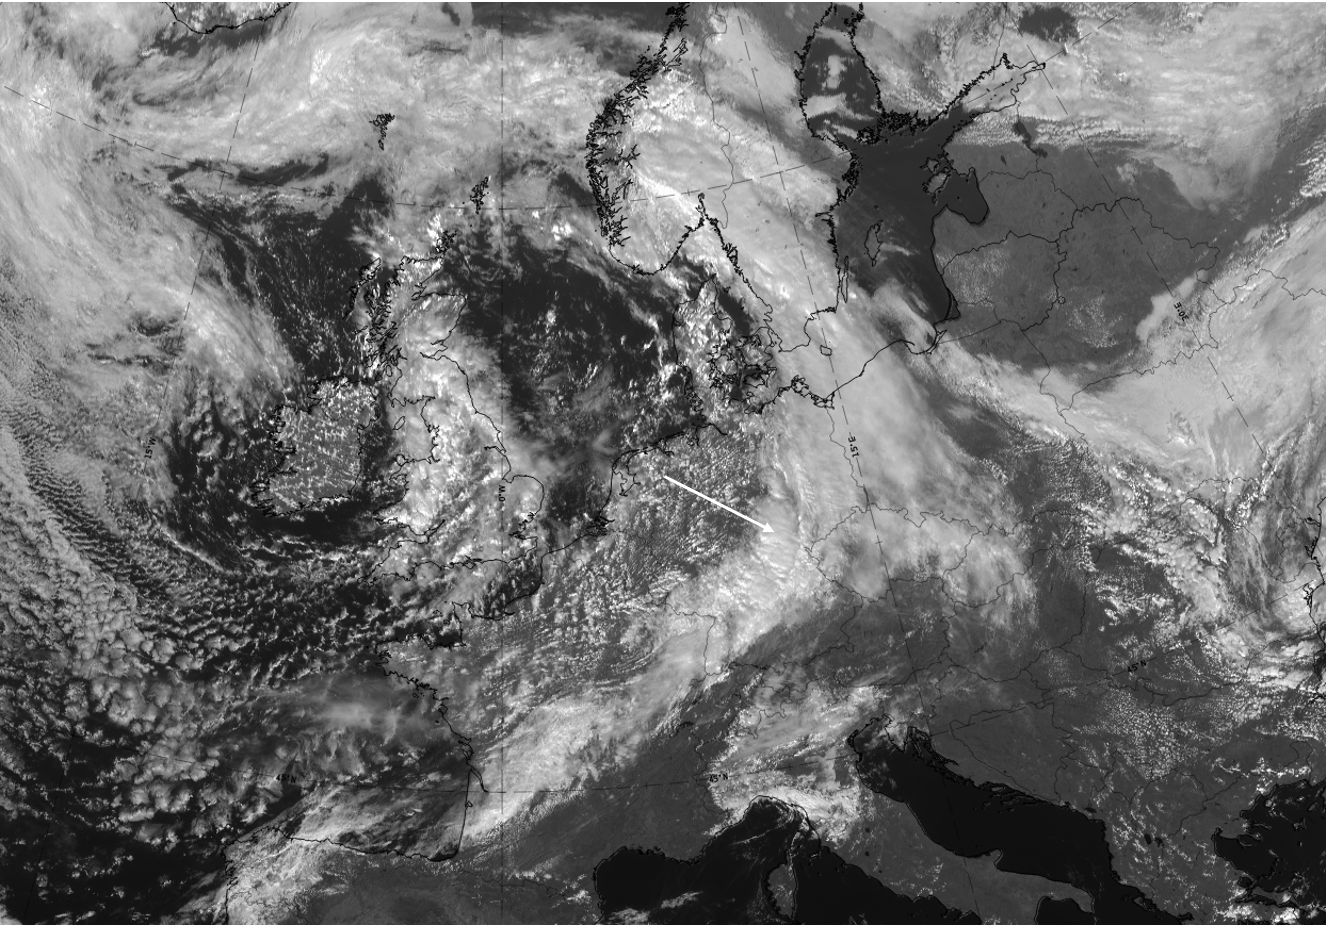
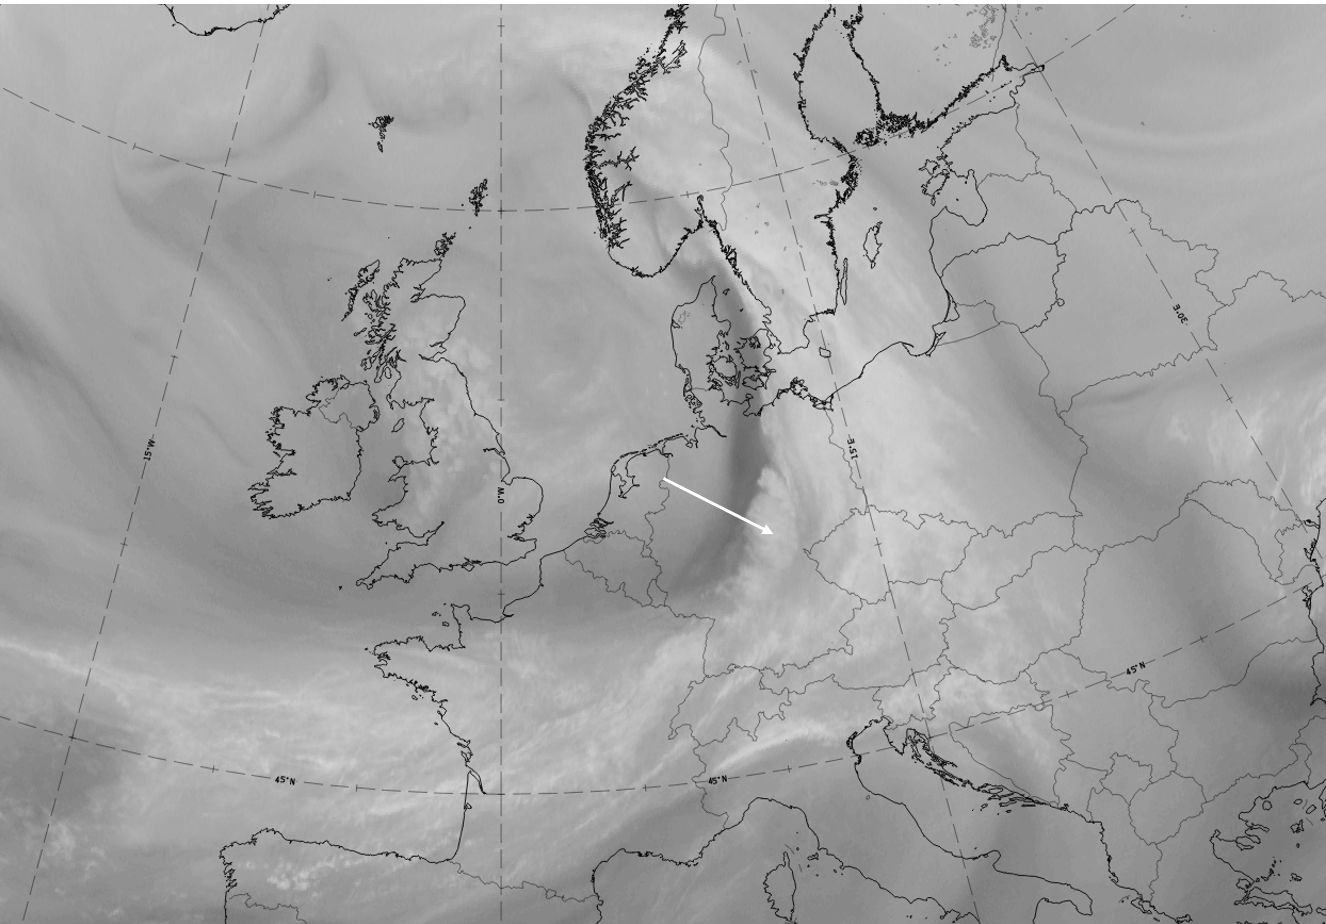
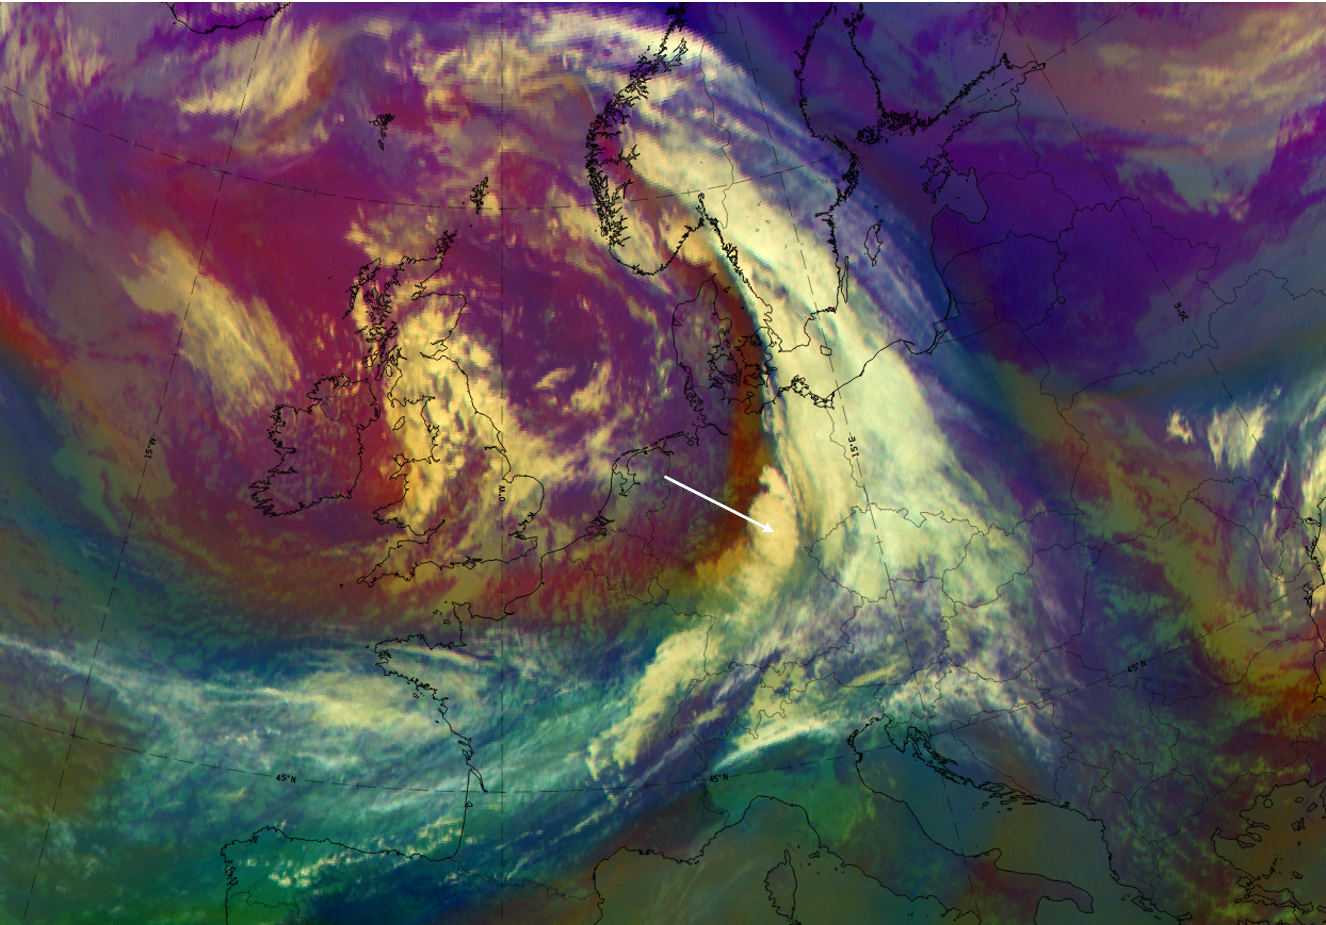
The case from 27 September 2019 at 12 UTC shows a large-scale frontal cloud band extending from France and across Germany to South Sweden and Norway. Additionally, an intensified cloud area can be observed over Germany.
|
|
|
|
27 September 2019, 12UTC: u.l.: IR, u.r.: HRV; m.l.: WV (6.2 μm), m.r.: Airmass RGB; l.l.: Dust RGB.
*Note: click on the Dust RGB image to access image gallery (navigate using arrows on keyboard)
| IR | White with convective cellular structure; jet fibres at the rear of the cloud band and the “FI by Jet” are not as distinct ion this case. They exist more to the SW from Brittany, eastward across France (more visible in the Dust RGB) |
| HRV | White with convective cellular structure. |
| WV | White with convective cellular structure; dark stripe at the rear representing sinking dry air. |
| Airmass RGB | Dark brown and/or blue behind the cloud band representing the cold and dry air; structures of "FI by Jet" similar to IR but with a brownish shadow indicating overrunning dry air. |
| Dust RGB | Dark red colours in the “FI by Jet” indicating thick ice cloud above the ochre colours for mid-level cloud; black cloud fibres indicate high translucent cloud at the jet axis; in this case something can be seen over France but it is not as distinct as it often is in other cases. |
Meteorological Physical Background
If a jet streak approaches and crosses a frontal zone at a large acute angle, horizontal and vertical increase of frontal cloudiness in the left exit region of this crossing jet streak can be observed. These cloud phenomena are produced by the interaction between front and jet streak. The intensification of cloudiness within the left exit region is caused by the following processes:
- the frontal circulation (for instance an Ana Cold Front) causes lifting processes within the front;
- the cross circulation in the left exit region of a jet streak causes an intensification of the temperature gradient (frontogenesis);
- a PVA maximum in the left exit region contributes to upward motion.
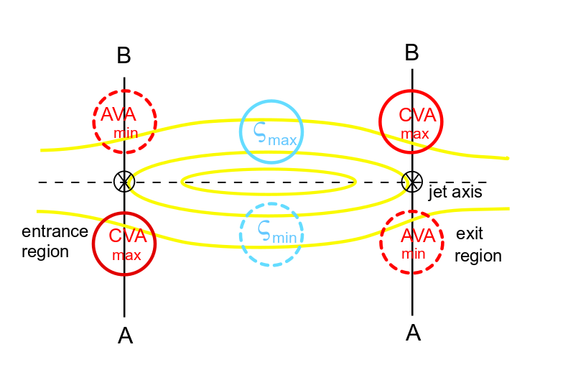
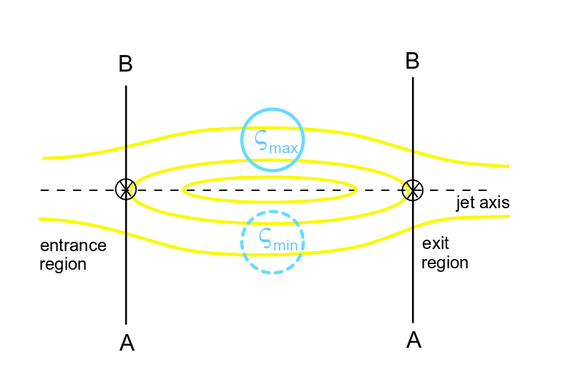
The typical distribution of convergence and divergence, which is caused by the vertical circulation in the area of the exit and entrance region of a jet streak, can be explained as follows: As a consequence of the increased wind shear in the centre of the jet streak a maximum of cyclonic relative vorticity can be found on the cyclonic side and a maximum of anticyclonic relative vorticity on the anticyclonic side of the jet axis. As the jet streak propagates downstream, a maximum of positive vorticity advection exists in the left and a maximum of negative vorticity advection in the right exit region. In the area of the entrance region the situation is reversed. On the other hand, as a consequence of the acceleration of the air parcels in the entrance and deceleration in the exit region, ageostrophic wind components can be found. These wind components point, at the jet level, from the anticyclonic to the cyclonic side in the entrance region and from the cyclonic to the anticyclonic side in the exit region. As a consequence of vorticity advection and ageostrophic winds, convergence can be found in the right exit and left entrance, divergence in the left exit and right entrance region at upper levels of the troposhere (at approximately 300 hPa - jet level).
Often it also can be observed that enhanced cloudiness develops within the left exit region of a jet streak in the cold air mass in the upper level trough behind a Cold Front. This kind of cloudiness can be seen in the satellite image either as cellular clusters (see Enhanced Cumulus ) or as a comma-formed cloud band (see Comma ).
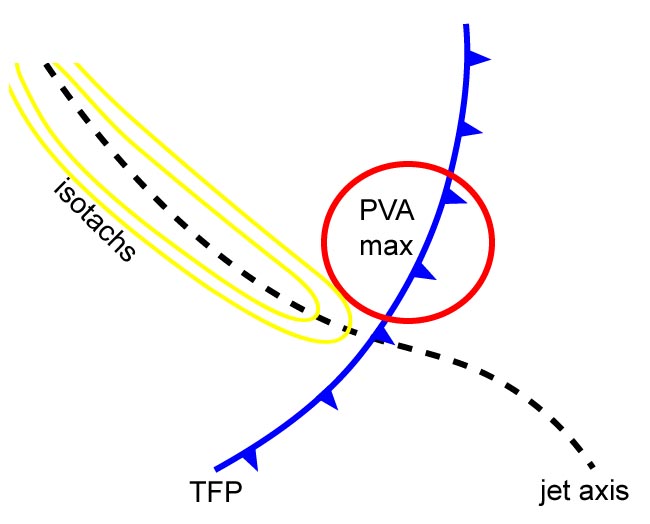
The model of the frontal intensification by a jet streak, shown in the figures below, is an idealized model, which describes a straight or only very slightly curved jet streak. But in reality the curvature of the jet is usually stronger. Therefore positive vorticity advection can be found on the cyclonic as well as on the anticyclonic side of the jet axis. But as a consequence of the additional cyclonic shear, the main PVA maximum remains on the cyclonic side close to the jet axis.
|
|
Key Parameters
- Positive vorticity advection (PVA):
- Shear vorticity at 300 hPa:
- Isotachs:
- Thermal front parameter (TFP):
-
The enhanced cloudiness lies in the left exit region and has superimposed upon it a fairly strong maximum of PVA at 300 hPa.
-
The cloud field of the Front Intensification by Jet Crossing lies at the cyclonic side of the zero line of the shear vorticity at 300 hPa, which indicates the jet axis.
-
The increased cloudiness lies within the left exit region of a well developed jet streak.
-
The thermal front parameter indicating the Cold Front, and the zero line of the shear vorticity indicating the jet axis, form an acute angle, sometimes nearly perpendicular.
|
12 August 2005/12.00 UTC - Meteosat 8 IR 10.8 image; red: positive vorticity advection (PVA) 300 hPa, yellow: isotachs 300 hPa
|
|
|
|
Typical Appearance In Vertical Cross Sections
Isentropes of equivalent potential temperature show a Cold Front-like gradient zone, which can often be separated into two parts: a surface and an upper level Cold Front. The surface front generally is more pronounced in the cross section than the upper level front.
The field of vorticity advection is characterized by small values of NVA within the area of the surface front up to about 700 hPa. Above 700 hPa, and within the whole frontal area, PVA can be found. The values of PVA are continuously increasing from approximately 700 hPa up to the jet level, which is situated at approximately 300 hPa. The maximum of PVA can be found between 350 and 250 hPa in front of the gradient zone of the isentropes, which is above the surface Cold Front.
In the ideal case the maximum isotachs should be found upstream from the PVA maximum, but according to the position of the cross section and the stage of development it can also be close to the PVA maximum.
The satellite image shows, in the area of Front Intensification in the VIS, IR and WV images, high pixel values indicating multilevel cloudiness (see Cloud structure in satellite image ). The difference in the grey shades between the area of Front Intensification by Jet Crossing and surrounding areas is much more pronounced in the IR image than in the WV image.
|
12 August 2005/12.00 UTC - Meteosat 8 IR10.8 image; position of vertical cross section indicated
|
|
|
|
|
12 August 2005/12.00 UTC - Vertical cross section; black: isentropes (ThetaE), green thick: vorticity advection - PVA, green thin: vorticity advection - NVA, orange thin: IR pixel values, orange thick: WV pixel values
|
|
|
|
|
12 August 2005/12.00 UTC UTC - Vertical cross section; black: isentropes (ThetaE), yellow: isotachs, orange thin: IR pixel values, orange thick: WV pixel values
|
|
|
|
Looking at the satellite image, see where the cross section appears in the image. Equivalent potential temperature plots show a frontal zone which is well developed in upper levels. Top: The PVA maximum and highest IR and WV signals coincide perfectly around 54N/10W. Bottom: The isotach maximum is situated upstream of the PVA maximum above the gradient zone of the equivalent potential temperature, around 57N/18W.
Weather Events
Where there is no orography, cloud fraction in mid- and high- levels dominate with slight to moderate rain or drizzle at the surface.
| Parameter | Description |
| Precipitation |
|
| Temperature |
|
| Wind (incl. gusts) |
|
| Other relevant information |
The case of 27 September 2019/12 UTC is also appropriate for the demonstration of weather events.
|
|
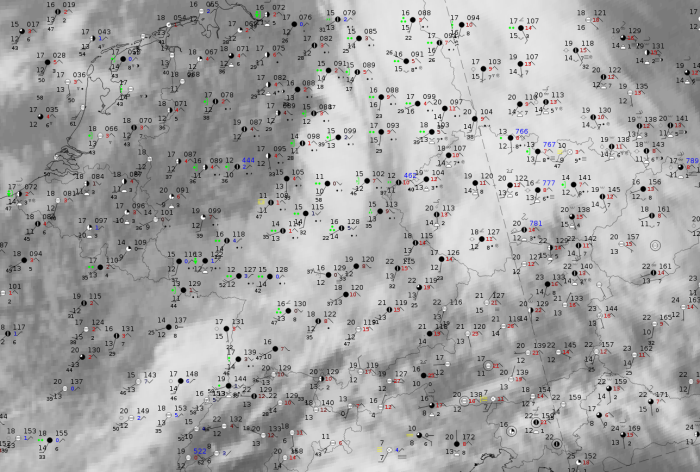
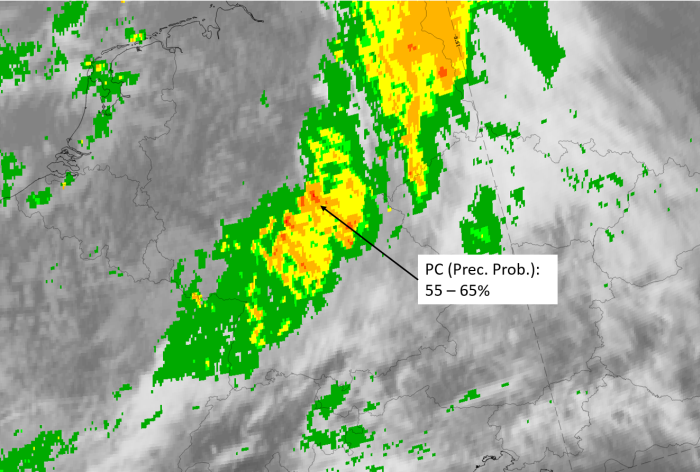
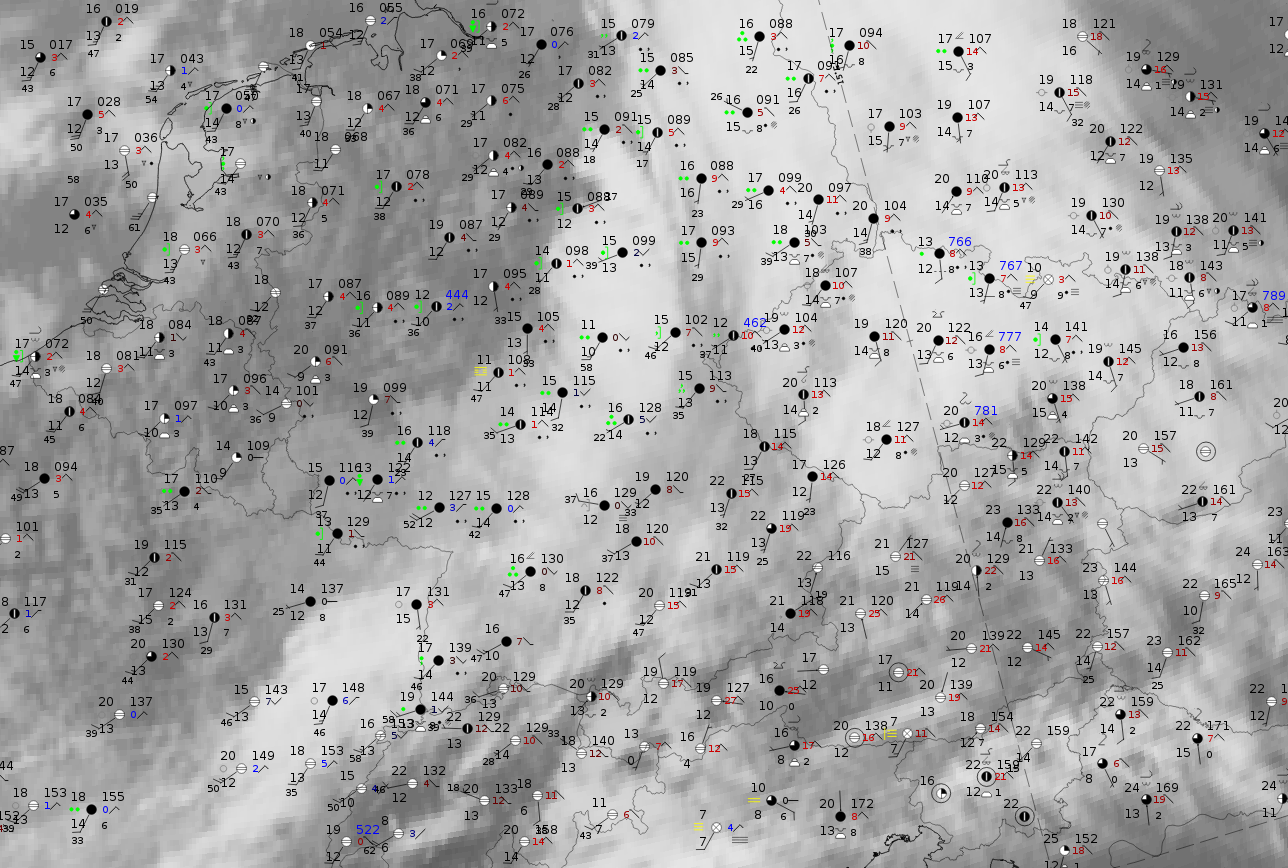
Legend: 27 September 2019, 12UTC: left: IR + synoptic measurements; right: probability of moderate rain (Precipitating clouds PF - NWCSAF).
Note: for a larger SYNOP image click this link.
Nearly all stations report heavy rain in this area of the "FI by Jet" and precipitation Probability from NWCSAF shows high values at least up to 65%.
|
|
|
|
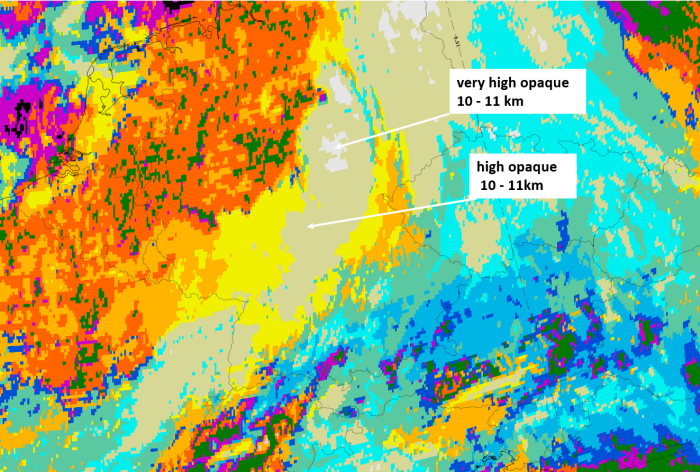
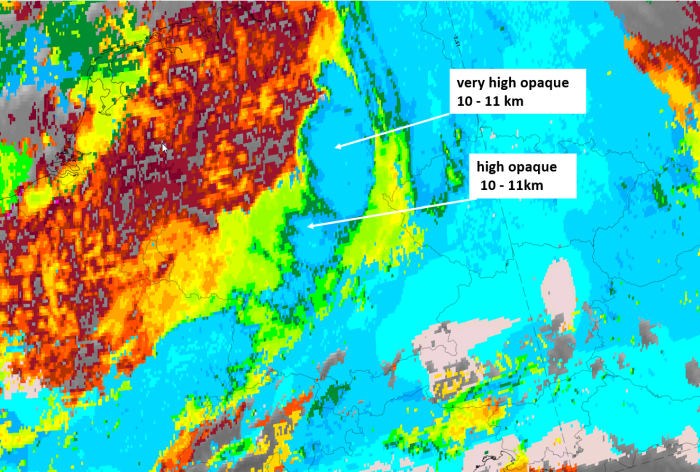
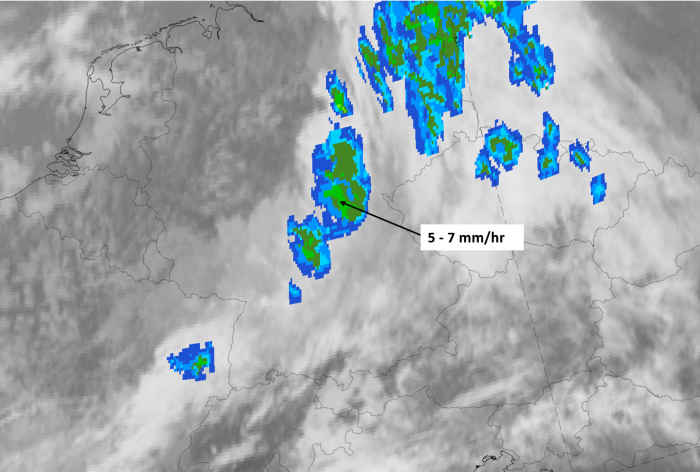
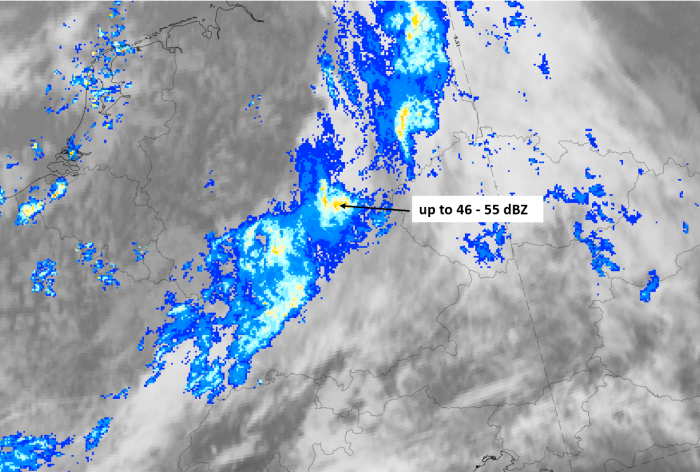
Legend:
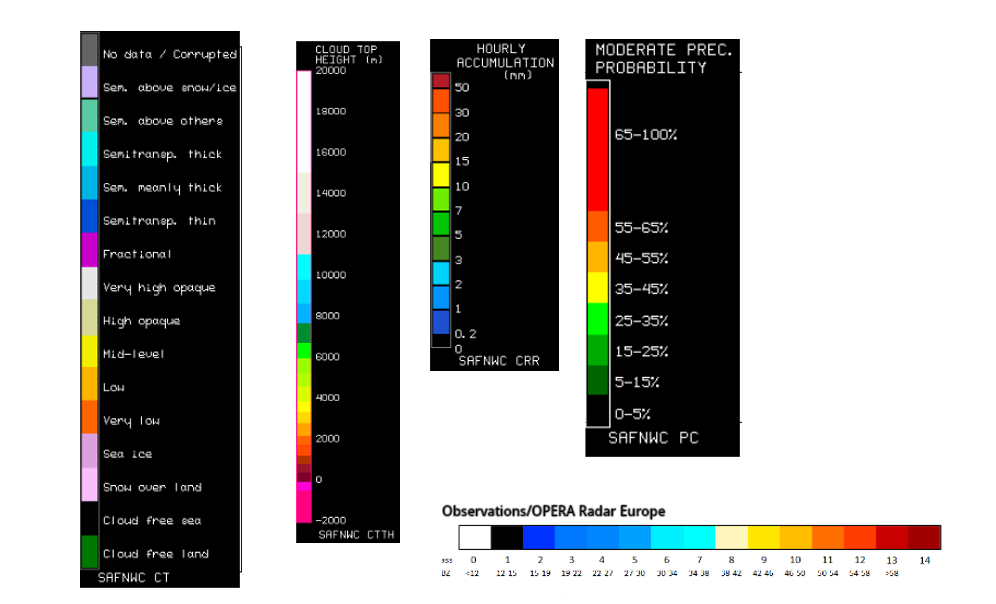
27 September 2019, 12 UTC, IR ; superimposed: u.l.: Cloud Type (CT NWCSAF); u.r.: Cloud Top Height (CTTH - NWCSAF); l.l.: Convective Rainfall Rate (CRR NWCSAF); l.r.: Radar intensities from Opera radar system.
For identifying values for Cloud type (CT), Cloud type height (CTTH), precipitating clouds (PC), and Opera radar for any pixel in the images look into the legends. (link).
References
General Meteorology and Basics
- BROWNING K. A. (1985): Conceptual models of precipitation systems; Met. Mag., Vol. 114, p. 293 - 317
- BROWNING K. A. (1986): Conceptual models of precipitation systems; Weather & Forecasting, Vol. 1, p. 23 - 41
- ROWNING K. A. (1990): Organization of clouds and precipitation in extratropical cyclones; in: Extratropical Cyclones, The Erik Palmen Memorial Volume, Ed. Chester Newton and Eero O Holopainen, p. 129 - 153
- CONWAY B. J., GERARD L., LABROUSSE J., LILJAS E., SENESI S., SUNDE J. and ZWATZ-MEISE V. (1996): COST78 Meteorology - Nowcasting, a survey of current knowledge, techniques and practice - Phase 1 report; Office for official publications of the European Communities
Specific Satellite Meteorology
- BADER M. J., FORBES G. S., GRANT J. R., LILLEY R. B. E. and WATERS A. J. (1995): Images in weather forecasting - A practical guide for interpreting satellite and radar imagery; Cambridge University Press
- ZWATZ-MEISE V. (1987): Satellitenmeteorologie; Springer Verlag, Berlin - Heidelberg - New York - London - Paris - Tokyo
- ZWATZ-MEISE V. and MAHRINGER G. (1990): SATMOD: An interactive system combining satellite images and model output parameters; Weather & Forecasting, Vol. 5, p. 233 - 246
General Satellite Meteorology
- BROWNING K. A. and PARDOE C. W. (1973): Structure of low-level jet streams ahead of mid-latitude cold fronts; Quart. J. R. Meteor. Soc., Vol. 99, p. 619 - 638
- MADDOX R. A. and DOSWELL CH. A. III (1982): An examination of jet stream configurations 500 mb vorticity advection and low level thermal advection patterns during extended periods of intense convection; Mon. Wea. Rev., Vol. 110, p. 184 - 197
- SHAPIRO M. A. (1981): Frontogenesis and geostropically forced secondary circulations in the vicinity of jet stream - frontal zone systems; J. Atmos. Sci., Vol. 38, p. 954 - 973
- UCCELLINI L. W. and JOHNSON D. R. (1979): The coupling of upper and lower tropospheric jet streaks and implications for the development of severe convective storms; Mon. Wea. Rev., Vol. 107, p. 682 - 703
- UCCELLINI L. W. (1990): Process contributing to the rapid development of extratropical cyclones; in: Extratropical Cyclones, The Erik Palmen Memorial Volume, Ed. Chester Newton and Eero O Holopainen, p. 81 - 105
- ZWATZ-MEISE V. (1990): Use of satellite images for diagnosis and prognosis of certain jet streak phenomena; Proceedings of 8th Meteosat Scientific Users' meeting, Norrköping, Sweden, 28 - 31 August 1990, p. 151 - 160