Table of Contents
Cloud Structure In Satellite Images
Foehn is a special weather situation which appears on the lee side of a mountain chain in the situation where an air stream is crossing it perpendicularly. It is a weather situation characterised by very strong, dry and warm winds. There are also features in satellite imagery connected to these processes which appear as typical modifications of pre-frontal and frontal clouds. Four case studies stemming from half a year are investigated in detail in this chapter; all from the Alpine region.
- The satellite images shows a Cold Front, Warm Front or Occlusion cloud band crossing mountain ranges
- During the passage a typical modification of the leading parts of the frontal cloud takes place
- In the IR10.8 image:
- Darker grey shades develop on the windward side connected to the Barrage cloud
- A cloud free wedge/band develops within the mountain area; sometimes some Orographic Convergence Lines, in the form of dark grey cells/lines can be seen in the cloud free area;
- Very bright cloud with a sharp boundary at the "outermost" mountain range extends downstream; this is high Lee Cloud;
- Lee Cloud sometimes becomes detached in due course.
- In the VIS0.6/HRVIS image
- A bright cloud field appears on the windward side representing Barrage cloud
- A cloud free wedge/band develops within the mountain area; sometimes some Orographic Convergence Lines, in the form of white cells/lines can be seen in the cloud free area.
- On the lee side different types of clouds are possible:
- No clouds or only sporadic small scale low cloud on the lee side with some fibrous cloud superimposed where there is high Lee Cloud;
- Dense frontal cloudiness (white to light grey) with smooth structures where the high Lee Cloud is superimposed upon lower cloud.
- In the WV7.3 image:
- The WV7.3 image shows the same features as the IR10.8 image.
The channels used for the images below show very well many of the features summarised above: the different grey shades (in the VIS0.6 and IR10.8 image) of the cloud on the windward and lee side (in this case S and N of the Alps); the generally cloud free band within the mountain chain; the similarity between IR10.8 and WV7.3 image.
|
27 January 2008/00.30 UTC - Meteosat 9 IR10.8 image
|
27 January 2008/08.45 UTC - Meteosat 9 HRVIS image
|
|
|
|
|
|
27 January 2008/00.30 UTC - Meteosat 9 WV7.3 image
|
27 January 2008/08.45 UTC - Meteosat 9 HRVIS RGB (HRVIS; HRVIS; IR10.8) image
|
Foehn in the Alps
As has just been demonstrated in the North Foehn example above, one mountain range which frequently produces Foehn events is the Alps. Intensive Foehn appears north/south of the Alps when there is a distinct southerly/northerly stream ahead of a frontal cloud band approaching from the W; under such circumstances a life cycle can be observed:
- Approach of a (broad) multilevel frontal cloud band from the W to SW sector; Foehn substructures appear when the frontal cloud band reaches the W. Alps and Switzerland;
- Lowering of the cloud tops S of the Alps;
- Development of a cloud free wedge extending from Switzerland to E. Austria;
- Development of the high Lee Cloud especially over E. Switzerland and Austria extending downstream into Germany;
- Development of a cloud free (very dark in IR) small scale area N of the Alps over W. Austria and Bavaria;
- This development takes place at the same time as the separation of Lee Cloud;
- W-E movement of all these features as the front moves east.
|
|
|
|
|
The IR image loop shown below is typical of a case where the mesoscale changes appearing within the multi-layered frontal cloud band are very distinct in the IR. The lowering of the cloud tops south of the Alps can be seen as well as the development of a cloud free band over the mountain chain combined with the development of high Lee Cloud to the north. A bit later an even darker small scale area develops over W. Austria moving eastward.
|
06 November 2000/06.00 UTC - Meteosat IR image; 06.00 - 17.00 UTC hourly image Loop
|
|

A VIS/IR combination loop shows similar changes and allows the evaluation of the two channels in combination. Very pronounced is the yellow area S of the Alps representing the Stau Cloud and the more bluish colours N of the Alps representing high Lee Cloud. The development of the cloud free wedge within the mountains as well as the development of a small scale cloud free area can also be observed. In the end phases the eastward shift of this cloud free area and the simultaneous detachment of the Lee Cloud are the most pronounced features.
|
28 February 2000/07.30 UTC - Meteosat VIS + IR image; 07.30 - 15.30 UTC hourly image Loop
|
|
Another area in Europe where Foehn events can be observed are the Scandinavian mountains.
Foehn in the Scandinavian mountains
The Foehn events (with wind having a distinct westerly component) of the Scandinavian mountains are characterized by:
- an aggregation of low and middle level clouds (barrage cloud) on the windward side of the mountain chain
- upper-level Lee Cloudiness on the lee side of the mountains in the south and central parts of Scandinavia
However, these cloud configurations are regularly disturbed by other effects, such as the complex land-sea distribution. Also, due to the rather rare nature of the foehn phenomenon, its contribution to the average distribution of cloudiness in the region is not apparent.
There is a distinct seasonal variation in the cloudiness: In summer the mountain chain creates convective cloudiness which tends to mask the cases with pure Foehn clouds on the windward-leeward side of the mountains.
In winter, however, the effects of the mountains can be seen even in average cloudiness maps. During strong westerly flow a distinct minimum in cloudiness can be seen to the lee of the mountains. The image below roughly delineates the area with minimum cloudiness in a winter period with very high NAO (North-Atlantic Oscillation) index values. Very high NAO index values indicate strong westerly flow.
Strong Foehn winds are produced in both westerly and southerly flows. These incidents are characterized by a deep low pressure system located near Scotland or the North Sea, and with the surface flow being mainly from southeast. Strong Foehn processes caused by the mountain range Breheimen - Dovre - Sylene in Southern Norway can lead to local, strong down slope winds. In these cases the satellite IR imagery shows a characteristic dry slot in the frontal zone and a sharp-edged lee-side Cirrus sheet east of the dry slot. As in the Alpine Foehn, a narrow cloud-free area at the top of the mountain range can be seen.
|
31 March 1994/14.30 UTC - Meteosat IR image; 14.30 - 20.00 UTC half-hourly image Loop
|
|
Another area where Foehn effects are frequently seen in satellite images is the Spanish N coast and the Pyrenean mountains.
Foehn at the mountain ridges in N. Spain
|
15 March 2008/09.30 UTC - Meteosat 9 IR10.8 image
|
15 March 2008/09.30 UTC - Meteosat 9 HRVIS RGB (HRVIS, HRVIS, IR10.,8) image
|
|
|
The images above show some of the typical Foehn features: within the southerly stream ahead of an approaching frontal cloud band high clouds (blue in the HRVIS RGB image) can be seen at the mountain ranges along the N. coast as well as along the Pyrenees while high Lee Cloud (blue in the IR+VIS image) extends from the highest mountain chains northward into France and the Bay of Biscay. A distinct Foehn window is seen in both images just north of the mountain ridge.
List of Foehn or Foehn-like winds and their local names:
| Andes | Puelche |
| Argentinia, Andes | Zonda |
| Austria, Carinthia | Jochwind, Jauk |
| Canary Islands, Central Massive | Levanto |
| Central Asia, Mongolia | Ebe |
| Dinarian Mountains | Livas |
| Faeroe Islands | Glaves |
| France, Alps, N - Foehn | Bise (noir) |
| Greece, Gulf of Saloniki | Vardarac |
| Gulf of Arden | Belat |
| India, S of Himalaya | Bhoot |
| Indonesia, Celebes | Gending |
| Lee of Rocky Mountains | Chinook |
| New Guinea, during E - Monsoon | Wambra |
| New Zealand, Southern Island | Northwester |
| Oman, Hajr Mountains, during SW - Monsoon | Muscat |
| Poland, S - Foehn of the Tatra | Halny Wiatr |
| Romania, Southern Carpatian Mts. | Talmesch |
| Romania, Eastern Carpatian Mts. | Austru |
| Serbia, from Kosovo - Mts. in the S | Kossava |
| Sicily, Nebrodi Mts. | Scirocco |
| Spain, Central Sierras | Matacabras |
| Sri Lanka, during SW - Monsoon | Kachchan |
| Sumatra, during SW- Monsoon | Bohorok |
| USA, California | Santa Ana |
Appearance in the basic channels:
|
|
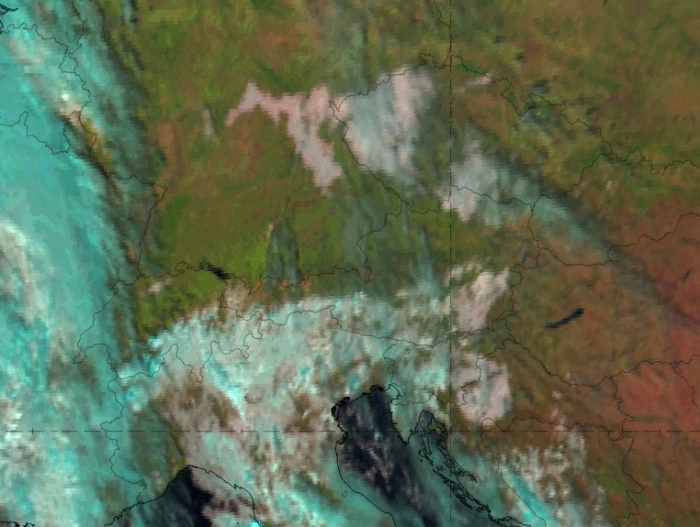
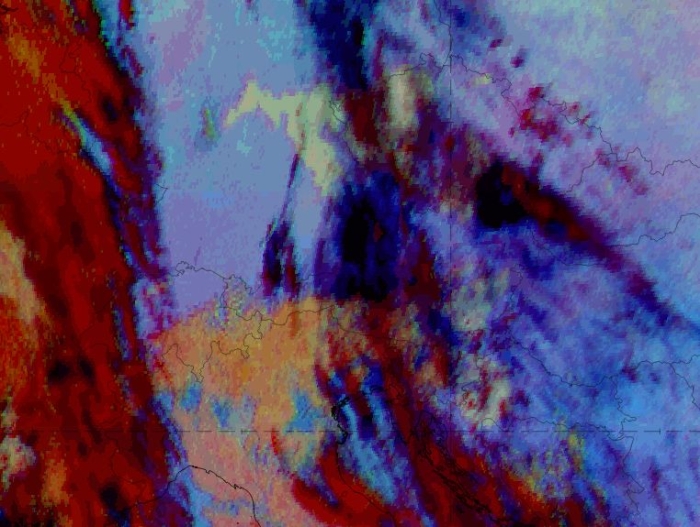
Day Natural Colour RGB and 24-hour Microphysics RGB on 07 November 2018, 12 UTC. Air stream from the south.
To observe all important cloud features during a typical foehn case, it is crucial to find RGB images that cover low to mid-level clouds and high cirrus clouds, and that distinguish between clouds and cloud-free land. For example, the Day Natural Colour RGB is easy to interpret and provides a good first glance as to where low water clouds (bright, whitish) and thick ice clouds (cyan, turquoise) are present. It also distinguishes different surface features where no clouds are present. In the case shown, it depicts the low to mid-level water clouds south of the main Alpine ridge very well, but high cirrus clouds are hard to identify and usage is only possible during daytime.
The 24-hour Microphysics RGB, however, is able to distinguish between many cloud types during the day and night. It can show not only low to mid-level cloudiness (yellow to orange, sometimes even reddish when larger droplets are included) on the windward side of the mountain, but also high cirrus clouds (dark blue to black) on the lee side. Usually there is a sharp border between the clouds on the windward side and the cloud-free zone on the lee side; sometimes clouds on the two sides are separated by a gap. This cloud free area can also be seen quite well with the 24-h Microphysics RGB.
Note: As an alternative to the 24-hour Microphysics RGB, the Dust RGB shows a very similar picture, as both are based on the same channels (with different temperature ranges and gamma corrections).
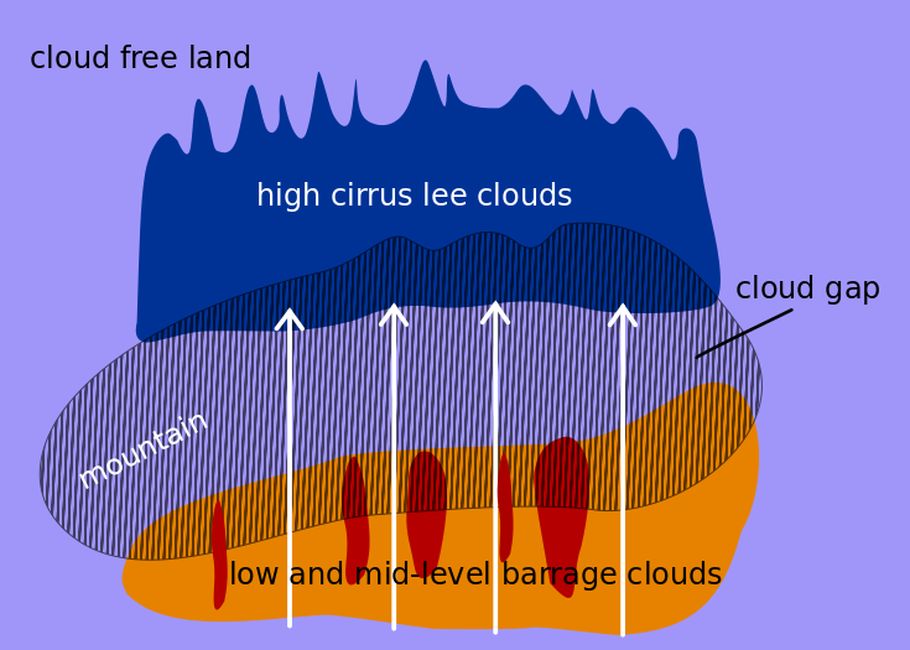
Schematic 24h Mirophys. RGB
Meteorological Physical Background
The basic meteorological processes behind this Conceptual Model are related to orographically forced rising and sinking, and associated dry and wet adiabatic cooling and warming.
The basic condition leading to a Foehn process is a flow perpendicular to a mountain range. Regardless of the orientation of the mountain chain (W-E or N-S) an intensive low to the W, NW of this mountain chain is the basic synoptic-scale pre-condition for such a perpendicular stream. Reaching the mountain chains the air is forced to rise. Initially the cooling of the air mass is dry-adiabatic (1°C/100 m) until saturation is reached. Condensation begins and from then on the cooling is at the moist adiabatic lapse rate which is 0.65°C/100 m. At the height of the mountain tops the air mass will have lost much of its humidity content and can now be regarded as relatively dry. The sinking on the other side of the mountains and associated warming therefore takes place with the dry-adiabatic lapse rate. Consequently the air warms up during descent at a rate higher than the cooling during ascent and reaches the plains as a very dry, very warm and very strong wind - the Foehn.
|
|
|
|
|
The principals of this process are true for every mountain barrier but there are some conditions which must combine for more notable Foehn effects. The air initially must have the possibility to gain enough humidity and the mountain chain must be high enough so that the whole water content can be condensed while rising.
A mountain range for which these conditions are very well fulfilled are the Alps: if there is an intensive low in the W to NW of the Alps, a southerly stream reaches the Alpine mountain chain after it has overflow the Mediterranean Sea and therefore has the possibility to gain high values of humidity. Stau Cloud and rain develops to the south of the Alps; taking into account the height of mountains - up to about 3500 - 4000m - there is enough ascent to condense out the humidity content and to produce a very dry, warm Föhn-storm north of the Alps. This Foehn is called the S-Foehn (or Süd Foehn e.g. South Foehn) and usually reaches strengths of 100 km/h.
|
28 February 2000/12.00 UTC - Meteosat IR image
|
|
|
In November 1982, the Alps were affected by an exceptionally marked Foehn event that resulted in strong winds in Austria, Germany and Switzerland. The observed pressure gradient across the Alps reached a record of 20 hPa causing winds of up to 190 km/h across the Gottard Pass. While Locarno observed an air temperature of +1°C with mixed rain and snow, skies above Zürich were clear with a temperature of 25°C.
|
27 January 2008/00.00 UTC - Meteosat 9 IR10.8 image; magenta: height contours 1000 hPa, cyan: height contours 500 hPa
|
|
|
There is a similar effect for flow from the opposite direction - the "North Foehn" when an air mass crosses the Alps from N to S (like the example of 27 January 2008, above). But such an air mass is usually colder than the one coming from the S and as it is streaming over the continent it does not have so much possibility to gain humidity. Consequently the North Foehn which blows S of the Alps is by far not as dramatic as the S-Foehn.
Whether the Foehn-storm is noticed as far down as in the valleys on the lee side of the mountains also depends upon the structure of the local boundary layer. If there is a mixed boundary layer, the Foehn will penetrate down to the lowest levels. If there is a boundary layer with a strong inversion it will not be able to reach the ground. In the satellite images a small black (cloud free) area can be seen moving eastward; it can be regarded as sign of such a breakthrough of the Foehn.
|
27 January 2008/20.00 UTC - Meteosat 9 IR10.8 image; 20.00 - 06.00 UTC half-hourly image Loop
|
|
Key Parameters
- Height contours at 1000 and 500 hPa:
Well developed low to the W to NW (in the case of south Foehn) of the mountain range; closed low at all layers and with vertical axis; - Equivalent thickness:
The corresponding frontal cloud band is associated with a zone of high gradient of thickness; as the mesoscale features linked to the Foehn process appear in the leading part of the frontal cloud, the modifications often appear already in the thickness ridge; - Thermal front parameter (TFP):
The corresponding frontal cloud band is accompanied by a TFP; the location of the TFP, in relation to the frontal cloud band, is dependent upon the synoptic situation; as the mesoscale features linked to Foehn appear in the leading part of the frontal cloud the modifications appear either within or in front of the TFP - Wind direction at 850 - 500 hPa:
There is a strong stream over a thick layer perpendicular to the mountain chain; - Radio soundings: humidity + temperature:
Radio soundings on the windward side show a thick wet layer reaching nearly up to the tops of the mountains; to the lee side of the mountain chain they show a dry layer from the surface up to middle levels and a wet layer in middle to high layers; the latter represents the high Lee Cloud.
South Foehn
Height contours at 1000 and 500 hPa
|
|
06 November 2000/12.00 UTC - Meteosat IR image; magenta: height contours 1000 hPa, cyan: height contours 500 hPa
|
|
|
Equivalent thickness and Thermal Front Parameter (TFP)
|
|
06 November 2000/12.00 UTC - Meteosat IR image; green: equivalent thickness, blue: thermal front parameter
|
|
|
Wind direction at 850 - 500 hPa
|
|
06 November 2000/12.00 UTC - Meteosat IR image; green: wind direction 850 hPa, red: wind direction 500 hPa, yellow: wind direction
300 hPa
|
|
|
North Foehn
Height contours at 1000 and 500 hPa
|
|
27 January 2008/00.00 UTC - Meteosat 9 IR10.8 image; magenta: height contours 1000 hPa, cyan: height contours 500 hPa
|
|
|
Equivalent thickness and Thermal Front Parameter (TFP)
|
|
27 January 2008/00.00 UTC - Meteosat 9 IR10.8 image; green: equivalent thickness, blue: thermal front parameter
|

|
|
Wind direction at 850 - 500 hPa
|
|
27 January 2008/00.00 UTC - Meteosat 9 IR10.8 image; green: wind direction 850 hPa, red: wind direction 500 hPa, yellow: wind
direction 300 hPa
|
|
|
Radio Soundings: humidity + temperature
|
|
|
|
|
|
|
|
North side of Alps (Barrage side): 27 January 2008/00.00 UTC - Radio sounding Vienna; black solid: temperature and dewpoint
temperature
|
South side of Alps (Lee side): 27 January 2008/00.00 UTC - Radio sounding Zagreb; black solid: temperature and dewpoint temperature
|
Typical Appearance In Vertical Cross Sections
The typical appearance in vertical cross sections is somewhat false, because of the fact that the effect of mountains is not treated realistically within cross sections, neither from radio soundings nor from numerical models. Radio Sonde stations have too big a spatial resolution while numerical models usually do not contain the fine structure and real height of mountainous areas. Nevertheless some interesting features can be derived.
- Equivalent potential temperature:
Moist adiabatic isentropes show a zone of high gradients on the windward side crossing the mountains and a different air mass below this zone on the lee side; this can be seen much better in vertical cross sections from radio sounding stations. - Relative humidity:
Reflects the differing cloud situation on both sides of the mountains: a maximum of relative humidity is located on the windward side from the surface up to the mountain tops; a secondary zone of high humidity can be found at high levels on the lee side representing the high Lee Cloud; below this zone it is much drier or even very dry. - Convergence:
There is convergence on the windward side from the surface up to middle levels and convergence on the lee side from middle to high levels; divergence occurs above the mountains as well as in the low layer on the lee side. - Vertical motion:
Upward motion is associated with the convergence areas and, therefore, strong upward motion in a thick layer can be found on the windward side and also on the lee side but at middle to high levels. The lowest layers on the lee side show sinking.
The example below, used to demonstrate general Foehn dynamics, is from the Alpine region. Therefore the following relation between vertical cross section, frontal cloud and mountains exists.
|
|
27 January 2008/00.00 UTC - Meteosat 9 IR10.8 image
|
|
|
Equivalent potential temperature: vertical cross sections from radiosonde stations compared with the output from numerical models
|
|
27 January 2008/00.00 UTC - Vertical cross section; black: isentropes (ThetaE)
|
|
|
Relative humidity: vertical cross section from radio sounding stations
|
|
27 January 2008/00.00 UTC - Vertical cross section; blue: relative humidity, black: isentropes (ThetaE)
|
|
|
Convergence: vertical cross sections from numerical model
|
|
27 January 2008/00.00 UTC - Vertical cross section; magenta: divergence, black: isentropes (ThetaE)
|
|
|
Vertical motion: vertical cross sections from numerical model
|
|
27 January 2008/00.00 UTC - Vertical cross section; cyan: vertical motion, black: isentropes (ThetaE)
|
|
|
Weather Events
This CM represents a meso-scale modification of the CM "Cold Front" or "Occlusion" during its passage over a mountain range. The most striking facts are the completely opposite weather events on the windward and on the lee side.
| Parameter | Description |
| Precipitation |
Windward side:
|
| Temperature |
Windward side:
|
| Wind |
Windward side:
|
| Cloud |
Windward side:
|
| Other relevant information |
|
|
27 January 2008/00.00 UTC - Meteosat 9 IR10.8 image; weather events (green: rain and showers, blue: drizzle, cyan: snow, red:
thunderstorm, yellow: fog, black: no precipitation)
|
|
|
The Precipitating Clouds product (example from 07 November 2018, 12 UTC) can be used to indicate the potential for rain on the windward side of the mountain. Depending on different factors, this signal can be weaker or very strong. Intensifying factors include a very humid airmass, ascent from a low level with a low lifting condensation level and a high mountain barrier. Note: Not every foehn event is necessarily connected to precipitation on the windward side!
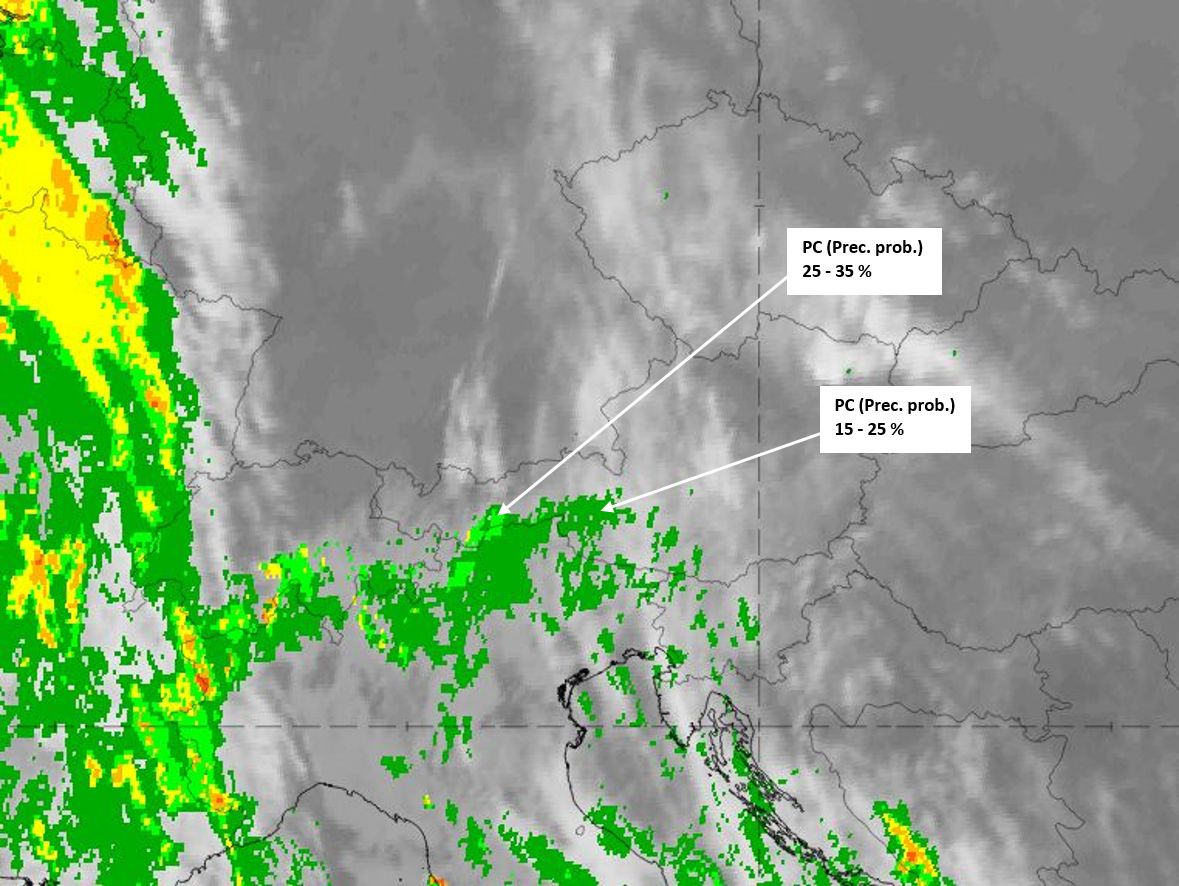
Precipitating Clouds product from 07 November 2018, 12 UTC. Air stream from the south.
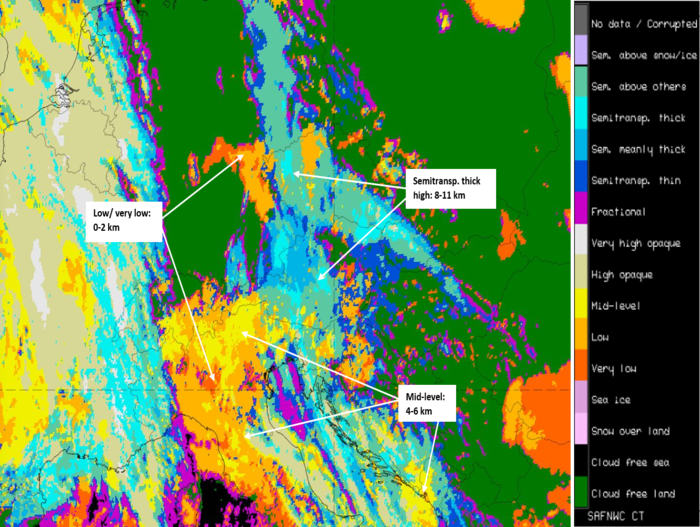
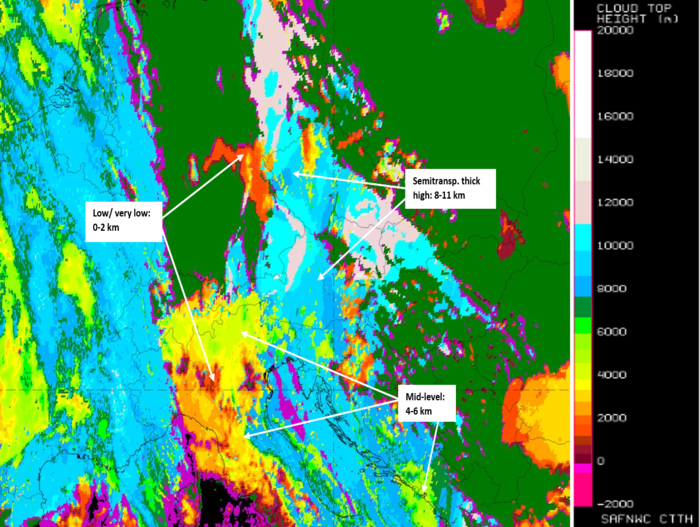
The Cloud Type product reveals the division between low clouds on the windward side of the barrier (yellow to orange or red) and high (partly semitransparent) clouds on the lee side (blue shades). In some cases, there is a gap between the two cloud fields, due to the downward motion of the air (cloud-free area: green colour). More precise altitude information can be extracted from the Cloud Top Height product. The example shown is from 07 November 2018, 12 UTC.
|
|
Cloud Type product (left) and Cloud Top Height product (right) from 07 November 2018, 12 UTC.
Not every case of (southerly) foehn wind causes precipitation on the windward side of the mountain barrier. The example below (from 08 November 2019, 09 UTC), however, shows not only the fragile wavy structure downstream (HRVIS image) but also a more intense backscatter signal from rain south of the Alps (windward side).
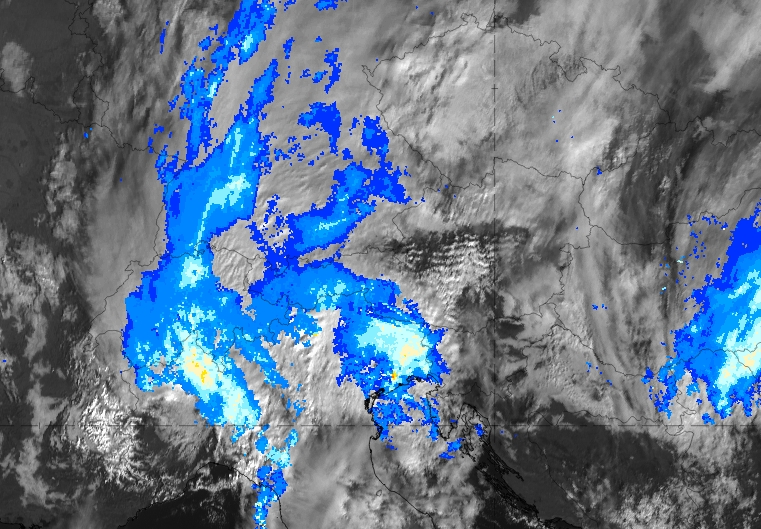
Opera Radar Image and MSG HRVIS (background) from 08 November 2019, 09 UTC.
References
- FORSTNER, B. (2001): Untersuchung von Gebirgswellen durch Auswertung von Segelflug und Radiosonden Daten, Dipl. Arb. IMGW
- HARSTVEIT, K., ANDRESES, L. and MIDTBO, K. H. (1995): Downslope windstorms at Oppdal, Norway. Local description and numerical simulations. DNMI Report No. 23/95.
- HOINKA, K. P. (1985): Der Föhn am Alpennordrand, VCH, Geowissensch. 5, 152pp
- KUHR, M. (ed.) (1989): Föhnstudien, Wiss. Buchges. Darmstadt
- SEIBERT, P. (1990): South Foehn Studies since ALPEX Experiment, Meteorol. Atmos. Phys. 43, 91pp