Table of Contents
Cloud Structure In Satellite Images
|
|
|
|
|

|
|
|
10 November 2007/12.00 UTC - Meteosat 8 HRVIS image
|
10 November 2007/09.00 UTC - Meteosat 8 HRVIS image; 09.00-14.00 UTC quarter - hourly image loop
|
|
10 November 2007/12.00 UTC - Meteosat 8 IR 10.8 image
|
10 November 2007/09.00 UTC - Meteosat 8 IR 10.8 image; 09.00-15.00 UTC quarter - hourly image loop
|

|
Convective clouds are often observed in bands and lines over sea, lakes, bays and straits when cold, dry air is transported over warmer seawater, picking up moisture. In the VIS image the lines can be seen as white stripes with several, individual convective cells : large, small and well separated. IR image show less pronounced anvils, not recognisable as such on IR images. Brightness changes in white represent temperature changes at cloud top height: the whiter the higher the tops and the lower the temperature.
|
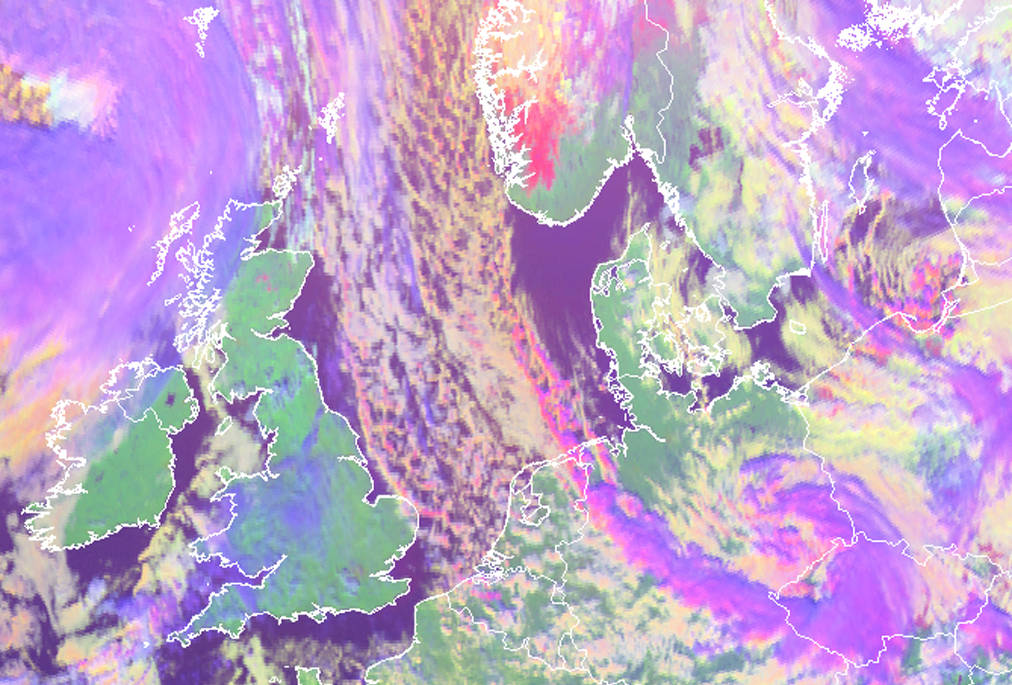
10 November 2007/12.00 UTC - Meteosat 8 WV 7.3 image
|
|
|
In the above image, the Meteosat 8 WV 7.3 image from the 10th of November 2007/12.00 UTC, the anvils of the individual CB - cells in the convergence line are depicted in white but not as clear, compared to the HRV and IR images. Grey areas over the western part of Sweden and the Skagerrak are an indication of moister air at lower levels in the atmosphere, favourite for the developing showers in the convergence line. Notice the darker areas over the west part of Denmark and the south part of Norway : illustrative for the dry atmospheric air as a result of the north westerly flow over Norway. Near the northern coastline of Germany the darker areas are becoming less pronounced, changing into the grey color of moister air in which again a cloud street has developed.
|
12 November 2007/12.00 UTC- Meteosat 8 HRV image
|
12 November 2007/12.00 UTC- Meteosat 8 IR 10.8 image
|
|
|

|
|
|
12 November 2007/12.00 UTC - Meteosat 8 Airmass RGB image
|
12 November 2007/12.00 UTC - Meteosat 8 Day-Microphysics RGB image
|
The above images, all of 12 November 2007 12.00 UTC, are illustrating the use of different MSG - RGB combinations. Starting with the HRV image in the top left the convergence line over the east part of the North Sea, extending from the west coast of Norway down to the German Bight, is well depicted: strong reflection of the white, individual anvils. To the right the corresponding IR image with colder, whiter and higher tops.
The Airmass RGB, down to the left, is an interesting image. The higher tops of the convergence line are depicted in white and lowering from the German Bight towards the north. In fact the blue color, extending from the UK to Denmark and Sweden, is an indication all developments take place in cold, polar air. The redish color, overhead the blue color (from Norway down to the German Bight and Luxemburg, is reflecting the dry stratospheric air above the strong northwesterly jetstream. Overall, individual cells are hardly recognizable, the image is not very helpful for the detection of the properties of the several cloud streets.
The last image of this example, the Day - Microfysics RGB to the right, has more specific information. Ice clouds have a purple colour : apparently the small and whiter clouds (from the HRV - image) appear to have icy tops.
The Comma Cloud over the Czech Republic is interestung: A nice example of Cold Air Development. On the satellite image the convergence line here is in the tail of the Comma cloud and therefore open to debate if this is really the Conceptual Model described in this chapter. Features in RGB however are very much comparable. For more information on Comma and its tail, see the Conceptual Model Comma - Cloud structure in Satellite Images.
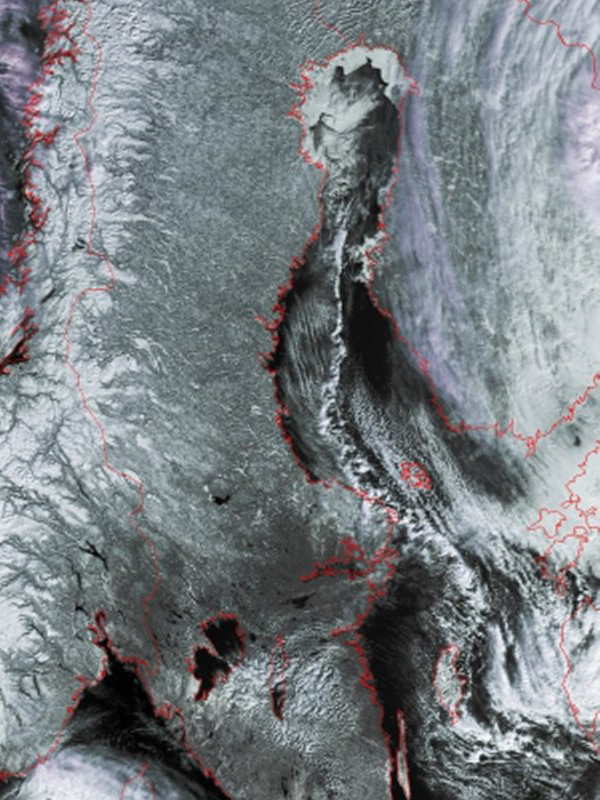
As a final example, on the 23rd of March 2008, arctic air was advected from the northern part of Sweden over unfrozen parts of the Gulf of Botnia down to the south and southeast. Cloud Streets developed at a certain distance off shore into a well pronounced convergence line with the deepening of the unstable, convective layer. In this case the advantage of a HRV-image from the NOAA Polar Satellite to the right is clear: much more detail in the structure of individual clouds and the cloud street compared to the Meteosat 8 HRVIS image to the left. From above the convergence is like a meeting-point of the Swedish and the Finnish arctic air.
|
23 March 2008/12.00 UTC - Meteosat 8 HRVIS image
|
23 March 2008/12.00 UTC - NOAA AVHRR HRVIS image
|
|
|
Meteorological Physical Background
Convective bands are caused by low-level lines of convergence, which has been demonstrated by simulations using numerical models (Nagata et.
al. 1986). They often develop in cold air outbreaks in which the coastal shape and sea-surface temperature pattern have a profound effect in
establishing a low-level mesoscale circulation. Due to the large temperature difference between land and sea, offshore winds are generated.
Convergence occurs when offshore winds, from opposite coasts meet each other.
The cold air stream becomes unstable due to turbulent transport of sensible and latent heat from the warm sea surface. Convergence Lines form
downwind of major bends in the coastline. A bay with offshore winds is thus an ideal generation area. A good example is the development of
lines over the Gulf of Bothnia as shown in chapter 1 "Cloud structure in satellite images", date March 23 2008 12.00 UTC. In general
the lines are advected with the base flow and can bring large amounts of precipitation to adjacent areas.
|
Mesoscale structure of atmospheric structure around convergent cloud lines
|
|
|
Above a schematic picture of the Mesoscale structure of the atmosphere around convergent cloud lines in bays. The wind direction is parallel to the cloud lines.
The warm sea water heats the continental air from below. Focussing on the data of 10 November 2007 (see Cloud Structure in Satellite Images) and using the OSI-SAF composite image (see Key parameters) the temperature of the seawater in the Kattegat can be derived : around +10°C.
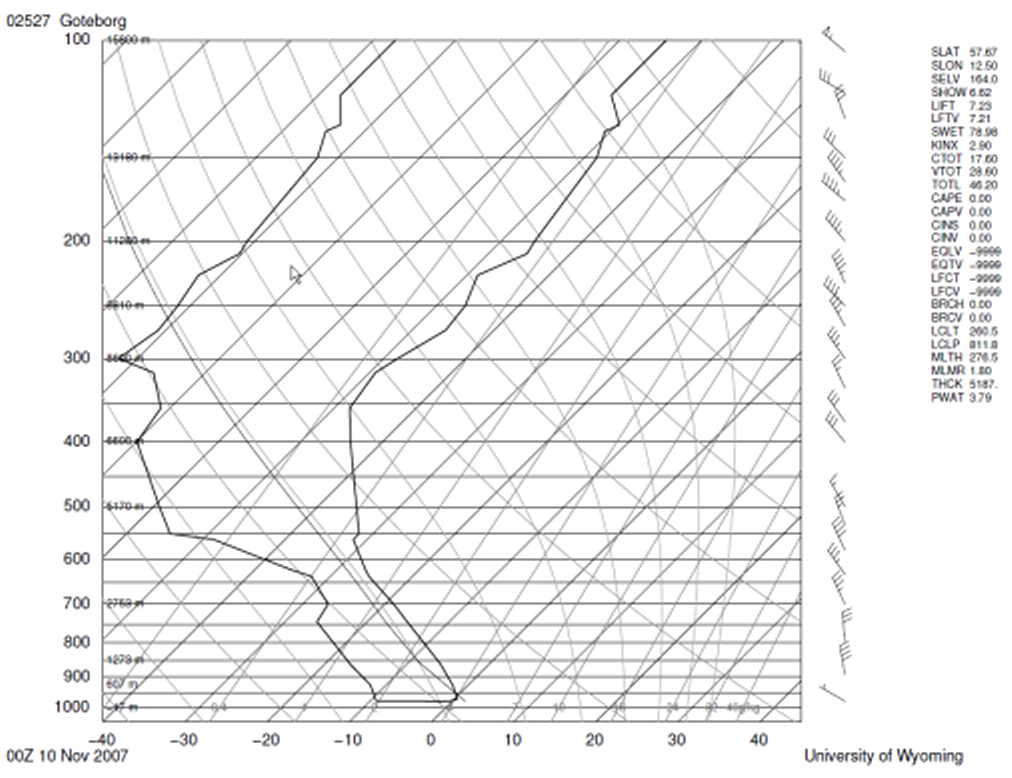
The initial temperature profile is shown by the skewT logP diagram of Göteborg , the image below.
A strong inversion at the surface ( T and Td equal to - 10°C ) exists over land as a result of night time cooling. This initial
continental air is heated when advected over the warm sea with temperature around +10°C. With a convection temperature of +5 or higher
convective clouds may develop over sea if enough moisture is available. Tops are expected to be near 550 hPa or 15.000ft at the height of an
upper level inversion with much drier air above. Continuation of this topographical effect will result in organised convective cloud bands.
|
10 November 2007/00.00 UTC - SkewT logP diagram of Göteborg
|
|
|
After a certain distance (fetch, Key parameters) a convergence line is generated over the Kattegat and the individual cells are advected down to the southeast with the upper wind in the lower levels. As an example the HIRLAM forecast (+12) for 12.00 UTC at 850 hPa is depicted in the image below left, together with the calculated vertical velocity in hPa/hr, red lines upward motion.
|
10 November 2007/12.00 UTC - HiRLAM; red: vertical motion (Omega) at 850 hPa
|
10 November 2007/12.00 UTC - Meteosat 8 HRVIS image
|
|

|
Comparing the Meteosat 8 HRVIS image, to the right, with the 850 hPa forecast to the left, the convergence line does fit with calculated upward motion through the Sont down to the west part of the Baltic Sea. Some upward motion however is forecast over Skagerrak and northern part of Denmark. The satellite image is showing no convective clouds at all. Obviously fetch and lack of enough moisture, remember the WV - image in the chapter on cloud structure, prevent the development of convective cloud.
Key Parameters
The location and strength of Convergence cloud Lines is strongly influenced by a number of parameters:
Direction and Magnitude of the low-level wind
|
10 November 2007/06.00 UTC - HiRLAM wind forecast at 10m
|
10 November 2007/06.00 UTC - synoptic analyses wind and temperature at the surface
|
|
|
For development of cloud lines in the Gulf of Finland, surface winds are generally above 10 m/s (Andersson and Nilsson 1990).
When the wind direction is parallel to the axis of a bay or narrow strait, or with little wind, cloud lines will develop in the centre of the
lake or bay. If the wind direction is at an angle to the axis of the bay, the line will be shifted towards that coastline at which the wind
direction is orientated towards (see Meteorological Physical Background).
In the above image to the left the wind field, forecast over Kattegat and Sont by the HIRLAM model, has a minor angle to the coastline, not
very illustrative. Near coastal regions a small change in wind speed and direction can be noticed. In the image to the right, the coresponding
synoptic analyses, the changing wind is much better depicted. Notice the strong differences in windspeed and direction over the island of
Sealand and the main land of Sweden.: weaker and more backed compared to the actual reported wind at the entrance and the exit of the Sont.
Fetch
Initially the air over the continent is stable and dry. While travelling downstream over much warmer surface the air is heated and stability
changes into instability. If enough moisture is picked up convective clouds start to develop. The distance between the first developed clouds
of the cloud street or convergence lines and the coastal region, where the air came from, is dependent on windspeed, instability, surface
temperature and humidity and called "Fetch". The general scheme of fetch is displayed in the image below left by the red arrow.
Continental, arctic air is advected with a northwesterly wind (the HIRLAM analyses 850 hPa to the right) over Norway into Denmark and the
southwest part of Sweden.
In this case, after a distance or fetch of about 400 km, at the end of the red arrow the first CU and CB-clouds starts to develop over the
Kattegat , spreading towards the Sont, the narrow border between the two countries.
|
10 November/12.00 UTC - Meteosat 8 HRVIS image; Scheme of fetch, represent by the red arrow
|
10 November 2007/12.00 UTC - HIRLAM forecast 850 hPa; green: RH
|
|
|
The 850 hPa 12h forecasts (blue lines) include the forecasts of the RH in green lines. Near the entrance of the Sont the RH at 850 hPa is forecast to exceed well above 70% suggesting development of convective clouds. Comparing this image to the satellite image the model is giving a quit excellent first guess for the start of convection and the convergence line.
Temperature Difference between water surface and the air
As a result of temperature difference between land and water an atmospheric circulation will develop. Fluxes of sensible and latent heat from the warmer water lead to a boundary layer that is very unstable: shallow, moist convection is about to start. Studies over the Gulf of Finland show occasions with temperature difference between land and water of at least 8°C.
During the night and early morning of the 10th of November 2007 temperatures dropped to values, fluctuating from 0 degrees at the west coast of
Sweden to -2 or -4 degrees more inland. Dewpoints were lowering down to -3 or -6 degrees C. At the same time screen temperature over the
Kattegat remained around +4 or +5 degrees C.
In the synoptic analyses of 06.00 UTC, the first images of this chapter, these low temperatures are depicted well.
By midday, as can be seen in the synoptic analyses of 12.00 UTC below, air temperature over land rose to 4 or 6 degrees C.
|
10 November 2007/12.00 UTC - Red: synoptic analyses of wind and temperature at the surface
|
|
|
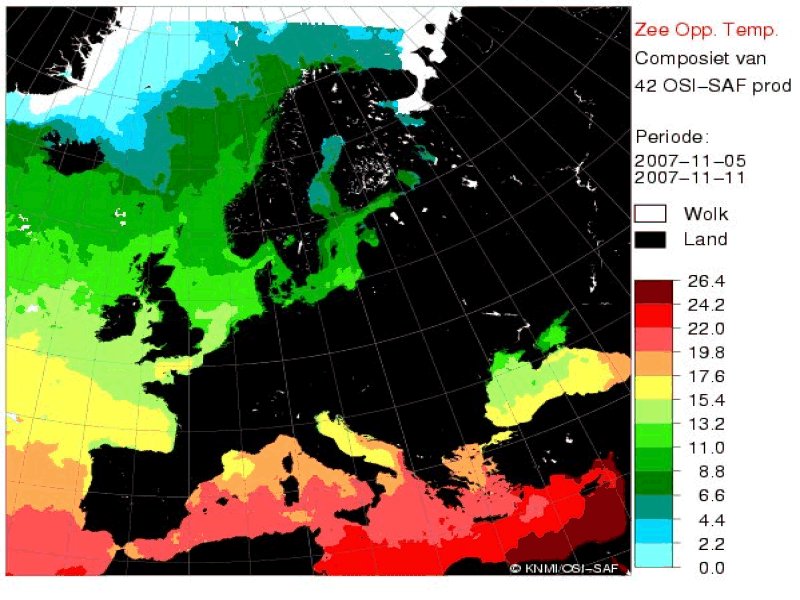
An important factor in establishing a mesoscale atmospheric circulation a large temperature difference between air and sea has to exists.
Sea surface temperatures become more and more available by using satellite observations.
From the composite OSI-SAF product, depicted below, it is easy to determine the temperature of the sea surface in the Kattegat, Sont and west
part of the Baltic Sea. Remember from the physical background a convection temperature around + 5 degrees C (diagram of Göteborg) was
necessary. A sea temperature in the Kattegat around +10 degrees C (dark green color) is of course high enough for convection to start.
|
05-11 November 2007 - Sea surface temperature Observed by OSI-SAF
|
|
|
Low level Convergence and vertical motion
The numerical model indicates low level convergence in the area of the cloud band. As a result of the low-level convergence vertical motions and divergence patterns are expected in the lower levels of the troposphere. The images below, with the calculated divergence pattern at 10m (left) and at 850 hPa (right), are displaying what can be expected: divergence above low level convergence implies ascending air. The result is in nice correlation to the cloud street and to the vertical velocity at 850 hPa, which we met earlier in the chapter Physical Background.
|
10 November 2007/12.00 UTC - HiRLAM forecast Divergence; at 10m (in blue) convergence (red) pattern
|
10 November 2007/12.00 UTC - HiRLAM forecast Divergence at 850 hPa (in blue), convergence (red) pattern
|
|
|
Typical Appearance In Vertical Cross Sections
A Convergence Line over sea, a lake or through a narrow strait is like a small - or mesoscale CM.In this chapter, a few examples of vertical
cross sections are presented.
In the Meteosat 8 HRVIS image below a convergence line or cloud street is recognized over the Kattegat, through the Sont, the narrow strait
between Denmark and Sweden towards the north west coast of Poland.
|
10 November 2007/06.00 UTC - Meteosat 8 IR 10.8 image; position of vertical cross section indicated
|
|
|
The first cross section is taken along the line of showers, and not across, as is indicated in the above image with the line AB. For reference see the red arrow in the second Meteosat 8 image of 10 November 2007 / 1200 UTC.
|
10 November 2007/06.00 UTC - Vertical Cross section; magenta: divergence
|
|
|
The divergence pattern at 06.00 UTC is depicting little low level convergence (drawn lines, negative value) at the entrance of the Sont (around 56N/12E) with little divergence above (dotted lines, positive value), at about 900 hPa. This is rapidly changing into low level divergence over the Sont with little convergence (at 850 hPa) above and probably along the Swedish southwest coast again minor convergence, coastal convergence with probably explains the line of showers is more over land.
The second cross section is taken from 54N 10E to 57N 16E, across the line of showers over the Sont, along the drawn red line AB in the Meteosat 8 IR 10.8 image of 0600 UTC above.
|
10 November 2007/06.00 UTC - Vertical cross section; blue: RH
|
|
|
This is a cross section on Relative Humidity. The moisture, at the start (over northern Germany, near Kiel) rather high at low levels up to 850 hPa, is diminishing soon when reaching and passing the east side of the Sont ( 55.5N/13E). Near the west coast of Sweden, which is at the right side of the image, the low level and high level moisture starts to increase on the approach of another weather system. The drier airmass in between the two weather systems is evident and well in accordance with the satellite image.
Cross section along a line through the Sont
In the Meteosat 8 HRVIS image below, 10 November 2007 12.00 UTC, a cross section is taken along the line of showers, parallel to the red arrow.
|
10 November 2007/12.00 UTC - Meteosat 8 HRVIS image; position of vertical cross section indicated
|
|

|
The cross section is a depiction of the divergence pattern at 12.00 UTC from Oslo (60N/10E) through the Sont to Szczecin in the northwest part
of Poland.
The most interesting part is at the entrance of the Sont, located around 56N/12.5E.
|
10 November 2007/12.00 UTC - Vertical Cross section; magenta: divergence
|
|
|
Over the Sont little divergence (dotted lines in purple, positive values) is forecast with low level convergence above, near 800 hPa, not favourable for convection to intensify. In fact the successive satellite images, presented in the chapter on the cloud structure, do indicate the weakening of the line of showers over the Sont. Down south to the coastline, over the west part of the Baltic sea, increasing number of showers illustrate the intensification as a result of coastal convergence (increasing). Part of this evolution may be induced as well by the increasing divergence at higher levels (500 hPa), above the low level convergence at 850 hPa, depicted well in the cross section.
Weather Events
| Parameter | Description |
| Precipitation |
|
| Temperature |
|
| Wind (incl. gusts) |
|
| Other relevant information | Thundery winter storms are not very common, the probability is increasing when upper air features and cold pools are strengthening the effect. |
|
|
|
|
In the synoptic weather chart of 14.00 UTC below some weather observations have an indication of the presence of the convergence line. Notice the distant showers, reported by a weather station in the exit of the Sont. The reported hail shower over the island of Rügen and the reports of hail and snow showers over the north east part of Poland are second indications Satellite images (see Meteorological Physical Background) and radar images are of great help for the determination of the extent and the intensity of the convergence line.
|
10 November 2007/14.00 UTC - Synoptic weather chart with surface wind, temperature and present weather only
|
|
|
In addition to the synoptic weather chart, with the help of the Danish Meteorological Institute (DMI), an image of the Danish weather radar was
received and is presented below. Darker colours indicate the more active parts and cells of the convergence line.
It is clear a single weather report on this weather map, like the isolated hailshower over the north west part of Poland, is part of an
extensive line of showers, stretching from the Sont down to the southeast. Satellite and radar images do add value to actual weather and
weather forecast.
|
10 November 2007/12.00 UTC - Image of weather radar supplied by DMI
|
|
|