Table of Contents
Cloud Structure In Satellite Images
Compared to the appearance in the Meteosat 7 images, in which they were seen as bright lines along the mountain chains, higher spatial resolution of Meteosat Second Generation images enables the distinction of very small convective cells within the Convergence Line.
Convergence lines can be seen in all 12 Meteosat 8 channels.
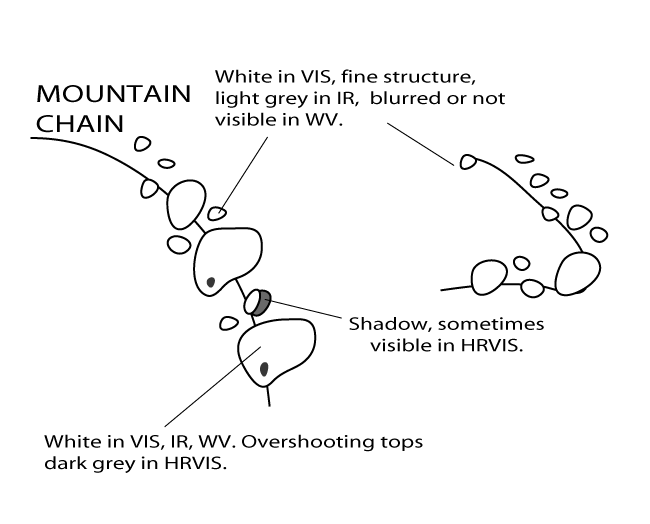
- The best channels to detect small scale convective Convergence Lines are the visible channels 0.6 and 0.8µm where the lines are bright, but the best of all is the High Resolution Visible (HRVIS) channel in which also the small cells within the Line are visible.
- In the IR images Convergence Lines can be either white or grey. Sometimes it is not possible to discriminate between high cloud fibres and convective cloudiness. Consequently, this can lead to an overestimating of convective cloudiness. However, well developed cells are easily recognisable also in the IR channels. Cloud tops of single cells within the line can reach temperatures of -50°C or even lower, whereas in other parts of the Convergence Line there can be much lower cells with cloud top temperatures of -10 to 0°C.
- In the WV channel 6.2, very small scale cells within the convective Convergence Lines cannot be detected easily. However, in parts with large convective cells can one see white spots in a dark or grey background. If the convective activity is very strong, these spots are very easily detectable. The situation is even clearer in WV 7.3 channel where the high level humidity is not present, so the cells differ much more from the background.
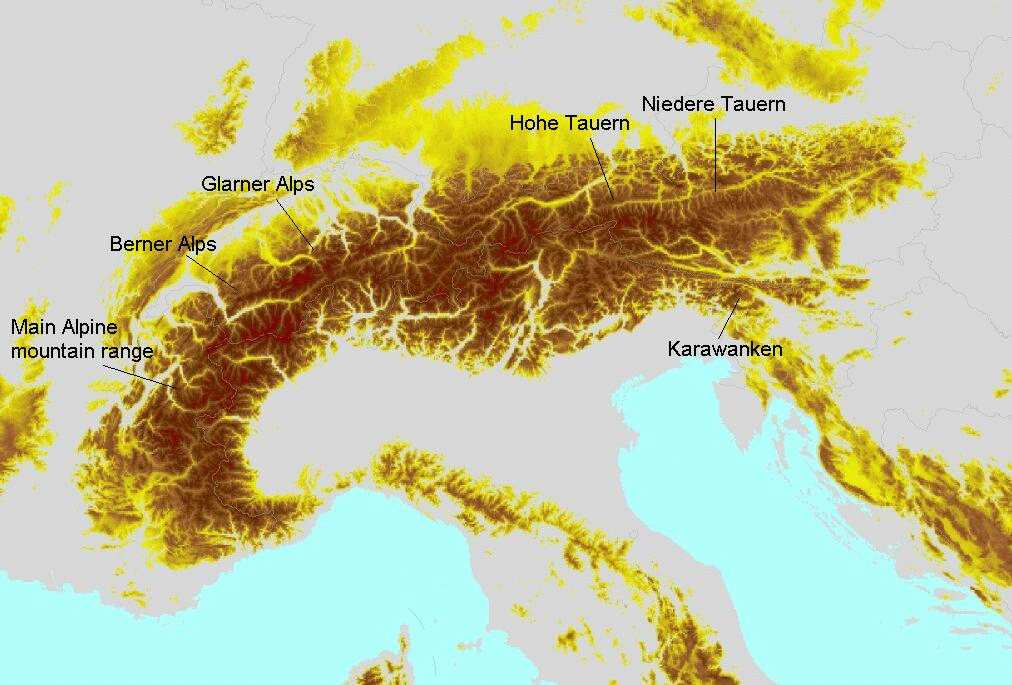
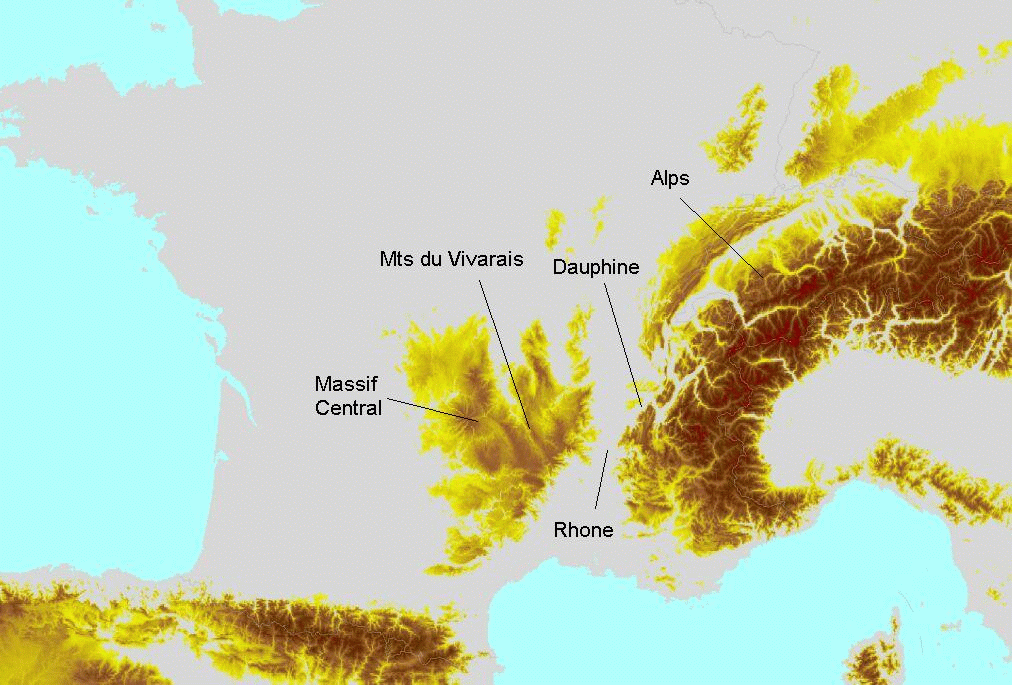
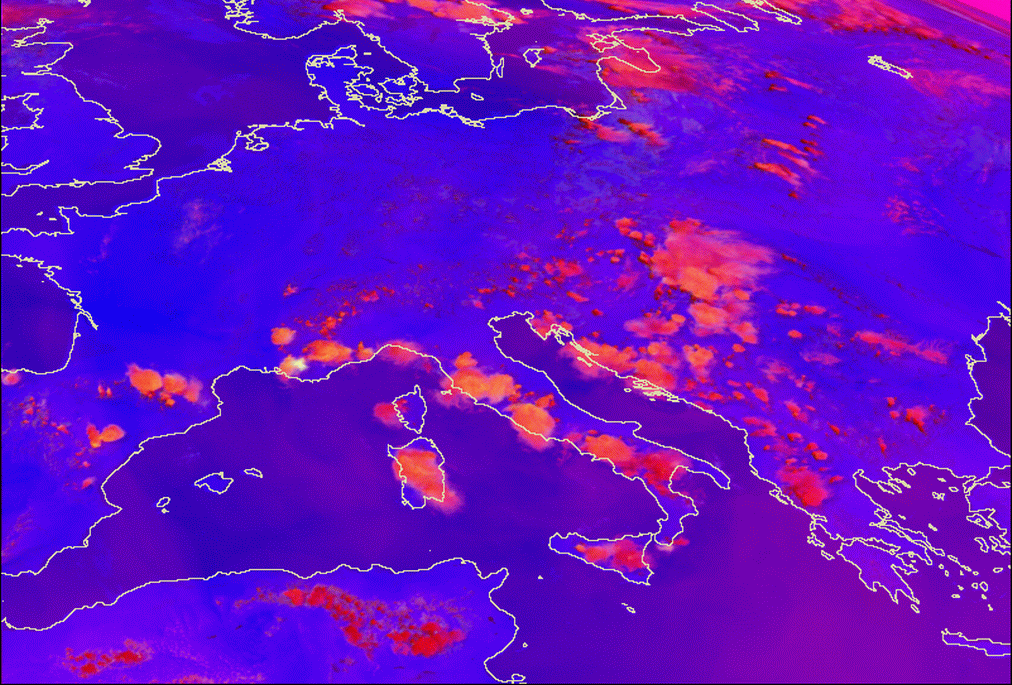
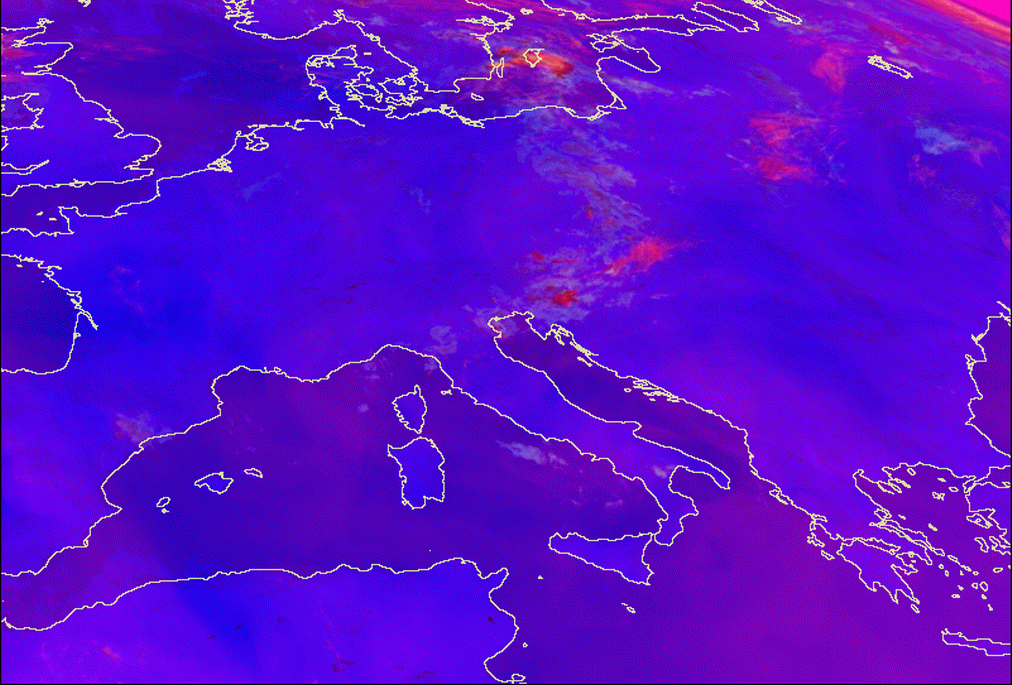
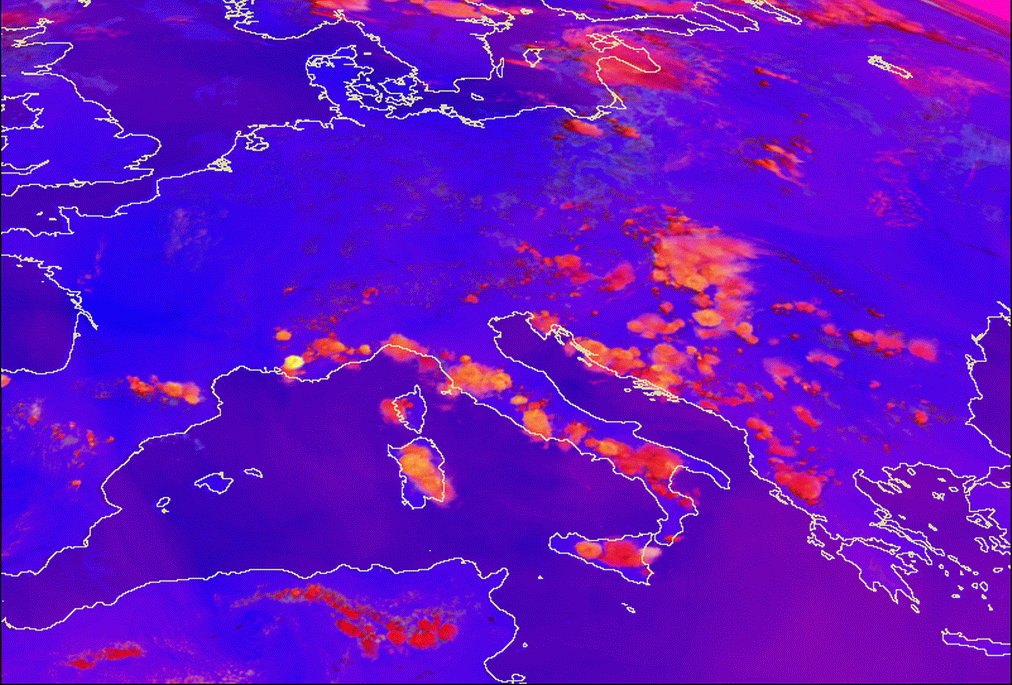
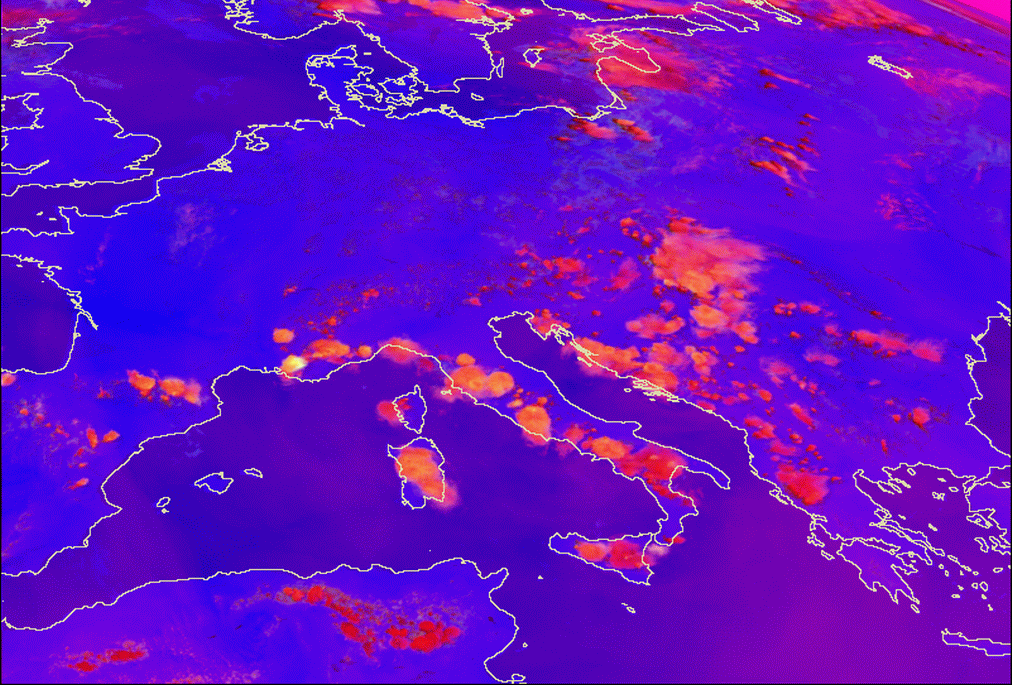
In Western and Central Europe, such lines can often be found over the Pyrenees, the Central Mountains in France, over the Alps, the Carpathian Mountains, in Italy over the Apennines, over the Dinaric Alps, the mountains on the Peloponnesian and the Pindos mountains with continuation to Macedonia.
Orographic Convergence Lines show a typical life cycle of several hours depending on the time of day. Development can be followed in all channels, however the appearance is most pronounced in the VIS channels, especially HRVIS.
|
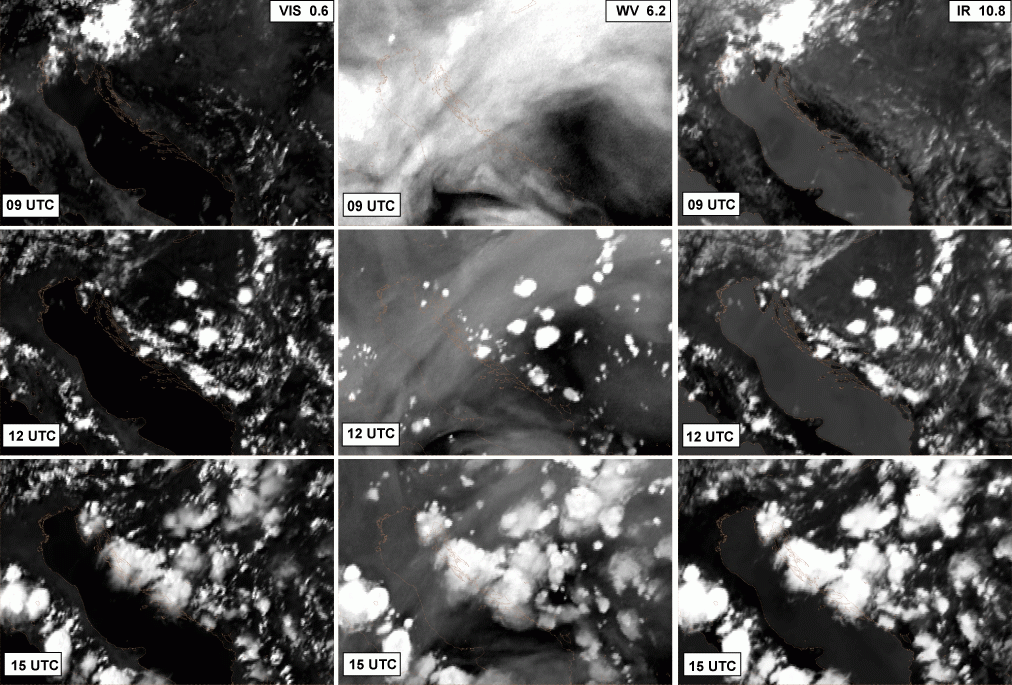
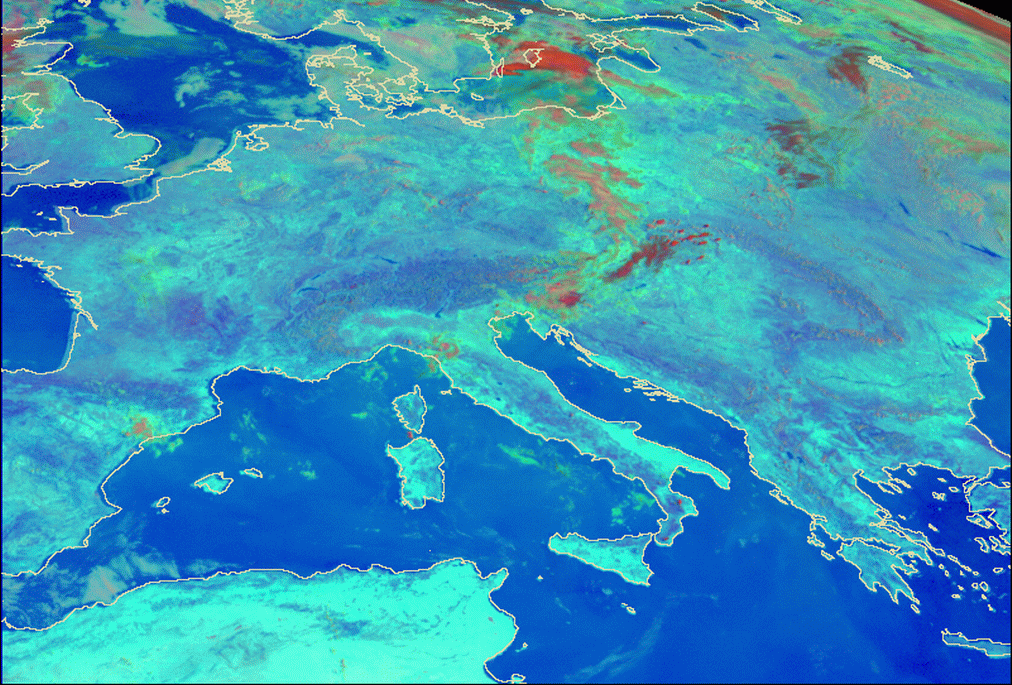
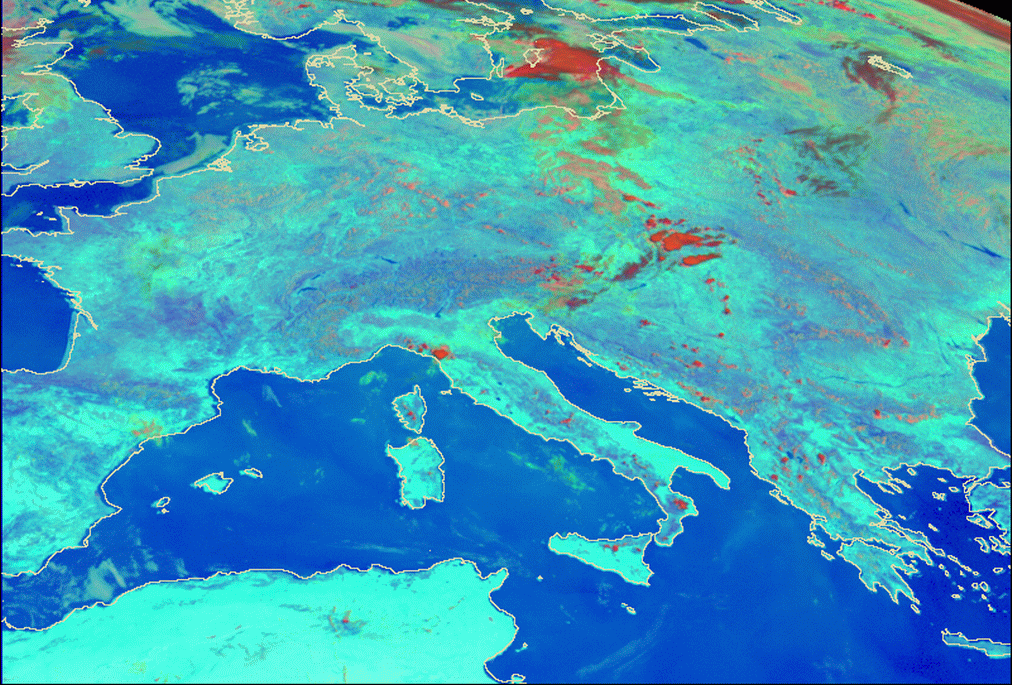
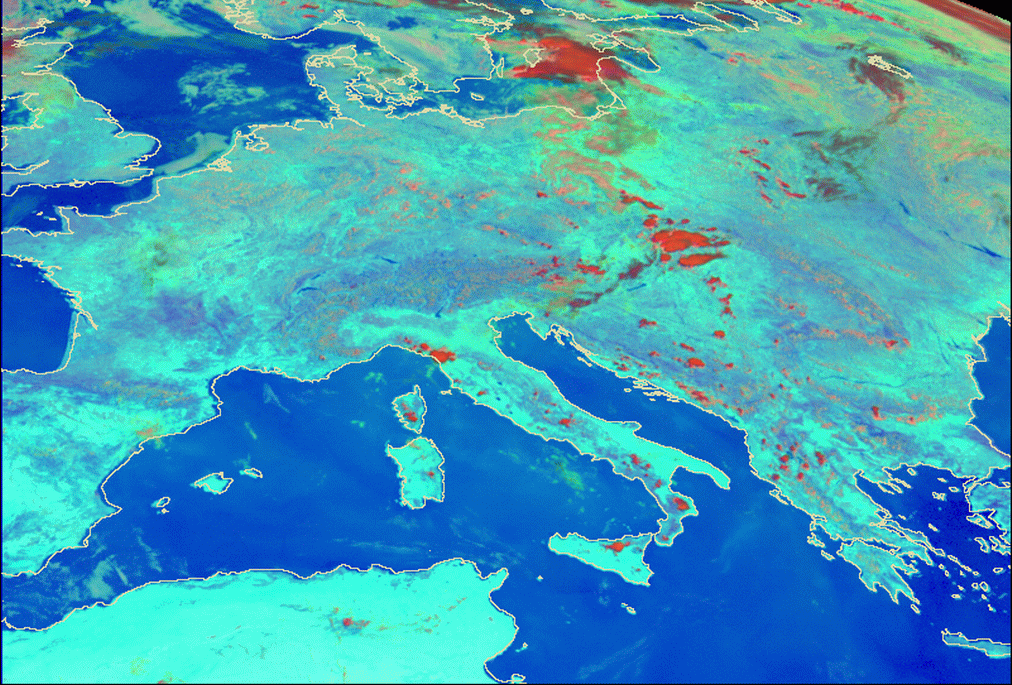
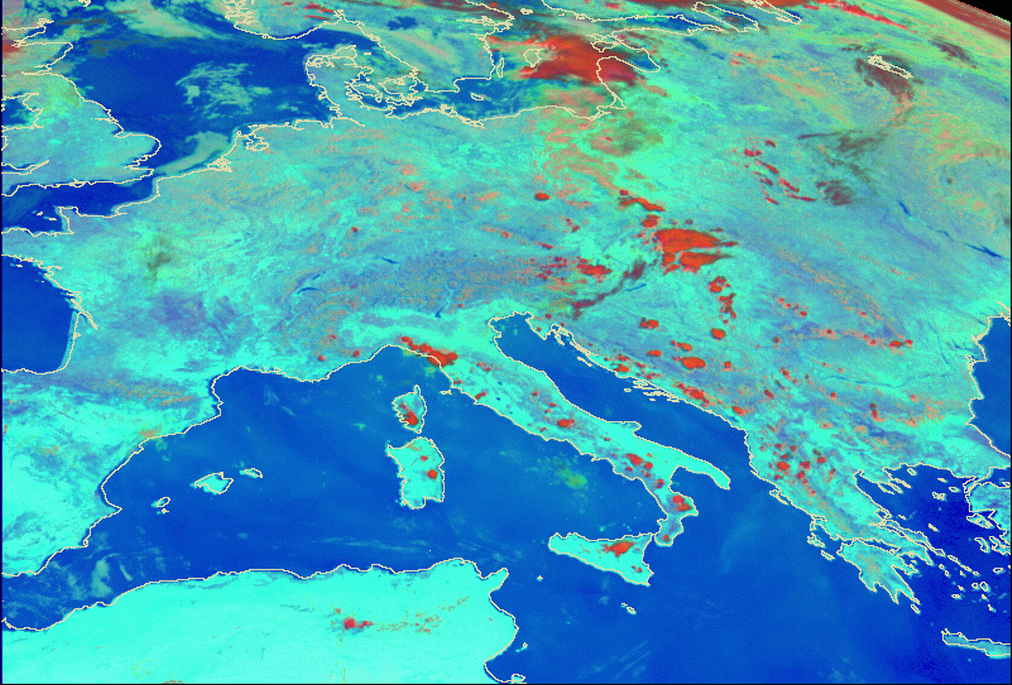
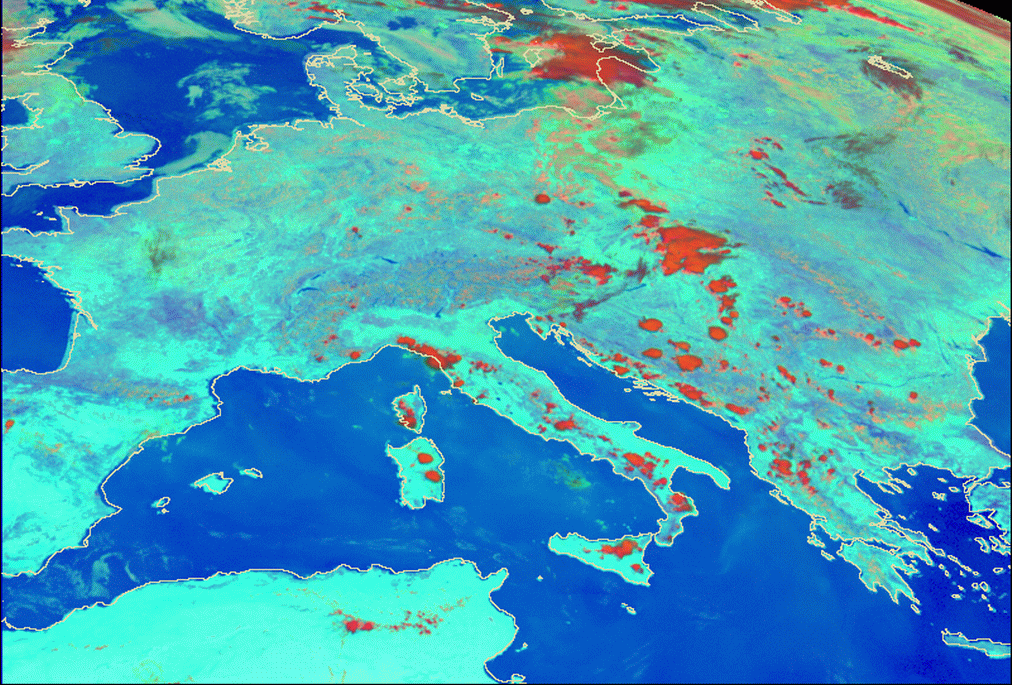
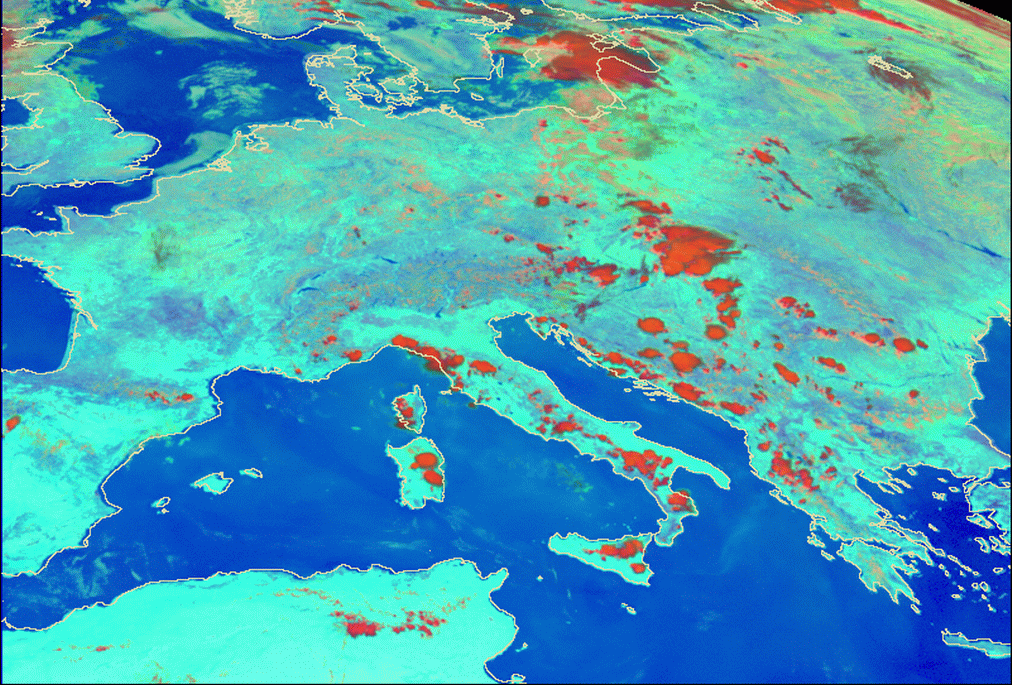
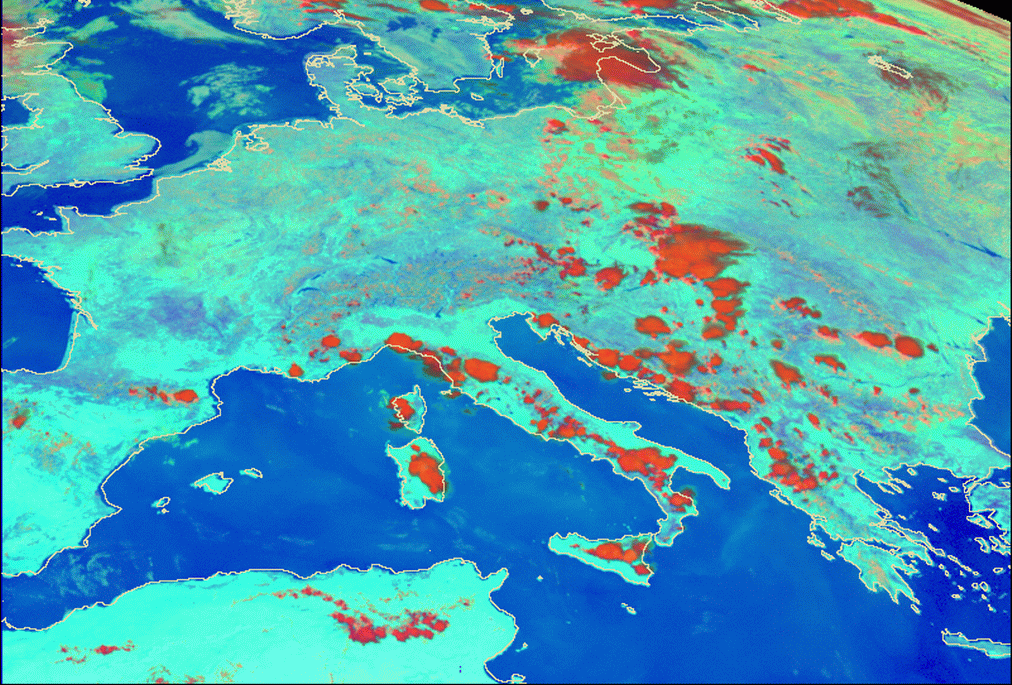
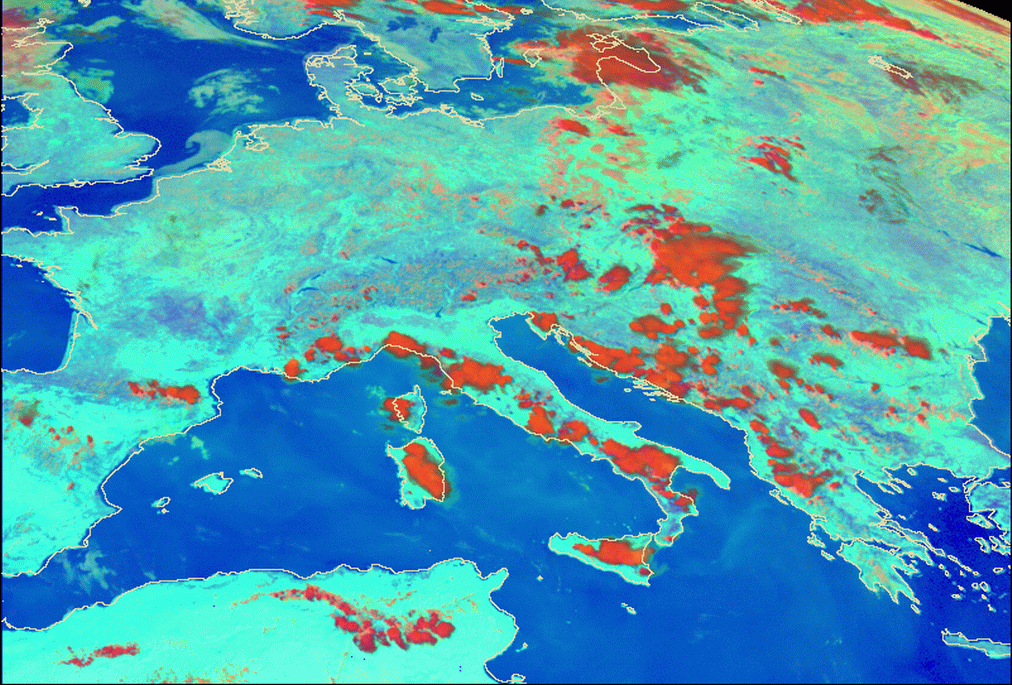
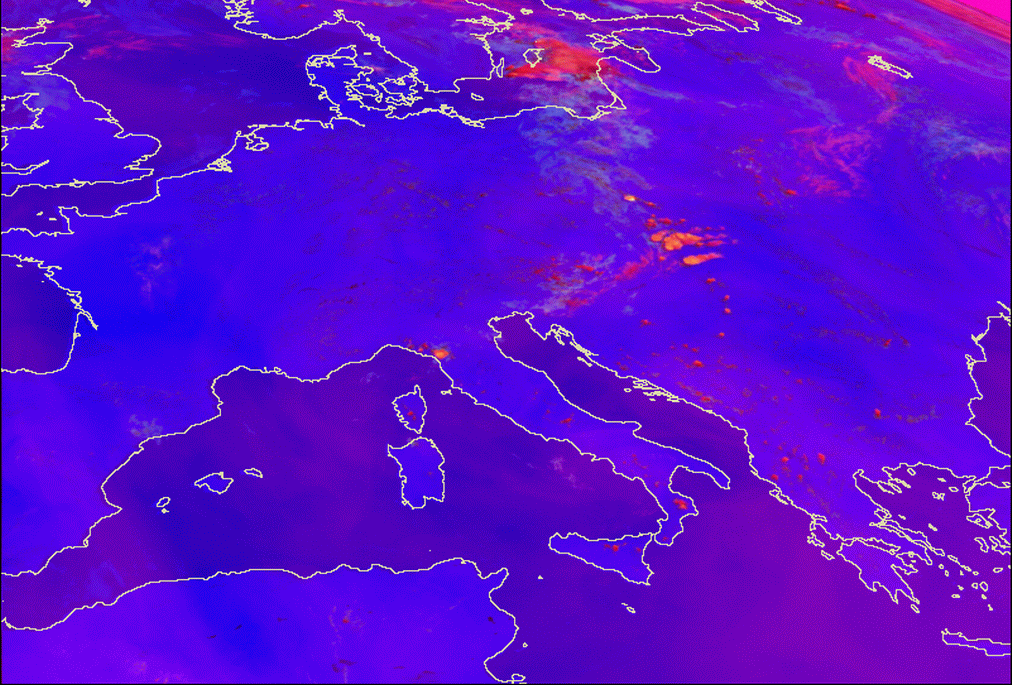
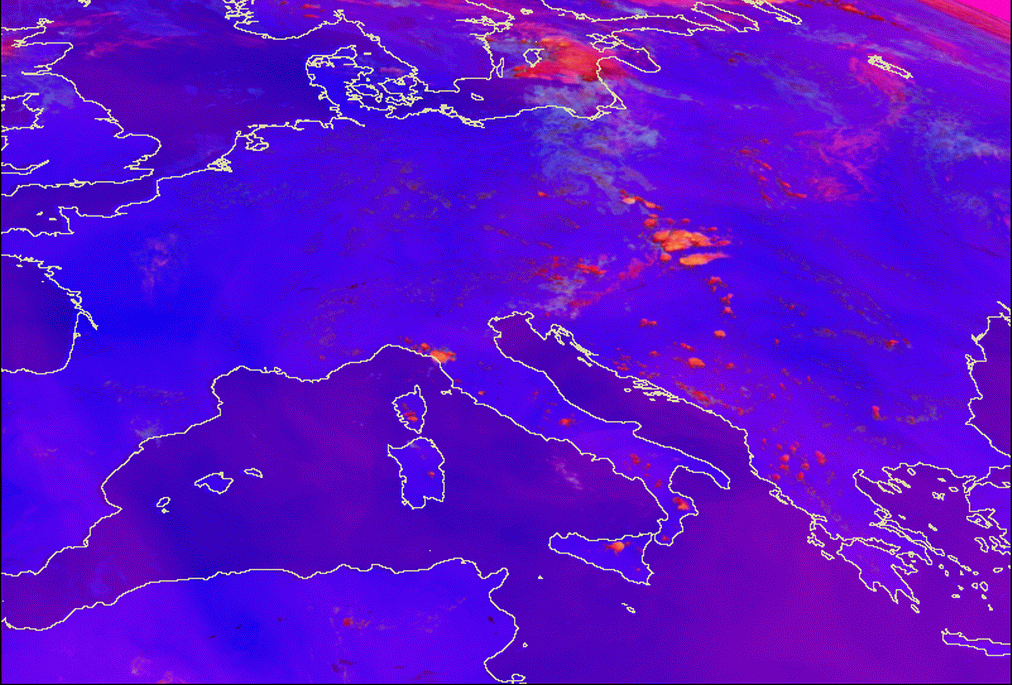
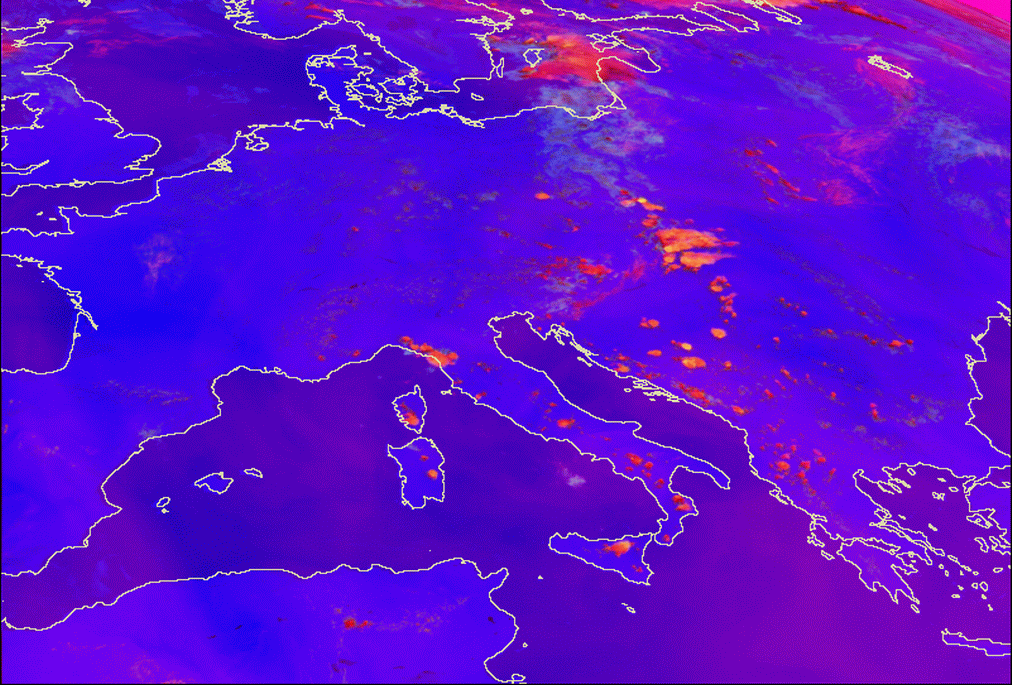
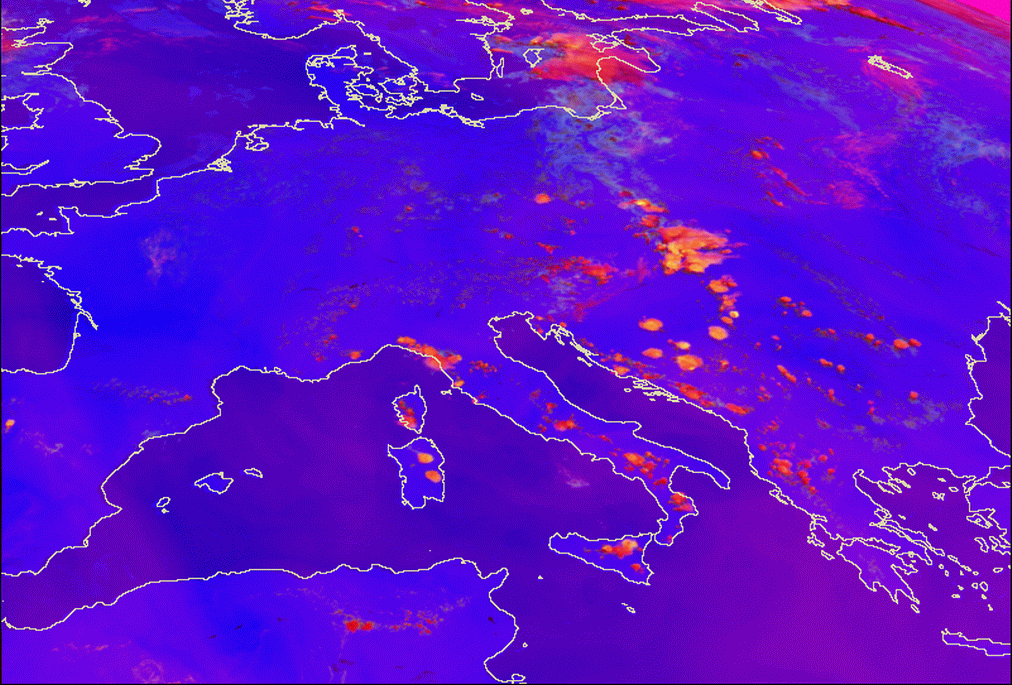
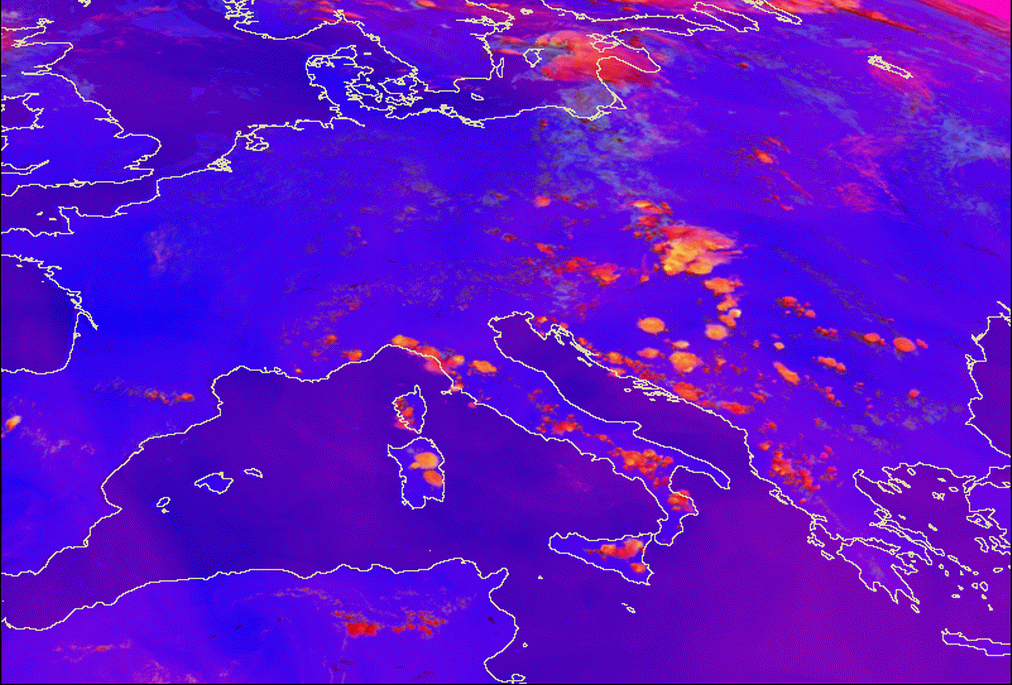
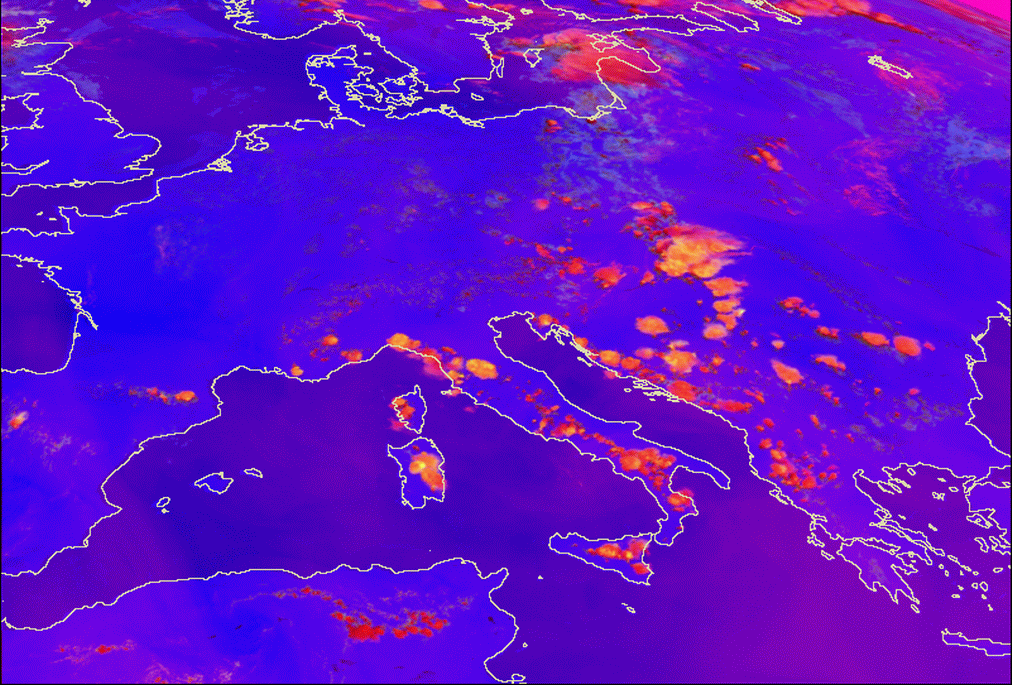
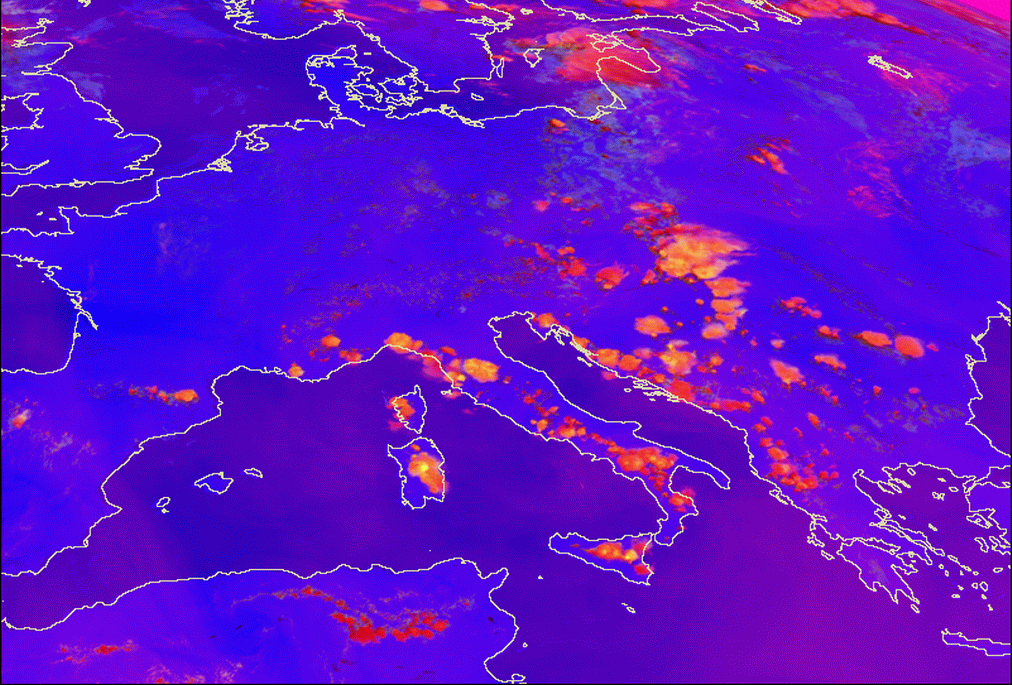
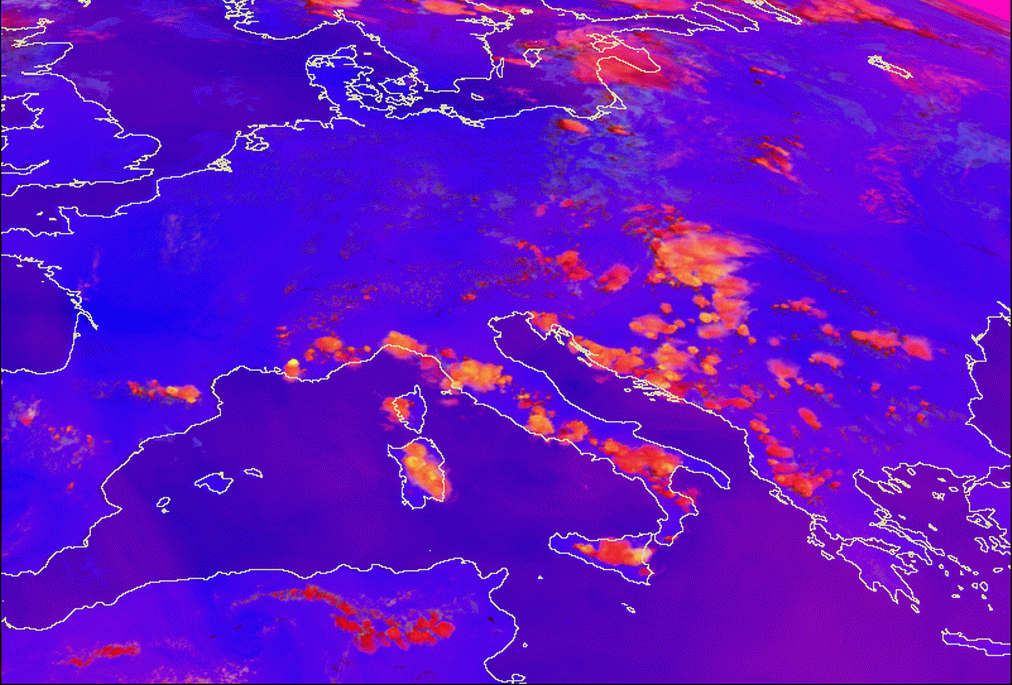
Meteosat 8 images on 24 July 2006 - first row 09 UTC, second row - 12 UTC, third row - 15 UTC; first column - VIS 0.6 µm,
second column - WV 6.2 µm, third column - IR 10.8 µm
|
|
|
Convective Convergence Lines in some typical regions and the appearance in HRVIS images in different times of day are described in more detail below.
1. Appearance in High Resolution Visible images
1.1 Greek convective Convergence Lines
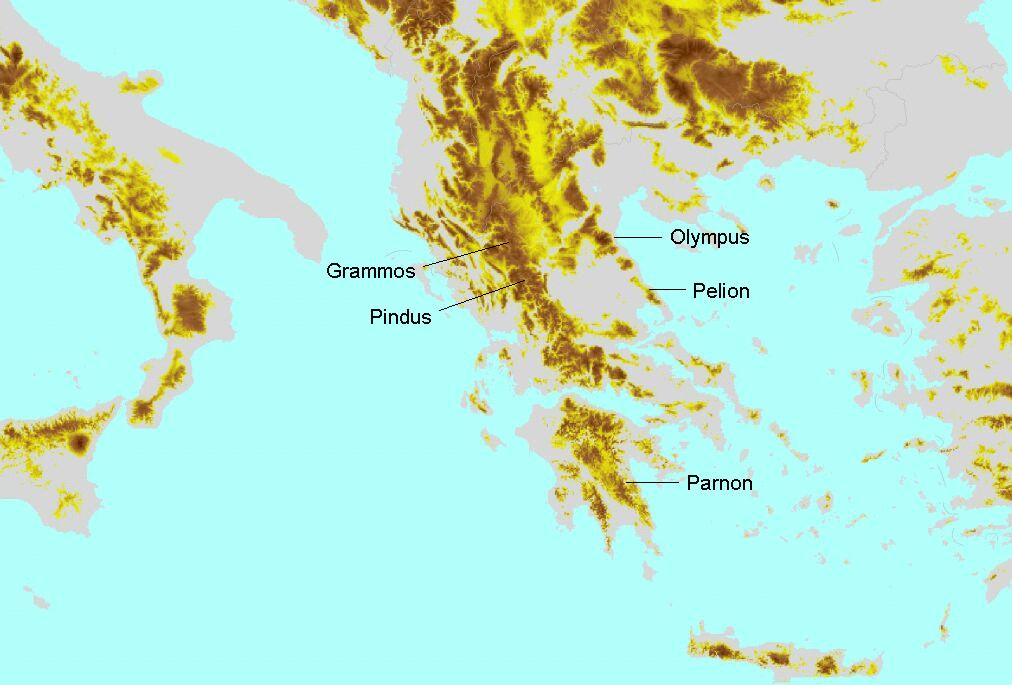
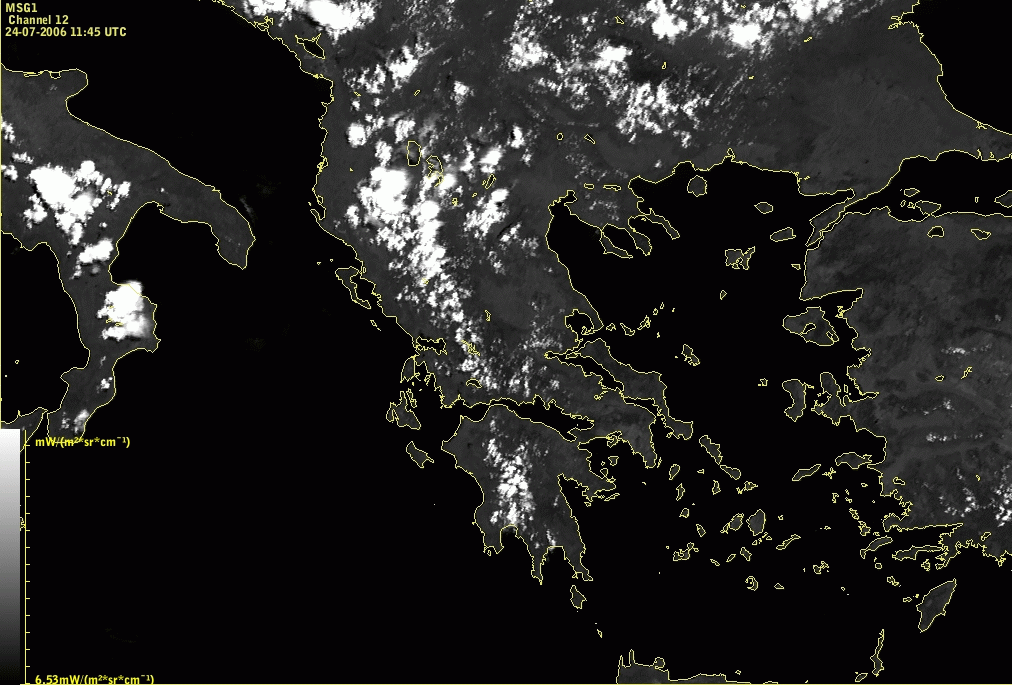
Lines of convective clouds can often be found over the Peloponnesian (Parnon), Pindus and Grammos mountains. Sometimes there are smaller lines in the East over neighbouring mountain chains.
|
|
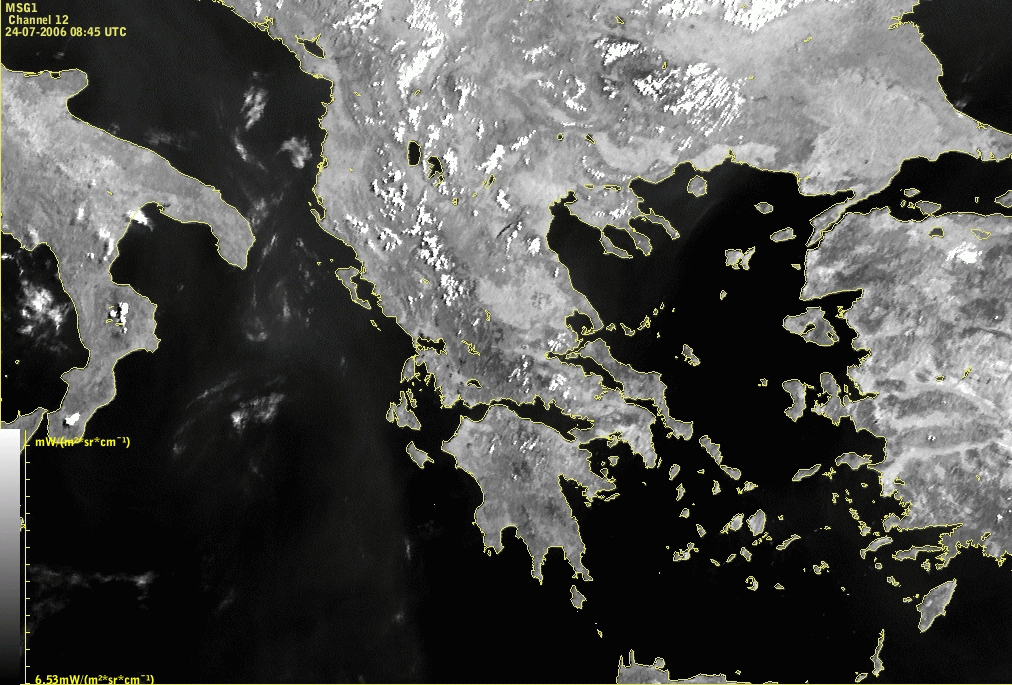
24 July 2006/09.00 UTC - Meteosat 8 HRVIS image
|
|
|
|
|
|
24 July 2006/12.00 UTC - Meteosat 8 HRVIS image
|
24 July 2006/15.00 UTC - Meteosat 8 HRVIS image
|
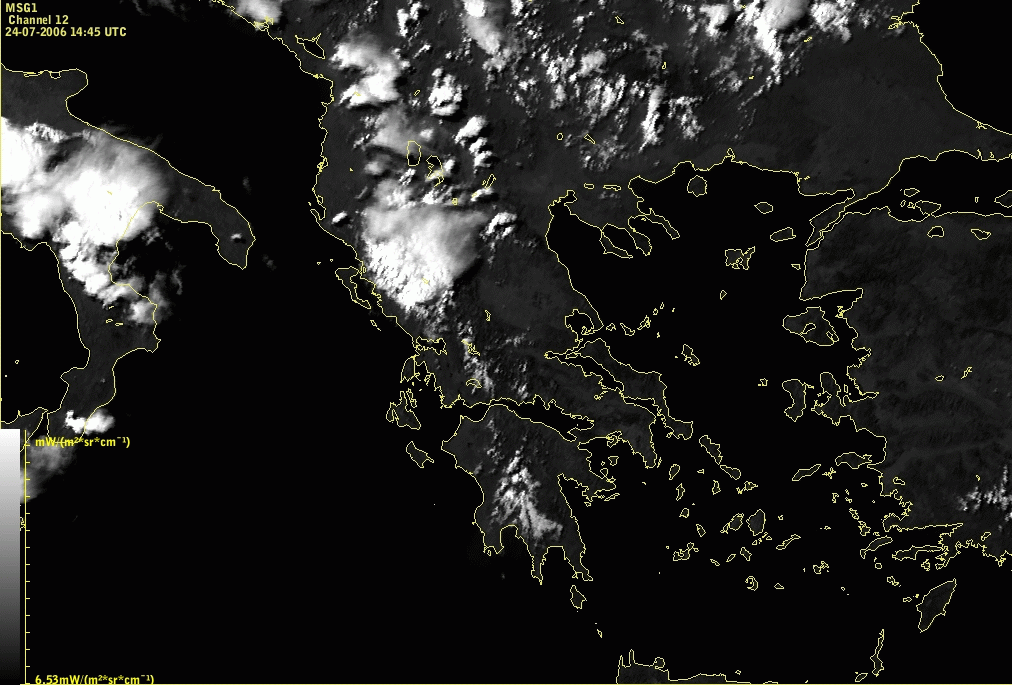
The convective Convergence Line under consideration extends from the SE Peloponnes across N. Greece to Macedonia.
There is a distinct life cycle of the clouds during daytime. In the morning hours there is usually no activity or only small cumuli clouds are present, but already clearly showing the correlation to the mountain chain. Development starts around noon, when some cells are already well developed. In the afternoon, over the highest mountain peaks, convective cells can develop into larger systems or merge with other cells. Cirrus anvils form and show the prevailing wind direction. At the same time smaller cells are dissolved.
It should be mentioned here that the time stated in the top left corner of the images is the time of the beginning of the scan over the south pole. In the mid-latitudes of the northern hemisphere the time of the image is almost 15 minutes later, therefore the time in the captions under the images differ from the time in the image for 15 minutes (the time in the captions is closer to the real time). This is valid for all Meteosat 8 images used in this Conceptual model.
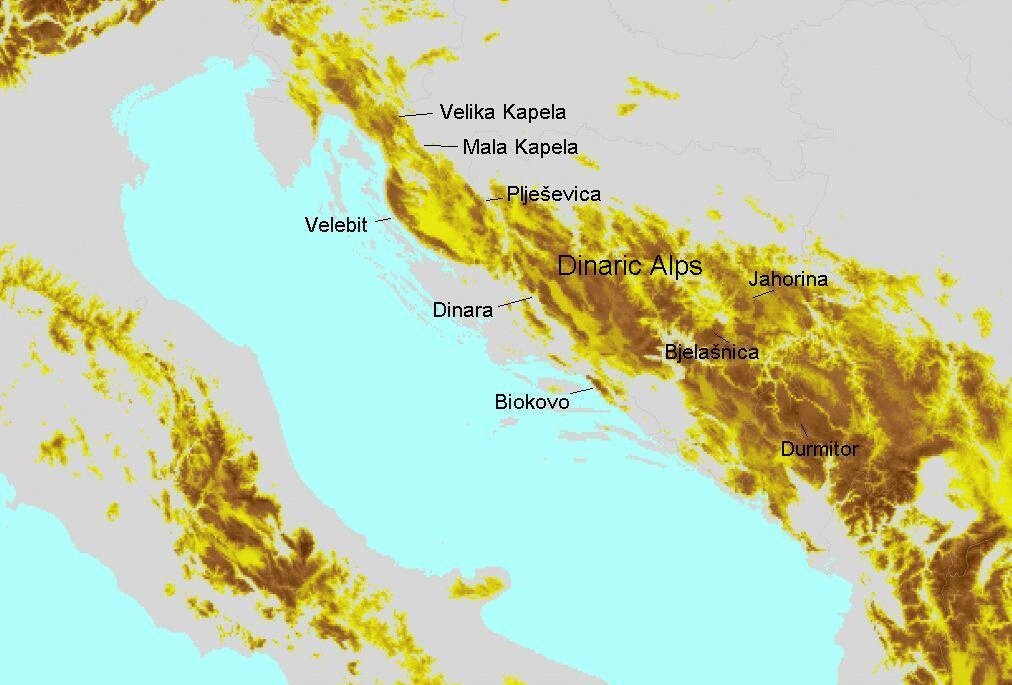
1.2 Convective Convergence Lines over the Dinaric Alps
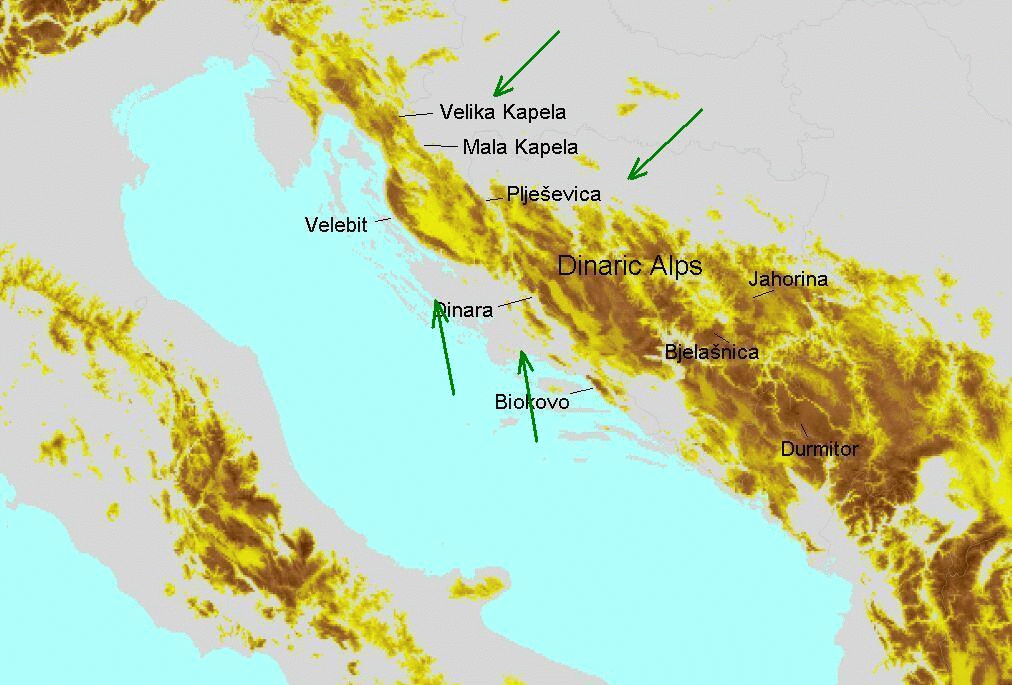
Lines of convective clouds often develop from the Northwest to the Southeast part of the Dinarides. The convective cells within the line are most pronounced over the highest mountain peaks, and more developed near to the Adriatic coast. At 12.00 UTC the characteristic clouds are clearly visible over mountains Velebit, Dinara, Mala and Velika Kapela, Jahorina, Bjelašnica and Durmitor. In the afternoon clouds can merge into bigger systems and cirrus anvils form, whereas some of the cells are dissolved.
|
|
24 July 2006/09.00 UTC - Meteosat 8 HRVIS image
|
|
|
|
|
|
24 July 2006/12.00 UTC - Meteosat 8 HRVIS image
|
24 July 2006/15.00 UTC - Meteosat 8 HRVIS image
|
The convective Convergence Line over Dinaric Alps extends along the Adriatic coast and exhibits characteristic development during the day.
1.3 Alpine Convergence Lines
Also in the area of the Alps orographic Convergence Lines can be observed but these events have to be differentiated a bit more:
- there are Convergence Lines very similar to the ones already mentioned; they appear in the N-S oriented part of the W. Alps and are quite bright;
- there are Convergence Lines in the W-E oriented part of the Central and E. Alps mainly along the highest mountain chains; these lines are usually less bright and also more narrow than the other types just mentioned; they are most easily seen when developing in front of approaching fronts from the W.
|
|
24 July 2006/09.00 UTC - Meteosat 8 HRVIS image
|
|
|
|
|
|
24 July 2006/12.00 UTC - Meteosat 8 HRVIS image
|
24 July 2006/15.00 UTC - Meteosat 8 HRVIS image
|
Development of convective lines over Alps during the day show stronger development in the western Alpine region.
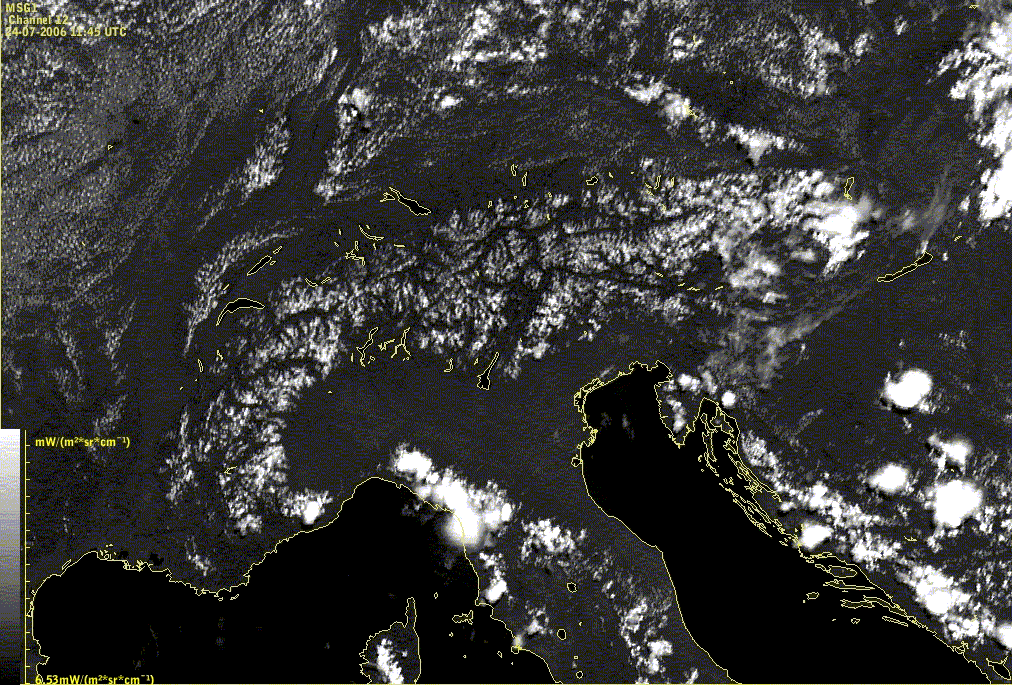
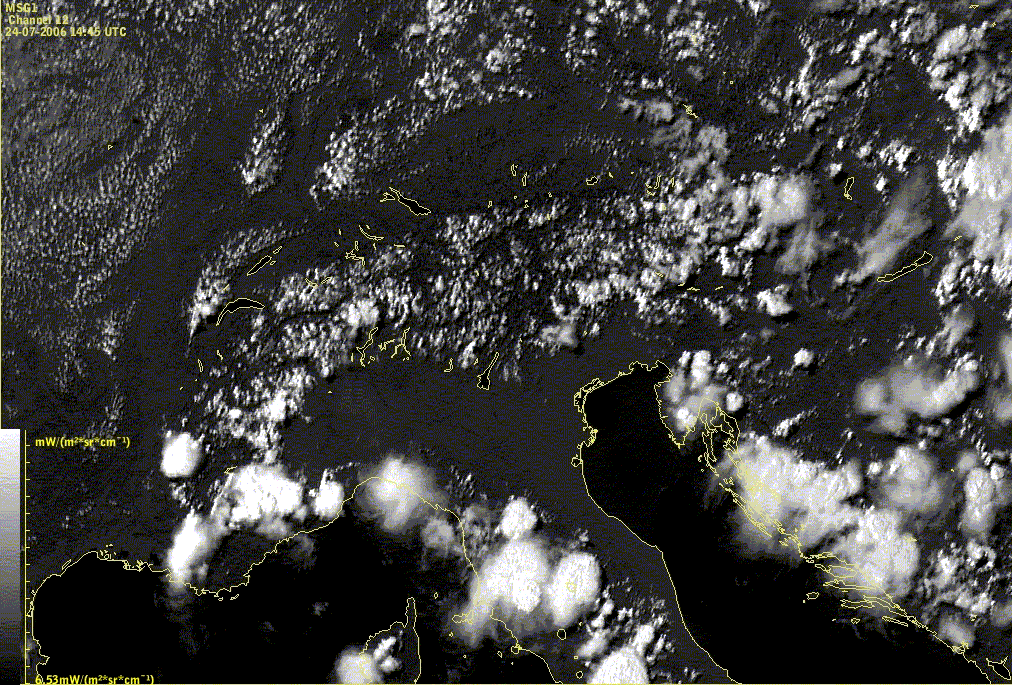
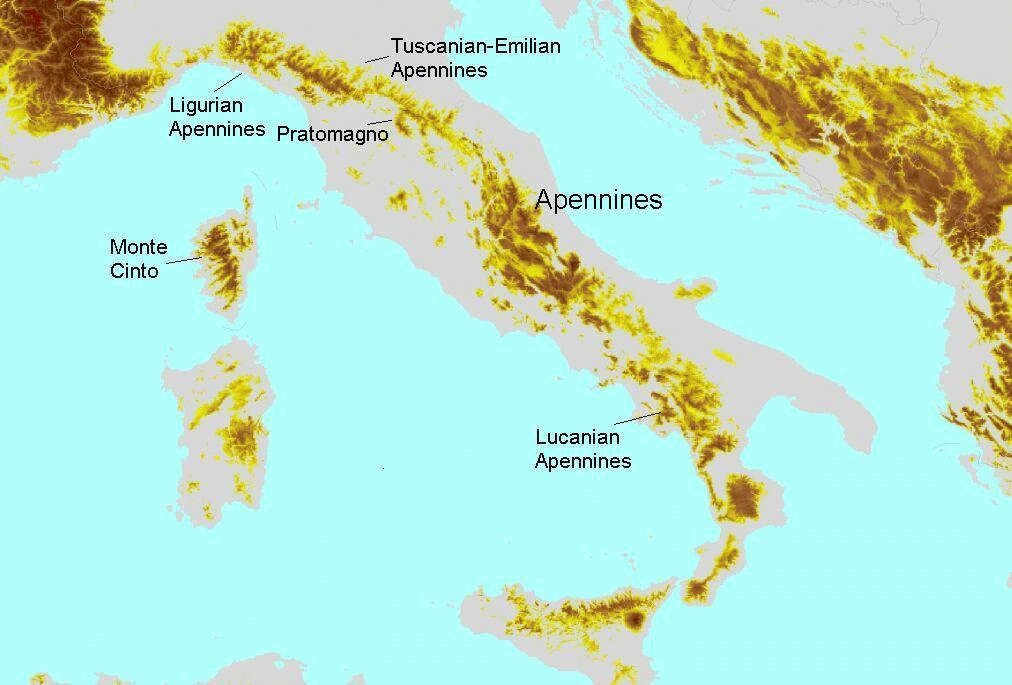
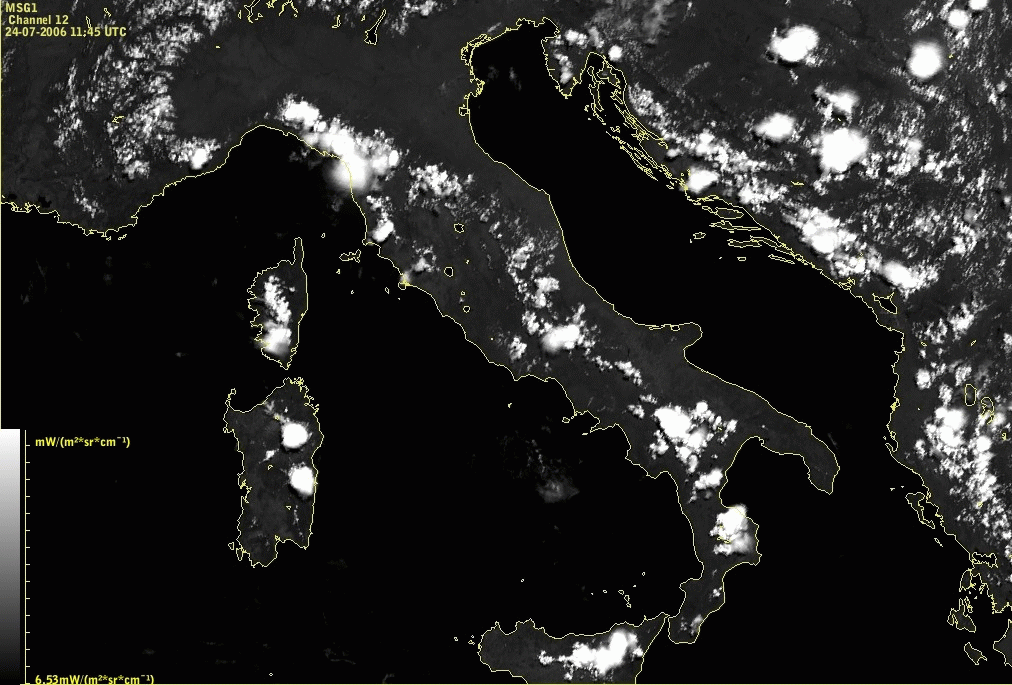
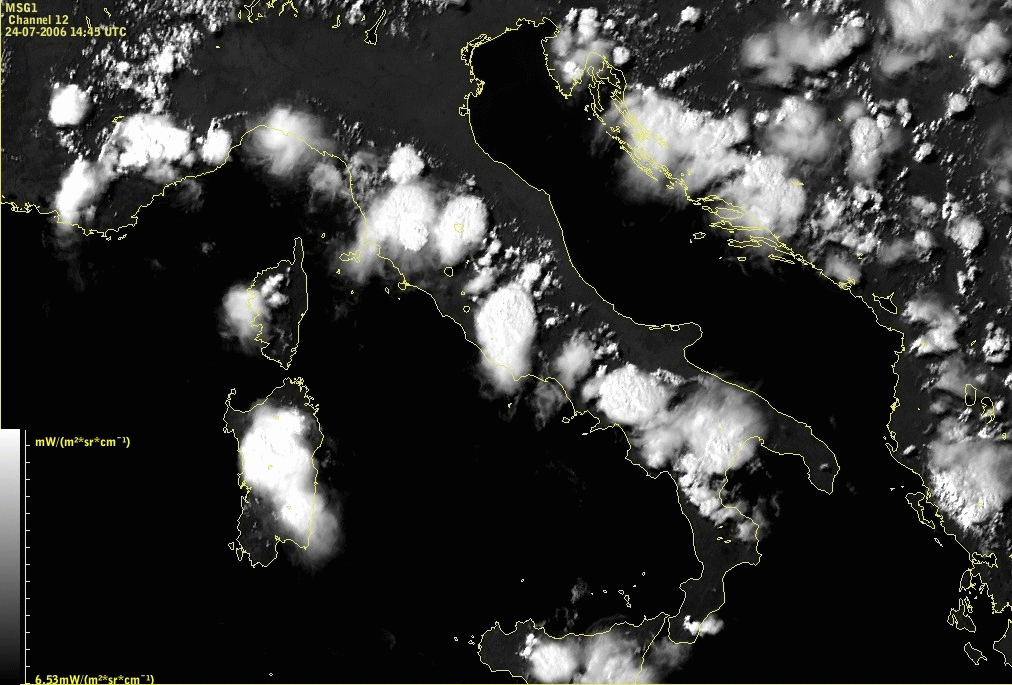
1.4 Apennine convective Convergence Lines
Over the Apennines convective clouds can be seen all along the peninsula with the largest cells over the highest mountains. On Corsica and Sardinia clouds are also visible over the mountain peaks and on Sicily over Etna. The brightest clouds at 12.00 UTC are over Ligurian, Tuscanian-Emilian, Central and Lucarian Apennines.
|
|
24 July 2006/09.00 UTC - Meteosat 8 HRVIS image
|
|
|
|
|
|
24 July 2006/12.00 UTC - Meteosat 8 HRVIS image
|
24 July 2006/15.00 UTC - Meteosat 8 HRVIS image
|
Lines of convective clouds over the Apennines show typical development including convective clouds over islands Sardinia, Corsica and Sicily.
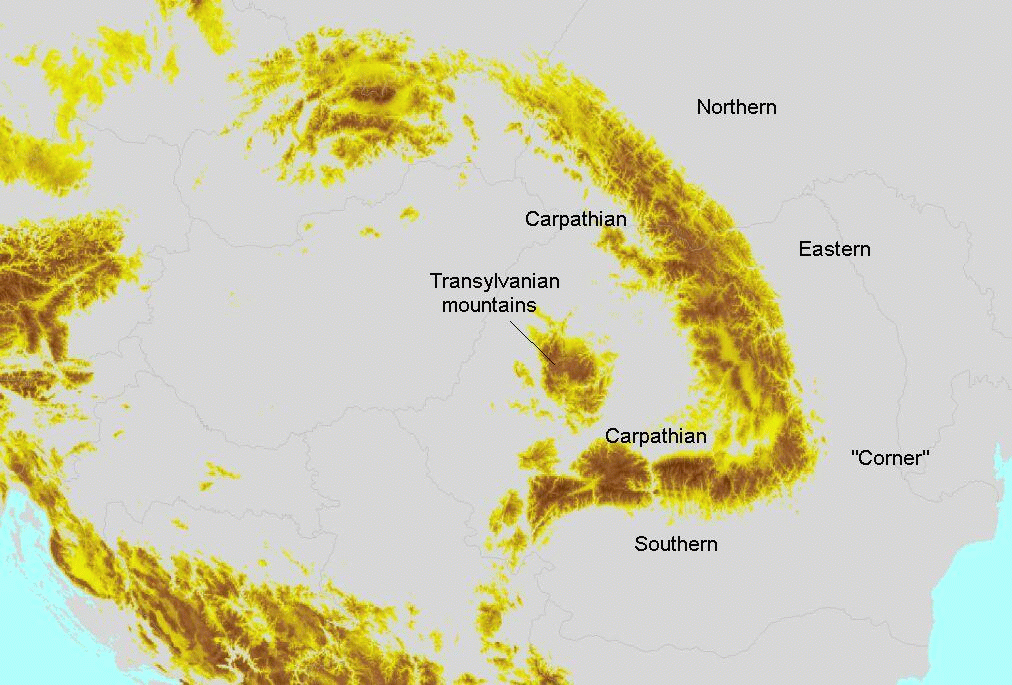
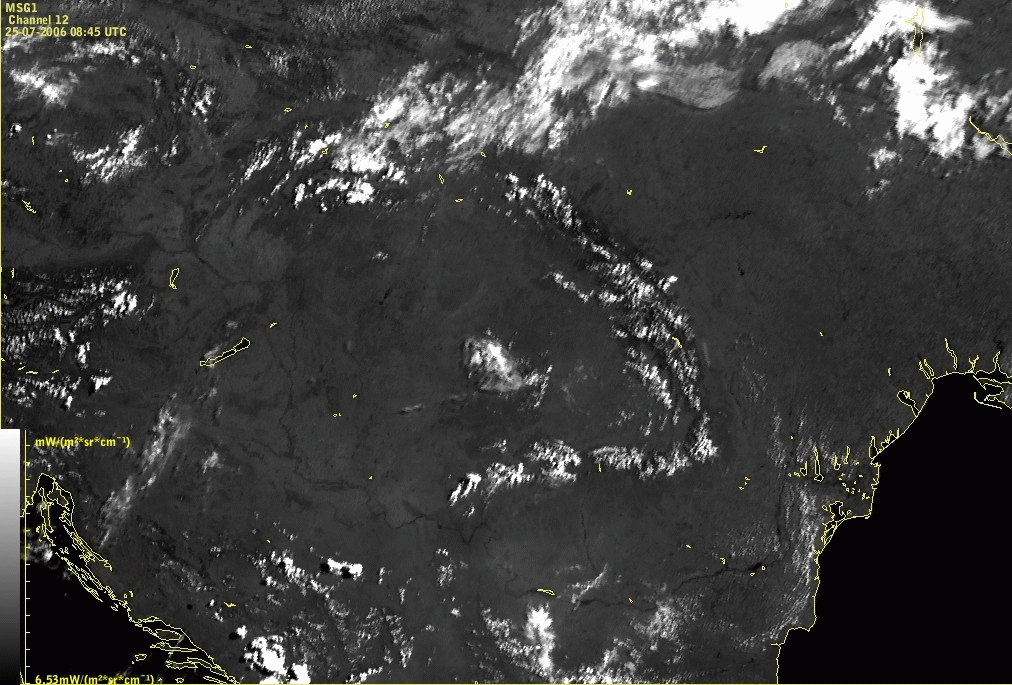
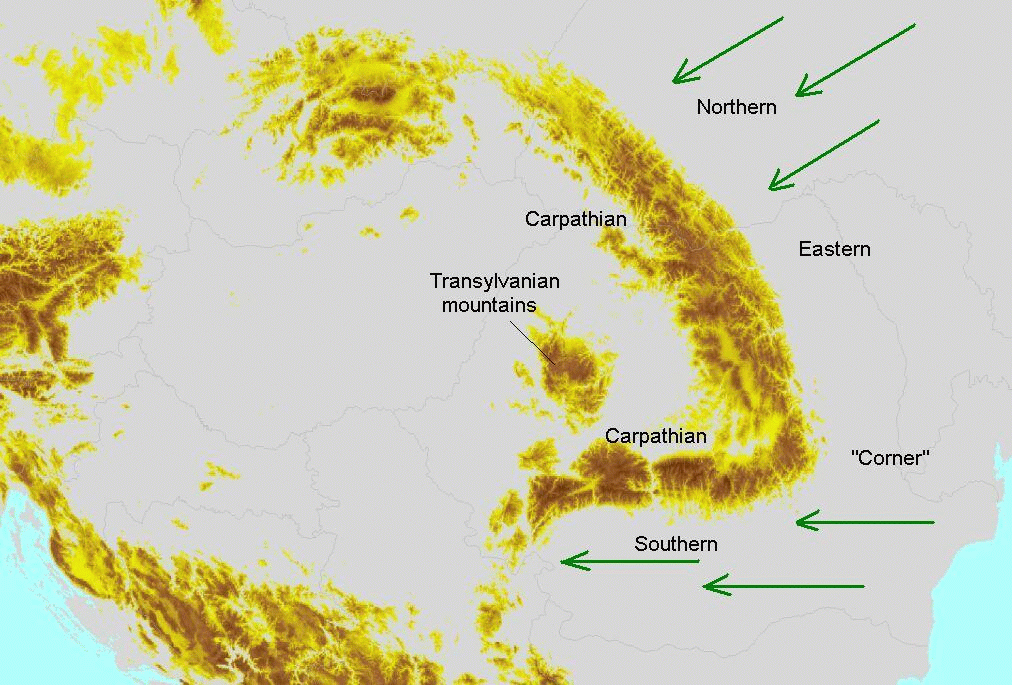
1.5 Carpathian Convergence Lines
Cloudiness situated over the Carpathian and Transylvanian mountains is a regular phenomenon.
|
|
25 July 2006/09.00 UTC - Meteosat 8 HRVIS image
|
|
|
|
|
|
25 July 2006/12.00 UTC - Meteosat 8 HRVIS image
|
25 July 2006/15.00 UTC - Meteosat 8 HRVIS image
|
As in all other regions, a typical life cycle shows high relationship with the time of the day.
Clouds begin to develop in the morning hours. The HRVIS image shows the Carpathian mountains very dark (darker than the cloud free surroundings) with some few white dots already appearing. In the IR image the mountainous area is grey. In the WV image the grey shades can range from light grey to very dark grey depending on the humidity of the middle atmosphere.
During the next hours the clouds indicate the formation of a convective Convergence Line. Around noon, convective activity is reaching a peak. Single cells within the line are clearly visible at 12 UTC in the HRVIS image, but also in the other channels. Such lines often end at the Romanian - Ukrainian border in the North. If there is a continuation of the line into the Northern Carpathians mountain region, the development can be as strong as in the other parts.
The intensity of the cells within the line varies a lot. There can be huge Mesoscale Convective Systems (MCSs) (see
Cb and MCS
) or only small convective cells. If the area of convective activity is large the typical line structure begins to dissipate.
The maximum of this phenomenon can be observed by early afternoon. Sometimes, some clouds may be weakening, whereas at the same time other
clouds are still growing. There can be a difference especially between the Eastern Carpathian and the Southern Carpathians which sometimes seem
to develop independently. At the "corner", where there is the transition between the Eastern and the Southern Carpathians, the
cloudiness is often interrupted (this is also reflected in the Local Area Model (LAM), see
Meteorological physical background
and
Key parameters
).
During the dissipation stage, the changes are first seen in the VIS image whereas in the IR channel the cloudiness disappears later. The reason is that the thin remaining cirrus can be seen in the IR channel, but not in the VIS channels.
Sometimes a substructure within the Convergence Line can be observed: the line following the main mountain chain contains several lines perpendicular to it. This can be observed both in the Eastern and Southern Carpathian mountains.
1.6 Convergence Lines in the French Mountains
In southern France, convective Convergence Lines can be observed associated with the mistral, a regional northerly cold low level wind. This
phenomenon is much less frequent than the two convective Convergence Lines mentioned above.
This situation is characterised by a lot of roughly parallel lines with a north to south orientation. These lines are evolving from
unstructured convective clouds near the Central Mountains as a consequence of convergence at low levels parallel to the mountain ridges (see
Meteorological physical background
and
Key parameters
). The conditions at higher levels are quite different showing divergence, westerly flow and low humidity so that convective activity does not
reach high levels. That is the reason why a line structure cannot be seen in the WV image but only a grey tongue over France which indicates a
region of humidity.
|
|
11 June 1999/12.00 UTC - Meteosat 7 VIS image
|
|
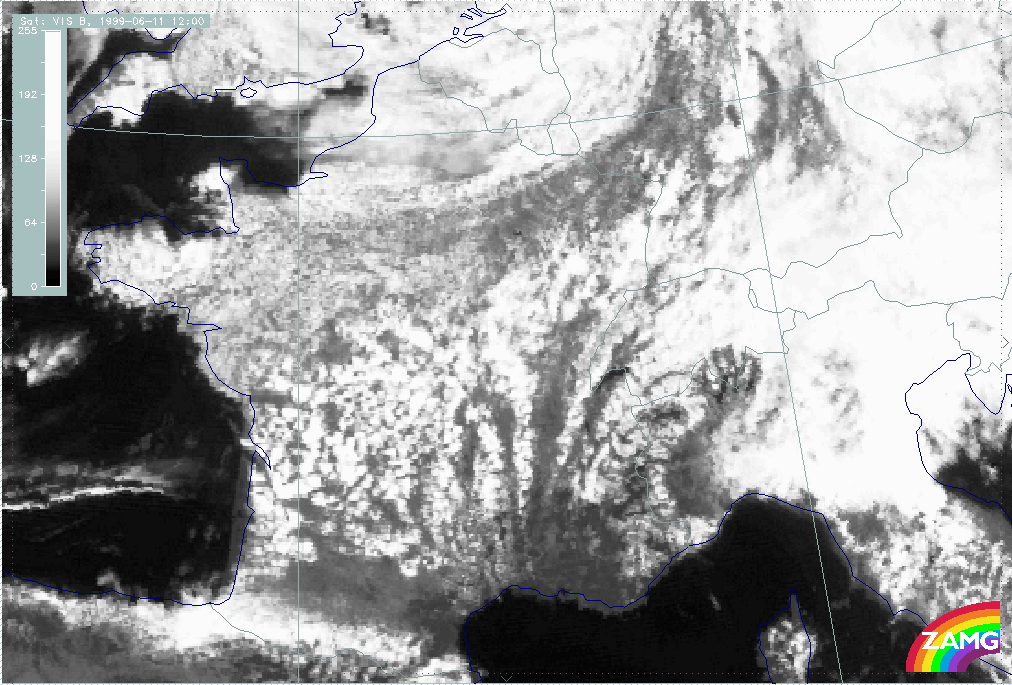
|
The case of 11 June 1999/12.00 UTC shows the maximum of development. The convective lines are clearly N. - S. oriented and typically fan-shaped and show a cellular structure.
Another case was found which showed that similar convective Convergence Lines can develop in southern France under different synoptic situations, namely, in the region of a decaying frontal system.
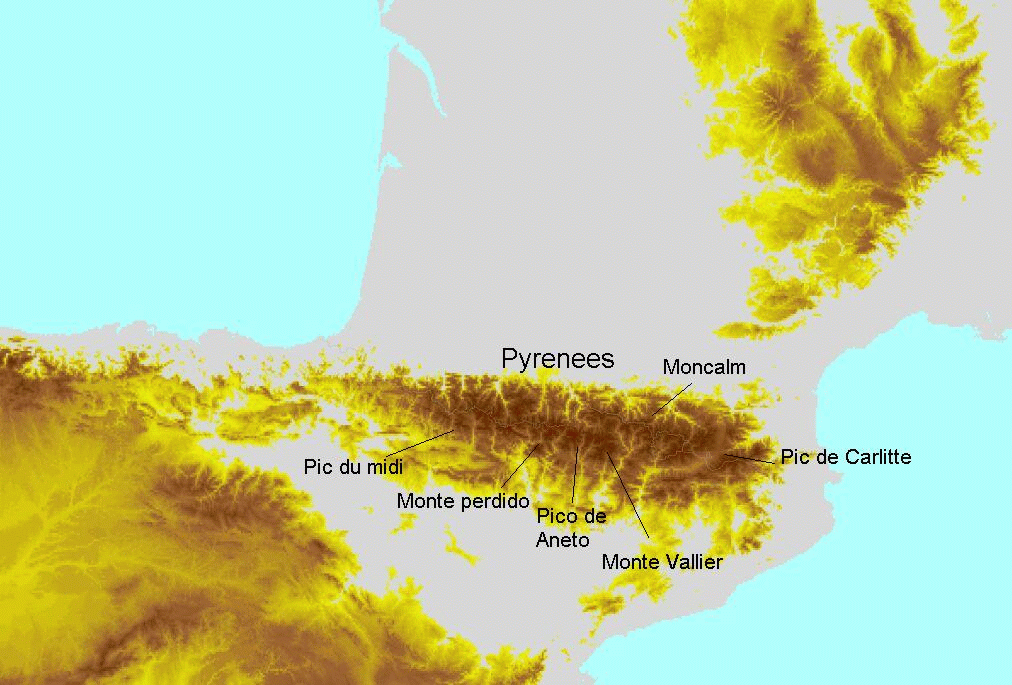
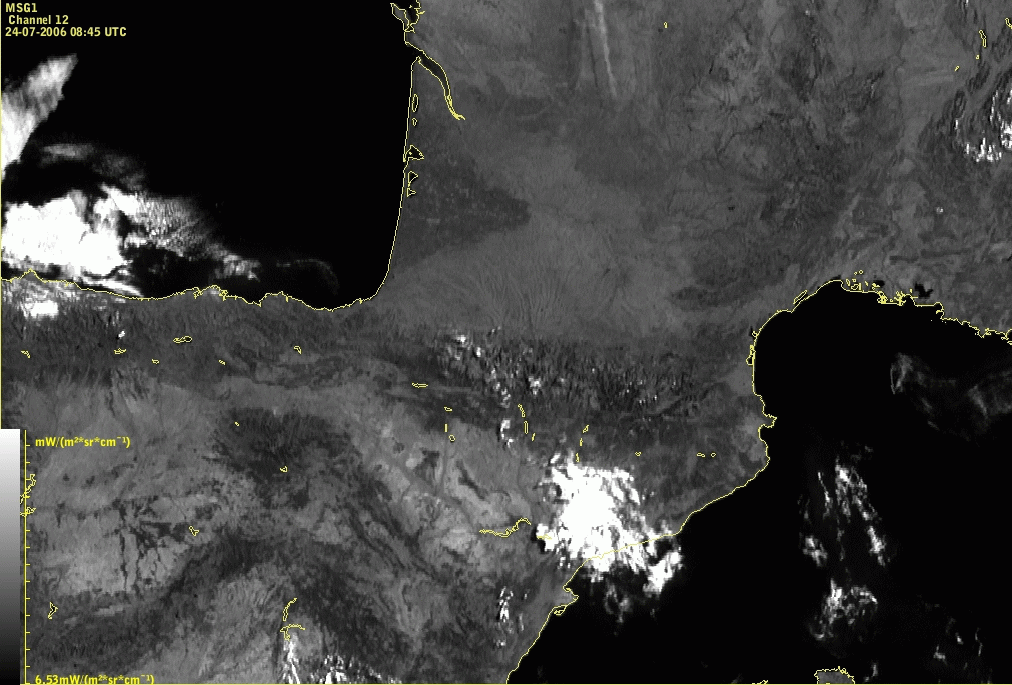
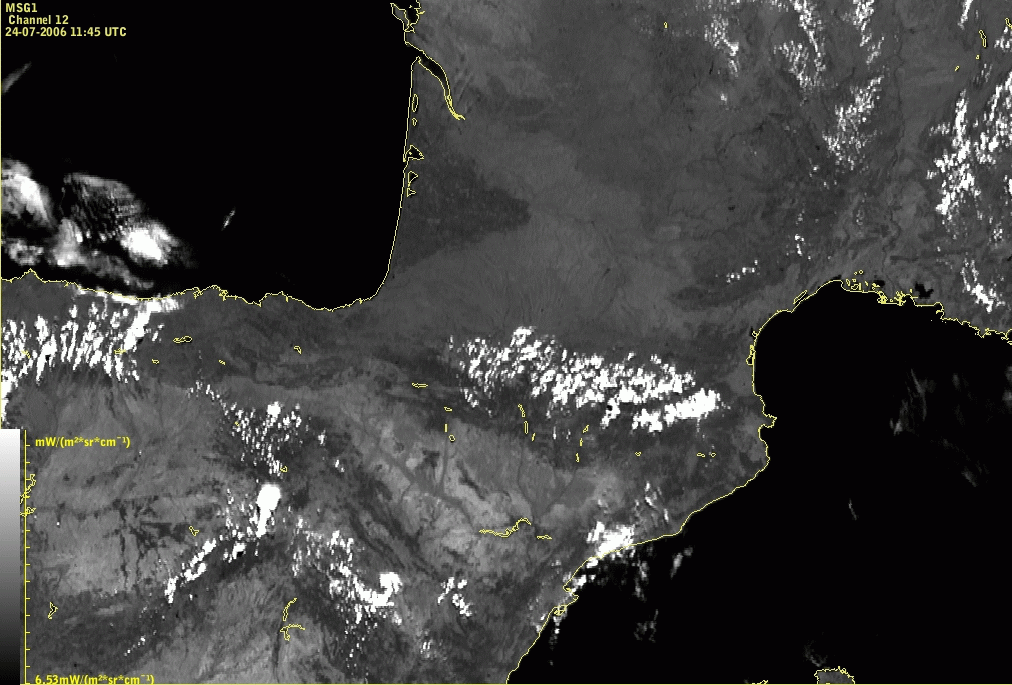
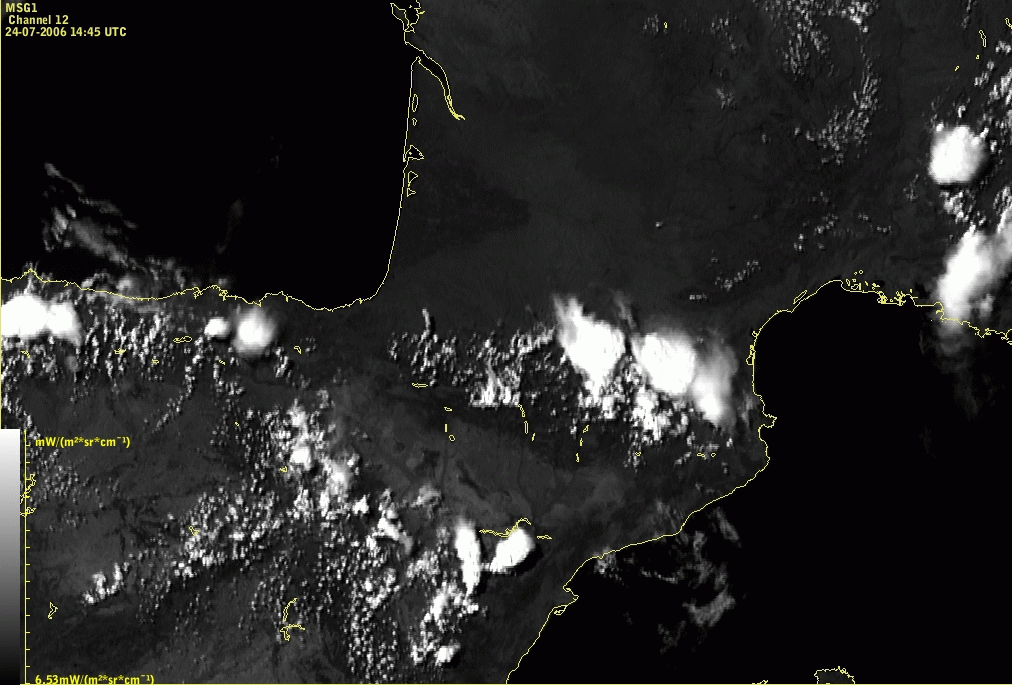
1.7 Convective Convergence Lines in the Pyrenees
Lines of convective clouds due to convergence over the Pyrenees often develop from west to east with the largest cells developing over the highest mountain peaks. More intensive development can be seen in the Eastern part of the Pyrenees from Moncalms to Pic of Carlitte in the afternoon. In HRVIS images in the Eastern part of Pyrenees the clouds are brighter than in the Western part.
|
|
24 July 2006/09.00 UTC - Meteosat 8 HRVIS image
|
|
|
|
|
|
24 July 2006/12.00 UTC - Meteosat 8 HRVIS image
|
24 July 2006/15.00 UTC - Meteosat 8 HRVIS image
|
Diurnal cycle clearly shows that the development starts around noon, whereas in the afternoon, above the highest mountain tops cells can grow very intensively.
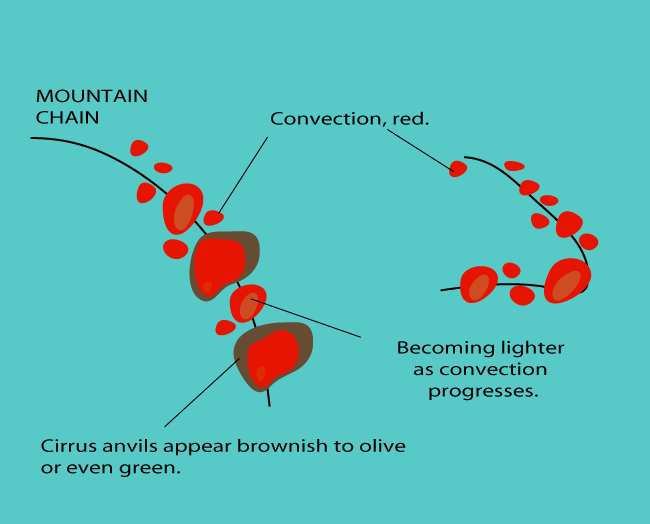
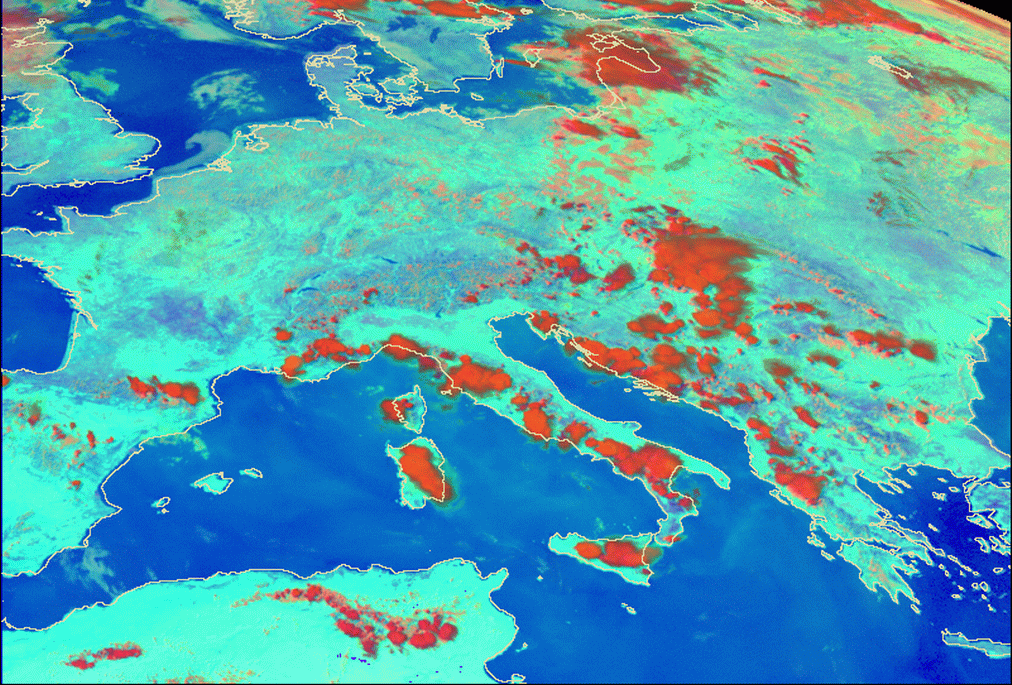
2. Appearance in the RGB composite images
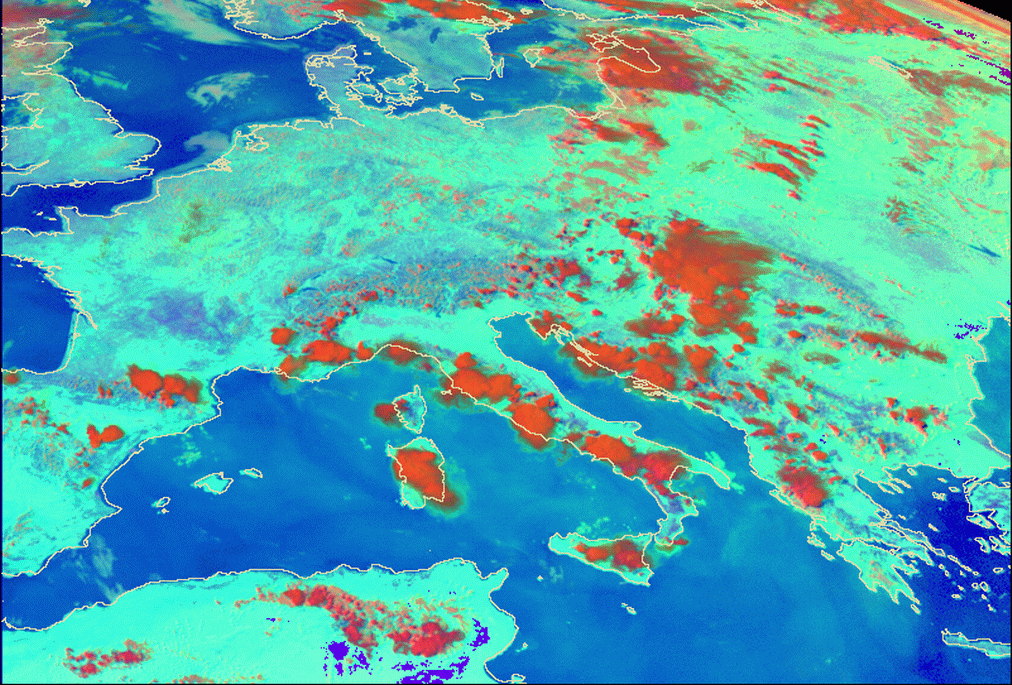
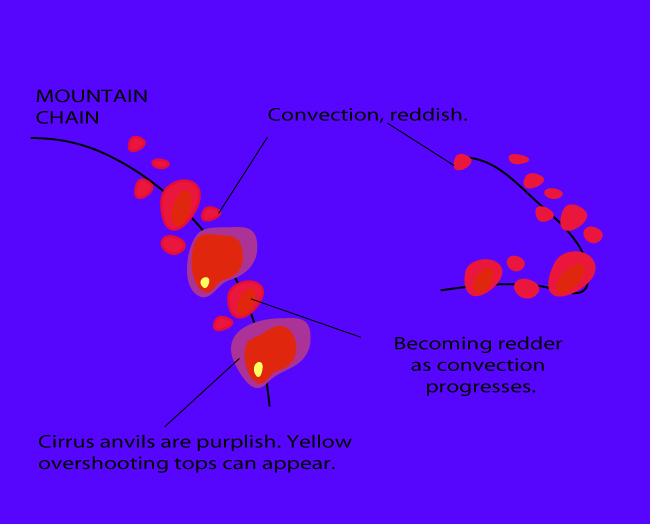
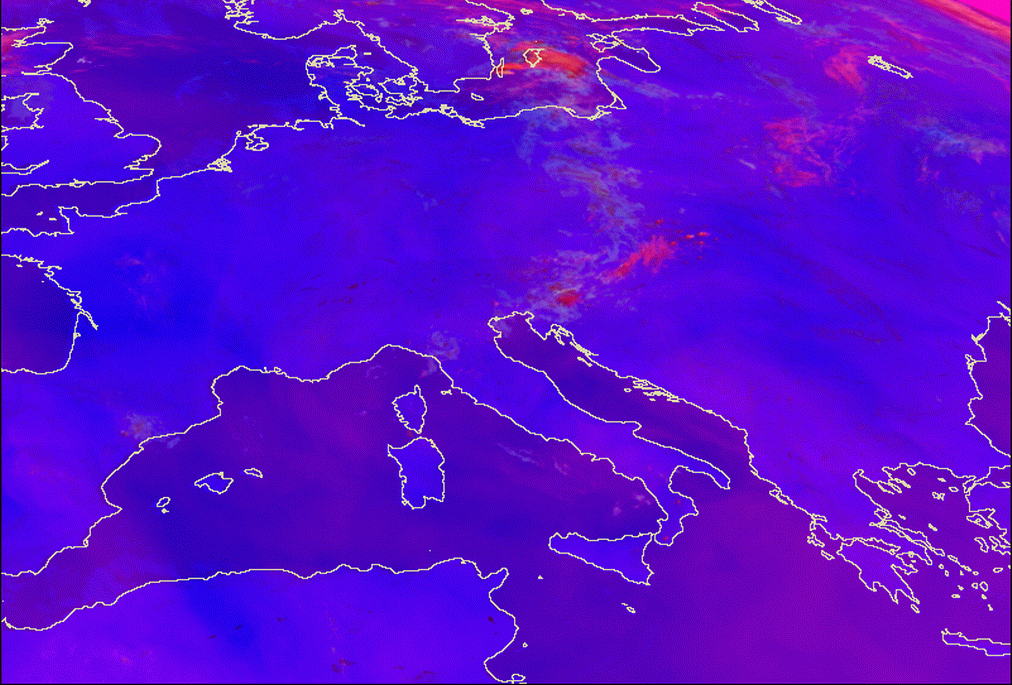
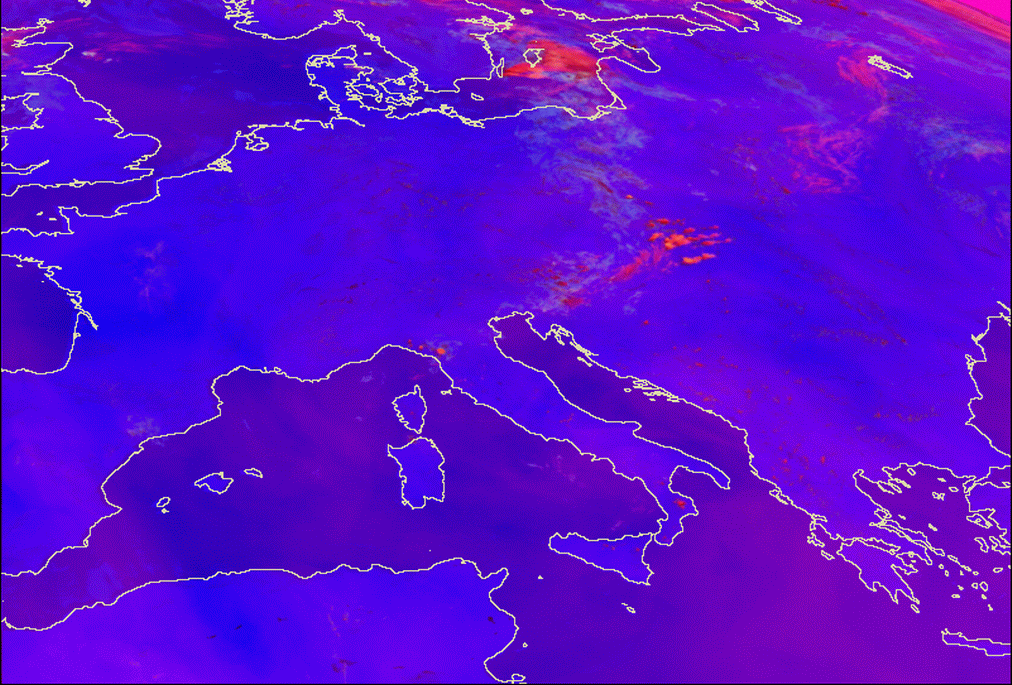
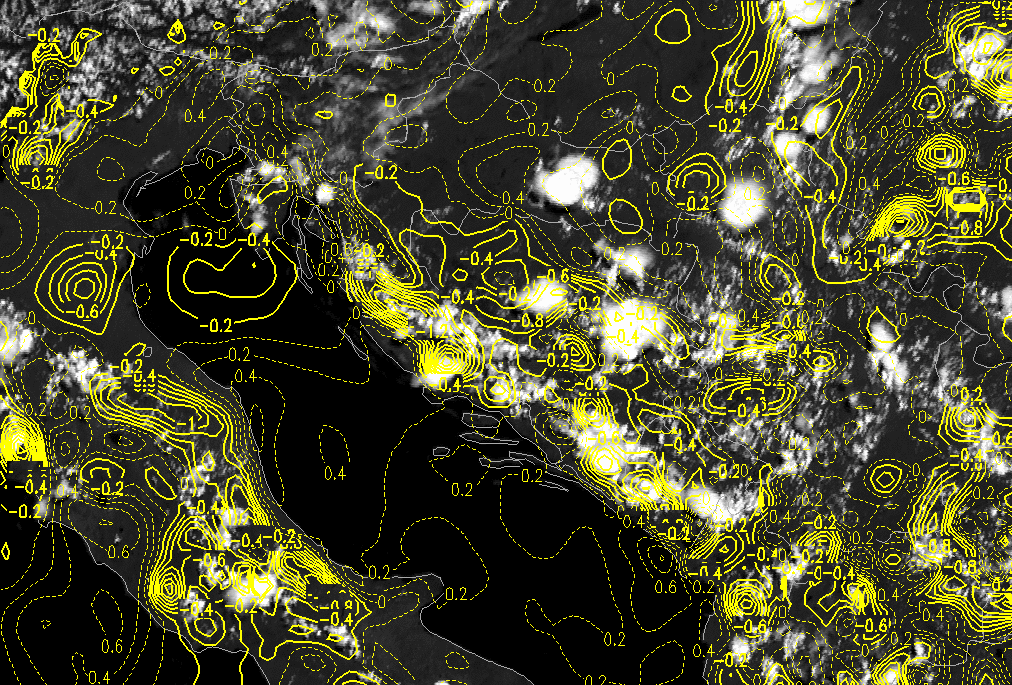
Besides in single channel images, especially HRVIS, convective Convergence Lines are easily detectable also in the RGB composites, especially Day Microphysical and Convective Storms composite. Day Microphysical composite is produced by combining 0.8 µm channel, solar component of the 3.9 µm channel and 10.8 µm channel. Convective storms composite consists of the difference of channels 6.2-7.3 µm on red, difference of channels 3.9-10.8 µm on green and difference of channels 1.6-0.6 µm on blue. The details of the enhancements for these composites can be found in the MSG Interpretation guide, RGB Images part 04 at http://oiswww.eumetsat.org/WEBOPS/msg_interpretation/PowerPoints/Channels/rgbpart04_20050420.ppt#1 .
The appearance of a convective Convergence Line in the Day Microphysical composite images is shown in the sketch below and the loop of the images.
|
|
24 July 2007/08.00 UTC - Meteosat 8 Day Microphysical Summer RGB image (0.8; A3.9; 10.8); 08.00 - 15.30 UTC half-hourly image loop
|
|
|
|
|
|
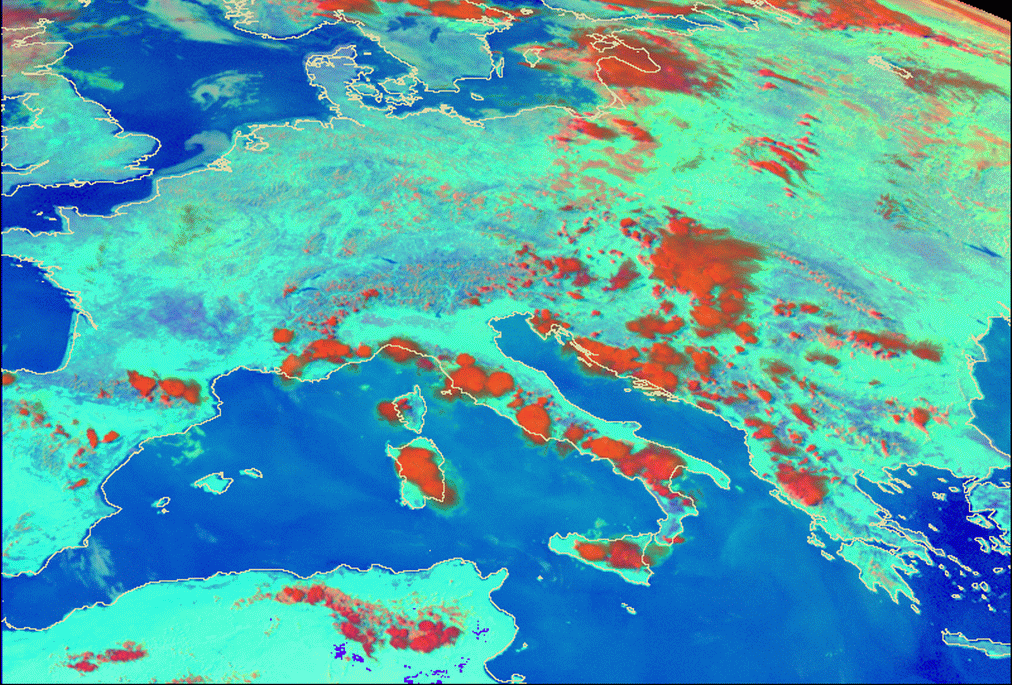
24 July 2007/15.30 UTC - Meteosat 8 Day Microphysical Summer RGB image (0.8; A3.9; 10.8)
|
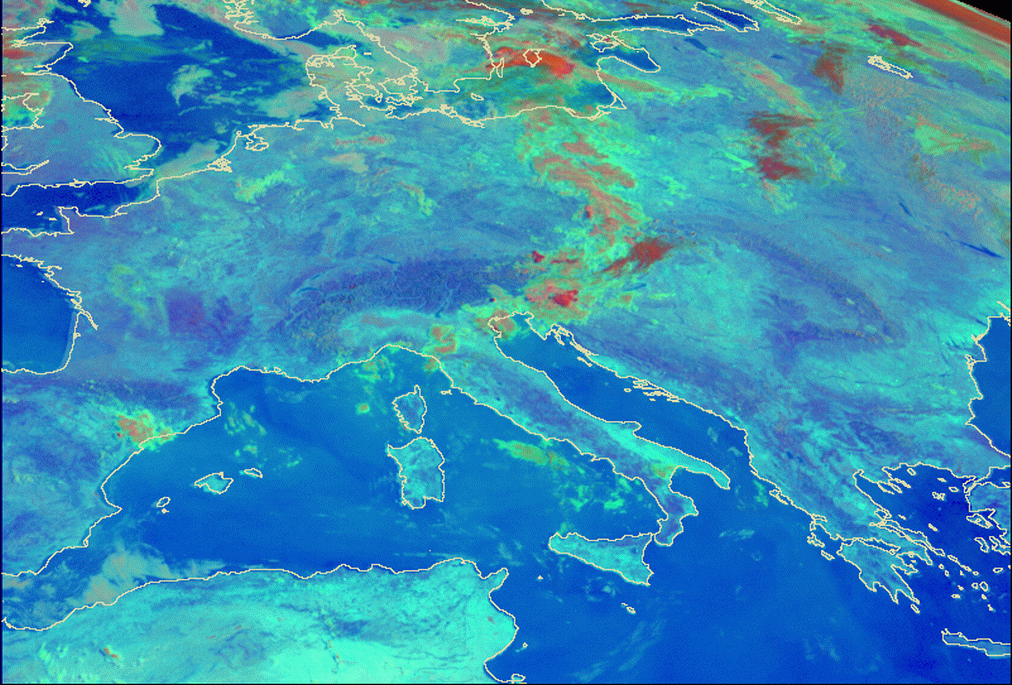
The appearance in the Convective Storms RGB is shown below:
|
|
24 July 2007/08.00 UTC - Meteosat 8 Day Microphysical Summer RGB image (0.8; A3.9; 10.8); 08.00 - 15.30 UTC half-hourly image loop
|
|
|
|
|
|
24 July 2007/15.30 UTC - Meteosat 8 Convective Storms RGB image (6.2-7.3; 3.9-10.8; 1.6-0.6)
|
Day Microphysical Summer and Severe Convection RGB composites were chosen because of their ability to clearly distinguish the cells within the Convergence Line and to show the different appearance of the cells connected to their development stage.
Meteorological Physical Background
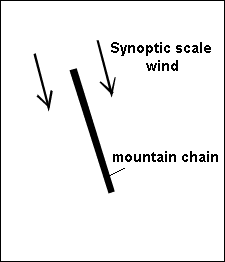
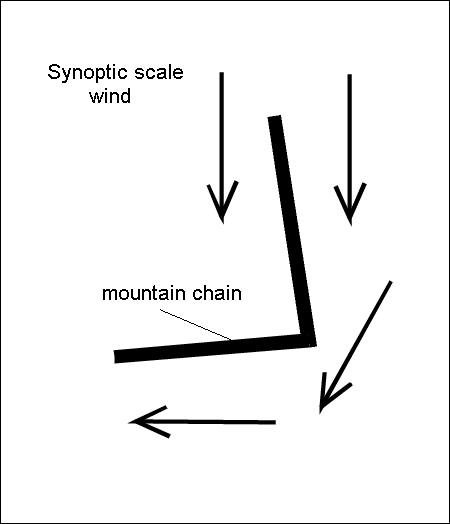
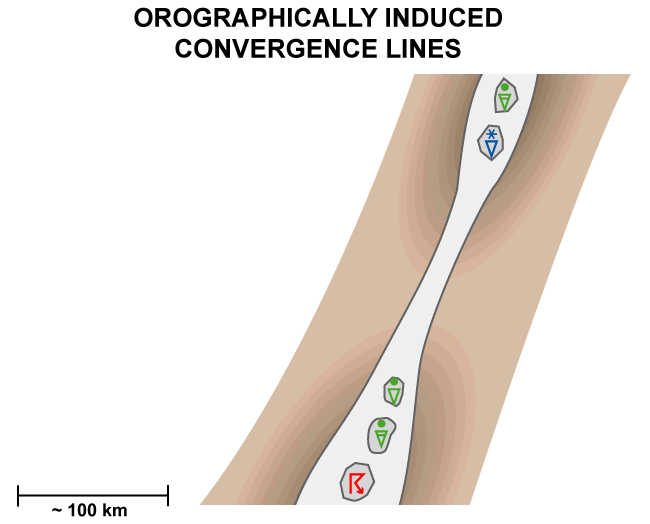
The main reason for the development of convective Convergence Lines is the wind field pattern produced by changing thermodynamical situations in an orographic region during daytime. Convergence of the wind during daytime develops because of the differential diurnal heating of the mountainous area (mountain slopes and valleys). These meso-scale wind patterns are under the influence of synoptic scale wind.
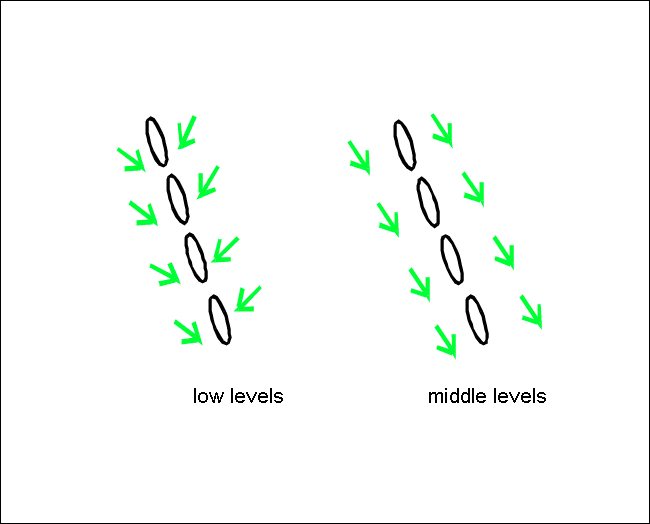
The convergence in these areas can be explained by two different effects:
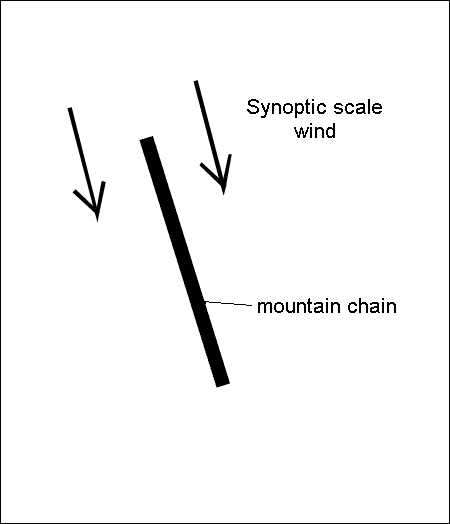
- A typical synoptic situation showing a large scale wind field in low and middle levels with wind directions more or less
parallel to the mountain chain. For the most of the mountain chains studied this means a northerly synoptic-scale flow, whereas in some
cases Convergence Lines develop in westerly or north-westerly flow.
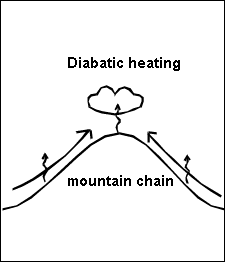
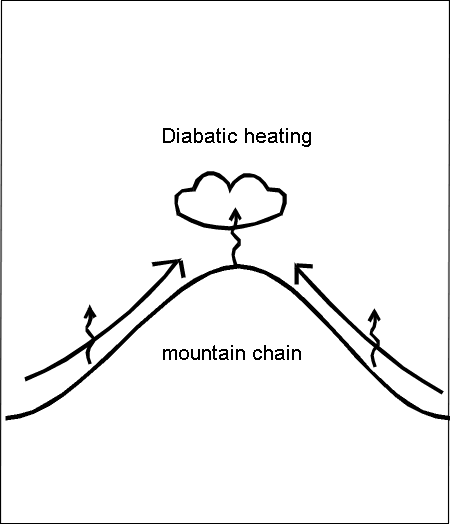
- The orography changes the wind field in direction as well as in speed. During the morning, in mountainous areas, there is a
flow around an obstacle, and during the day the wind develops a component towards the mountains. The speed is quite low and there is a
flow up the slopes. This can be explained by diabatic heating by the mountainous surface during daytime. (In the study made by ZAMG and DHMZ, cases from June to September were chosen since the Convergence Lines are better developed during the summer due to higher levels
of solar radiation). During morning hours sensible heat is transferred from the ground to the air because of the incoming solar
radiation. The air over the slopes, which is warmer than the one in the valley, rises up the mountain slopes creating upslope flows.
During that time convective boundary layer (CBL) height grows above the heated surfaces. Wind speeds increase as the CBL height grows
to higher altitudes. They usually peak in the late afternoon when the CBL reaches its maximum depth. The wind up the slopes is
determined by the topographic features like slope angle and friction. The curvature of a slope also induces some vertical motion. This
wind field results in convergence directly over the mountain chains or sometimes slightly shifted to the leeward side. Upward motions
can be found in the regions of convergence.
The strength of the upslope wind also depends on the climate of the area being observed. Mountains in moister climates, for example, have weaker diurnal mountain wind systems, because of the weaker sensible heat fluxes. For mid-latitudes these winds are the strongest during the warmer part of the year (mostly during summer months), and convective Convergence Lines can be observed mostly during this period. The strength of the upslope winds can get modified by the cloud cover, and is also sensitive to microclimatic variations.
The Greek and the French mountain Convergence Lines show very similar properties regarding the meteorological situation: A northerly synoptic-scale flow and the development of convective Convergence Lines over the mountain ranges. Over the Pyrenees and the Apennines Convergence lines develop mostly in north-westerly or westerly upper level flow, whereas over the Dinarides they can develop also in the south-westerly situation (see Key parameters ).
The Convergence Lines forming over the Carpathian mountains indicate a more complicated physical background: There are two "branches" of mountain chains. In case of northerly synoptic scale wind flow, the Eastern Carpathians are orientated in the same direction as the wind whereas the Southern Carpathians are more or less perpendicular to it. Therefore the convective cloudiness along the southern Carpathians cannot be explained by the same theory. As described in more detail in the chapter "key parameters" (see Key parameters ), a flow around the two mountain ranges as well as a small scale cyclonic rotation only at low levels can be observed in the majority of cases; this might be an explanation for a component towards the Southern Carpathians. At the transition between the Eastern and the Southern Carpathians (the "corner"), cloudiness is weakest. This is in accordance with an area where convergence is low or even divergence may be occuring.
The Transylvanian mountains also influence the wind field. There is a flow around them in the morning and a flow over them at noon.
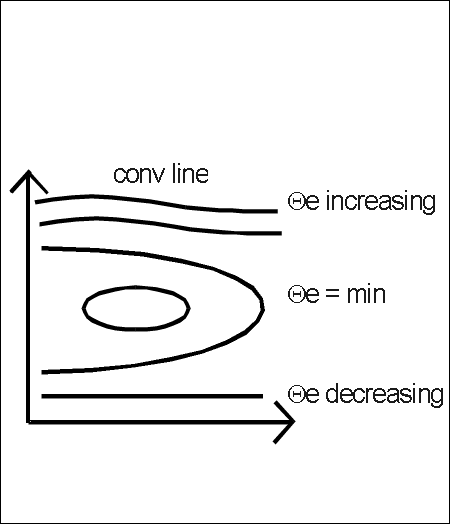
Key Parameters
Convective convergence lines are small-scale to meso-scale phenomena, therefore data from a relevant Limited Area Model (LAM) are absolutely necessary to supplement large scale (e.g. ECMWF) forecast data. In the studies made by ZAMG and DHMZ, both models were used: the synoptic situation can be described sufficiently by ECMWF data, whereas the LAM model ALADIN is excellent for the interpretation of divergence, vertical motion and the wind field. The most important level for the detection of convection is 925 hPa. However, due to the fact that this level is frequently found under the ground in the mountainous area, 850 hPa level has also been used. Convergence Lines can be detected in the model up to 800 hPa or in a few cases even higher. Whilst Convergence Lines show differences synoptically, they are similar in terms of small scale key parameters.
Typical synoptic environment
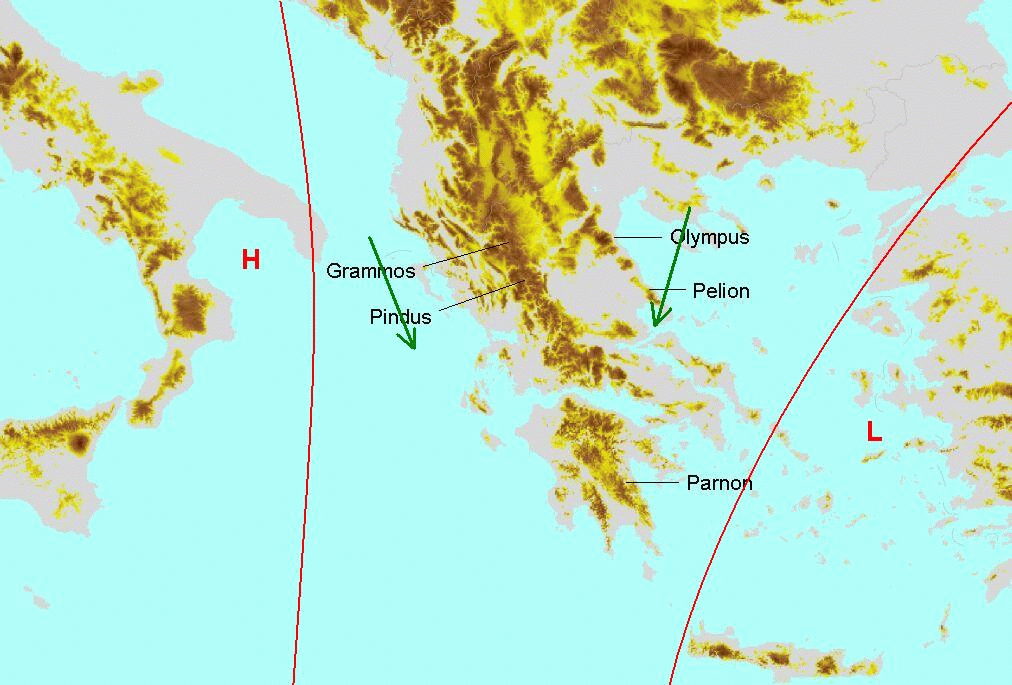
1. Greek convective Convergence Lines
These lines seem to occur in certain synoptic situations:
- There is a low or, at least, an upper level low over Turkey and a High over the central Mediterranean.
- An upper level ridge (sometimes also a surface ridge) is situated over Greece.
- As there is no frontal situation over Greece, the equivalent thickness shows only a small gradient; The TFP sometimes shows a positive value originating from a frontal system passing by to the north.
- The isobars at low levels show a weak gradient but with winds from a northerly direction.
|
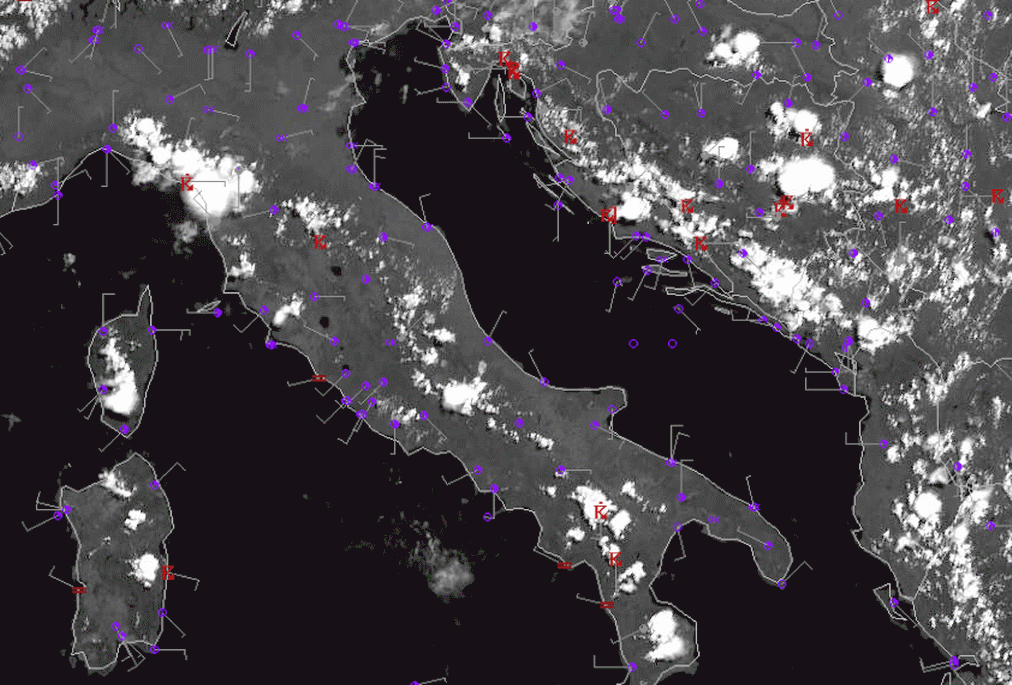
|
24 July 2007/12.00 UTC Meteosat 8 HRVIS image; magenta: height contours 1000 hPa, blue: height contours 700 hPa, green: wind
vectors 1000 hPa (ECMWF analysis)
|
|
|
In this image, there is an upper level low over Turkey and a high over the Mediterranean. Greece is situated at the eastern edge of a ridge at 700 hPa.
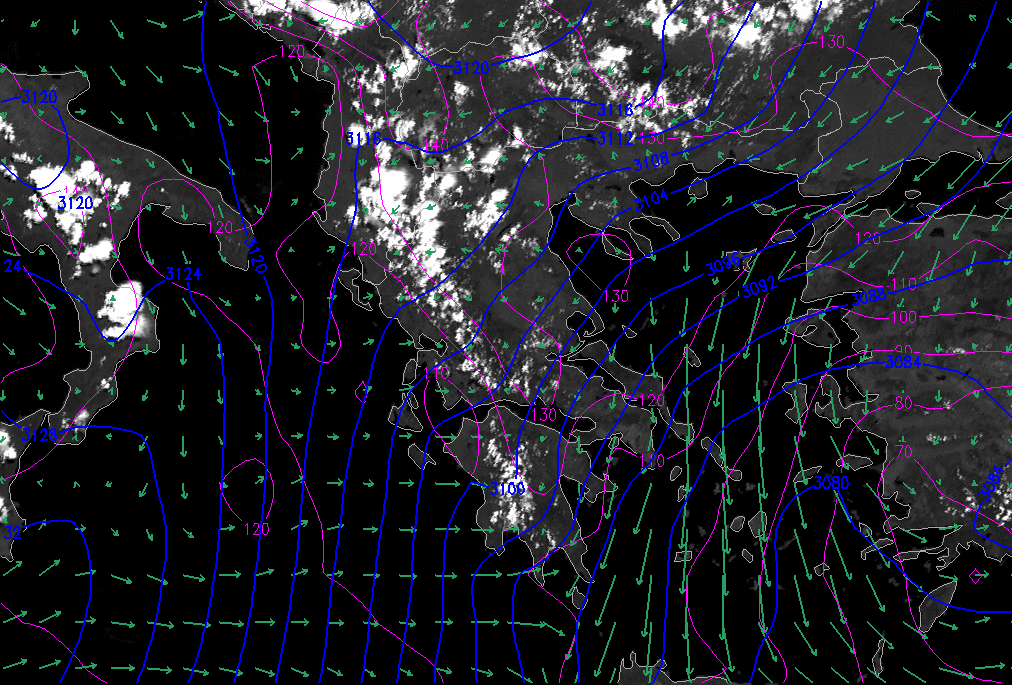
2. The Carpathian Convergence Lines
In case of the Carpathian Convergence Lines, there is no distinct synoptic pattern such as ridge or trough features or even a frontal system.
- Large scale winds show quite a homogeneous flow with mainly northerly and easterly components.
|
|
24 July 2007/12.00 UTC Meteosat 8 HRVIS image; green: wind vectors 1000 hPa (ECMWF analysis)
|
|
|
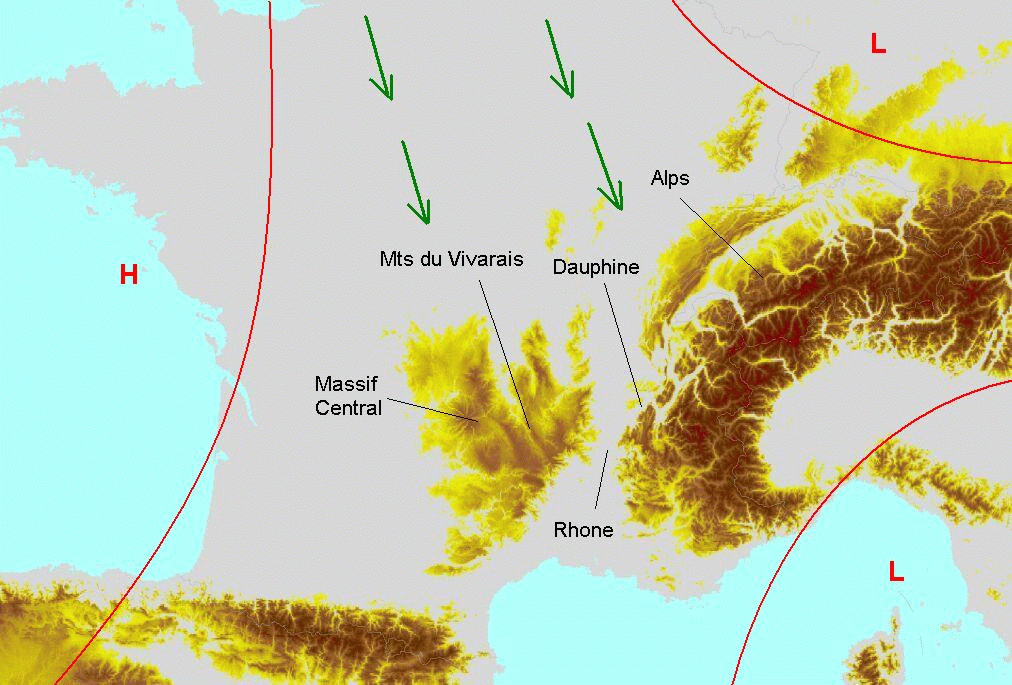
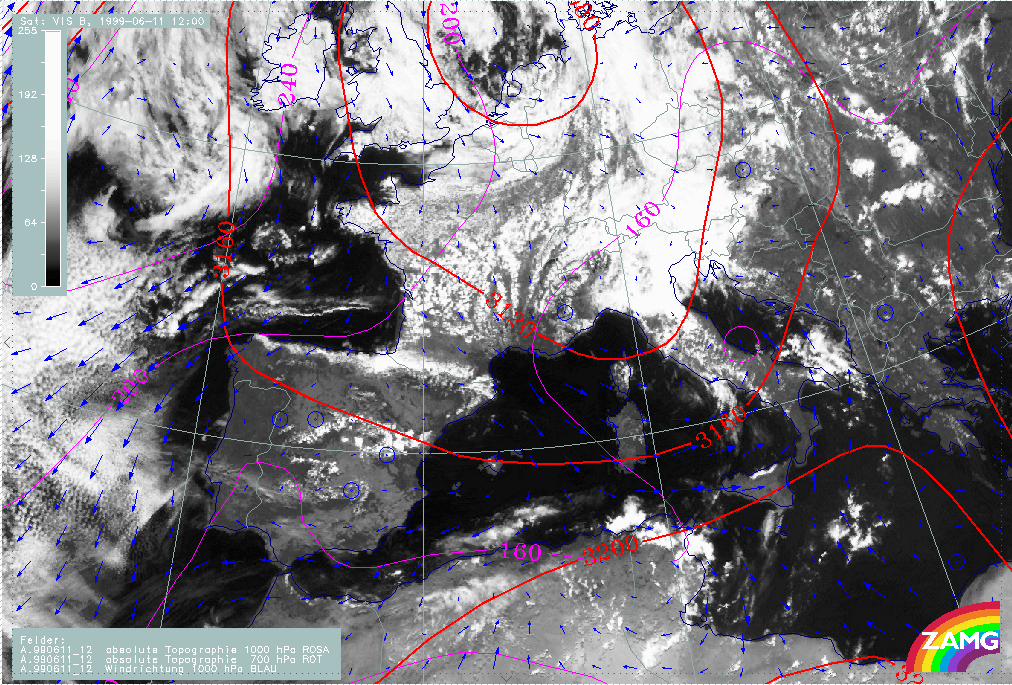
3. Convergence Lines over the French Mountains
- The typical synoptic situation is characterised by a north-westerly upper level flow, a surface low in the Mediterranean near the Gulf of Genoa and high pressure west of the Massif Central (France).
- Situations with a strong north-westerly flow creating a Mistral situation. However, in the case presented here the wind speed is rather low, since the pressure gradients are relatively weak.
|
|
11 June 1999/12.00 UTC - Meteosat 7 VIS image; mangenta: height contours 1000 hPa, red: height contours 700 hPa, blue: wind vectors
1000 hPa
|
|
|
Typical small scale parameters
Wind, convergence and vertical motion data detected in small scale model output show remarkable changes during day. The Greek and the Dinaric Convergence Lines are chosen to show common features. Some additional features are noted for the other Convergence Lines.
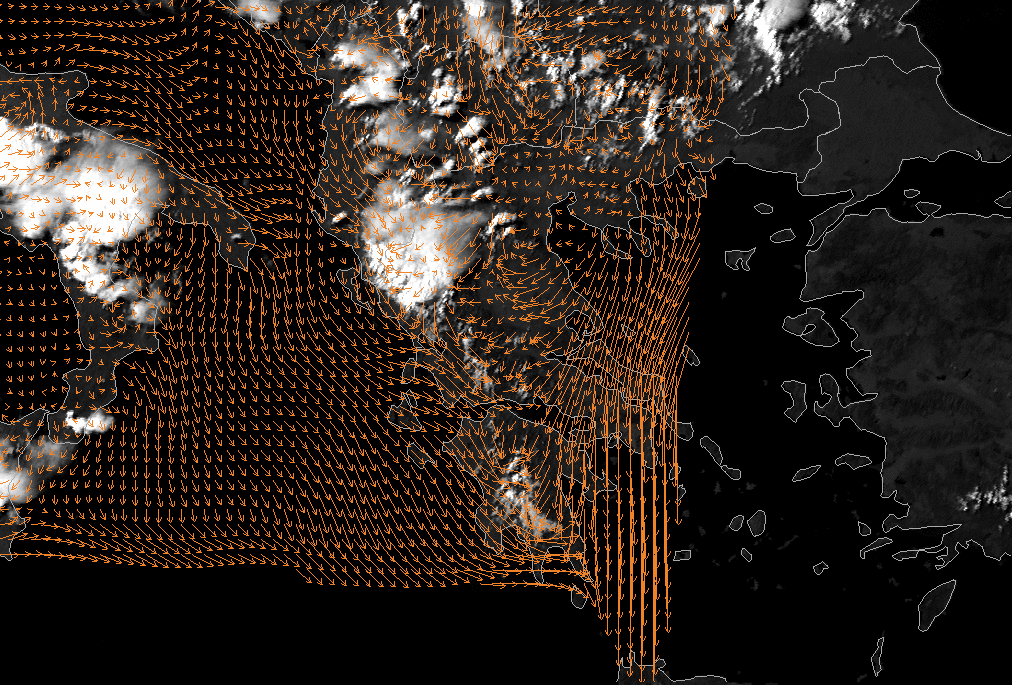
Typical distribution of the wind fields in the morning
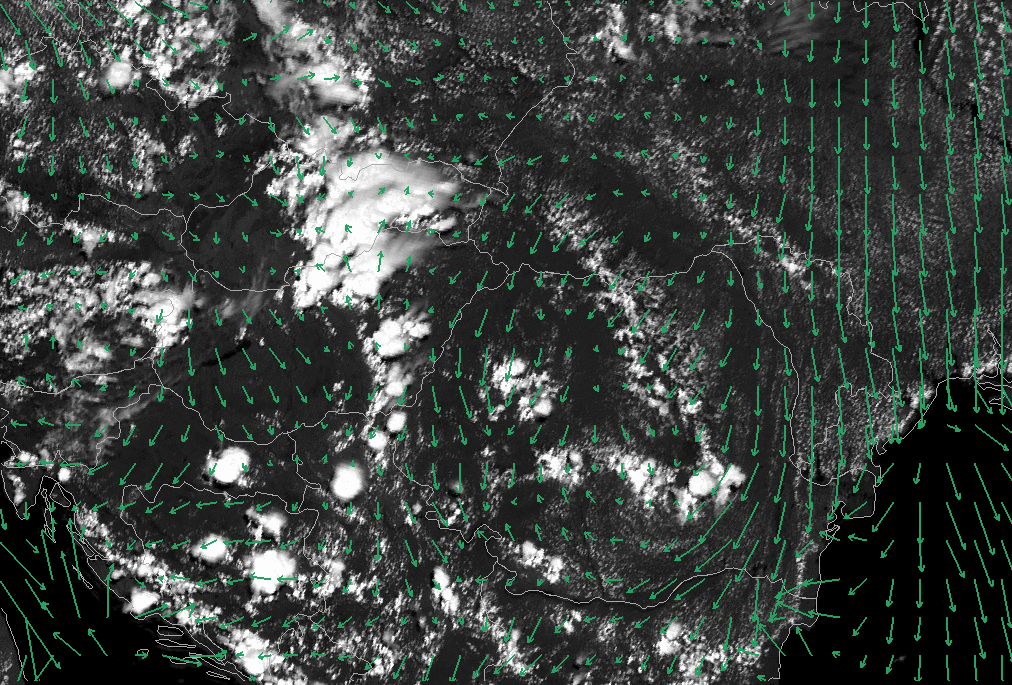
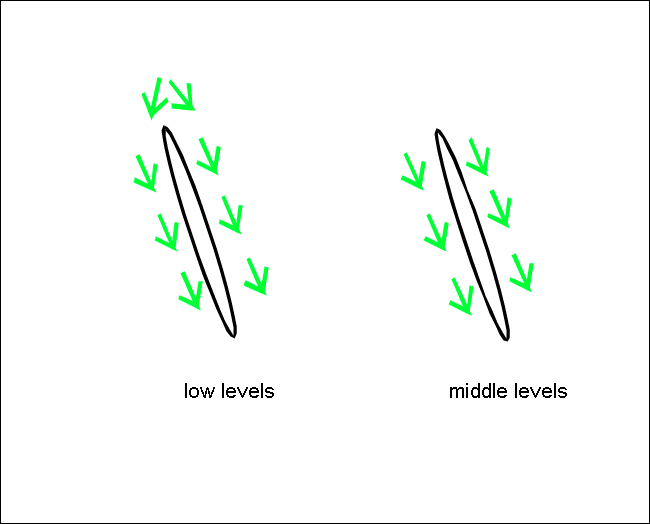
In the morning (06 UTC) divergence (fields not shown here) prevails over the mountain chains whereas convergence occurs at higher levels. The wind fields show a flow around the mountains rather than over them. Orographic effects vanish at 800 hPa where a more or less uniform flow pattern (north-west wind) can be observed.
|
|
24 July 2006/06.00 UTC - Meteosat 8 HRVIS image; wind vectors 925 hPa
|
|
|
|
|
|
24 July 2006/06.00 UTC - Meteosat 8 HRVIS image; wind vectors 700 hPa
|
|
The example shows northerly winds around the mountain chain, with difluence at the northern edge at 925 hPa. Some confluence can be found east of the mountains. At 700 hPa there is mostly northerly to north-westerly flow.
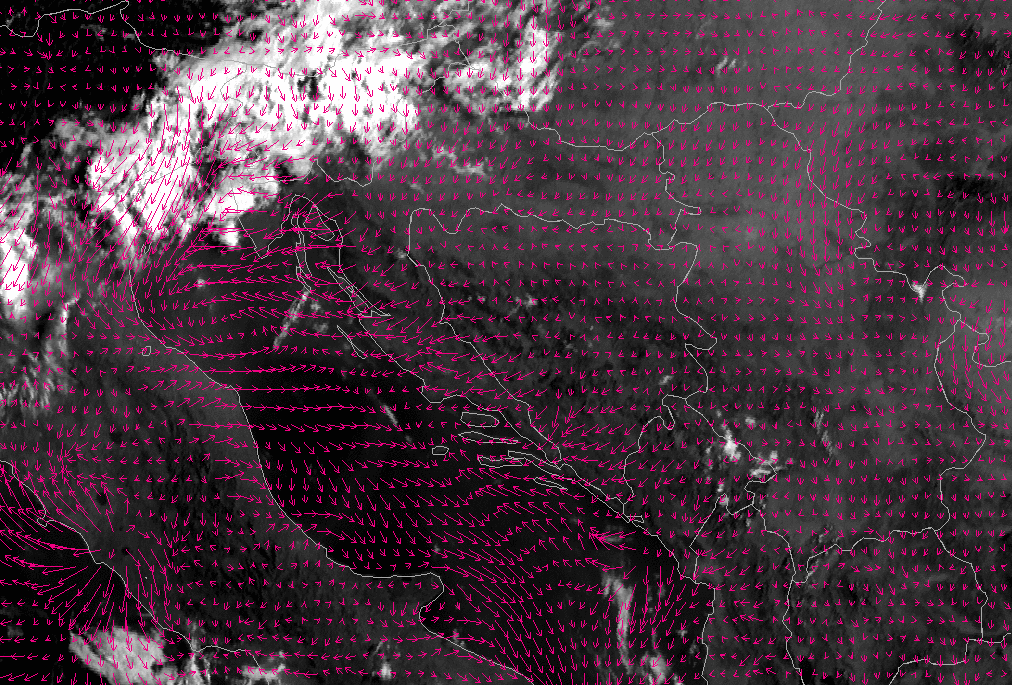
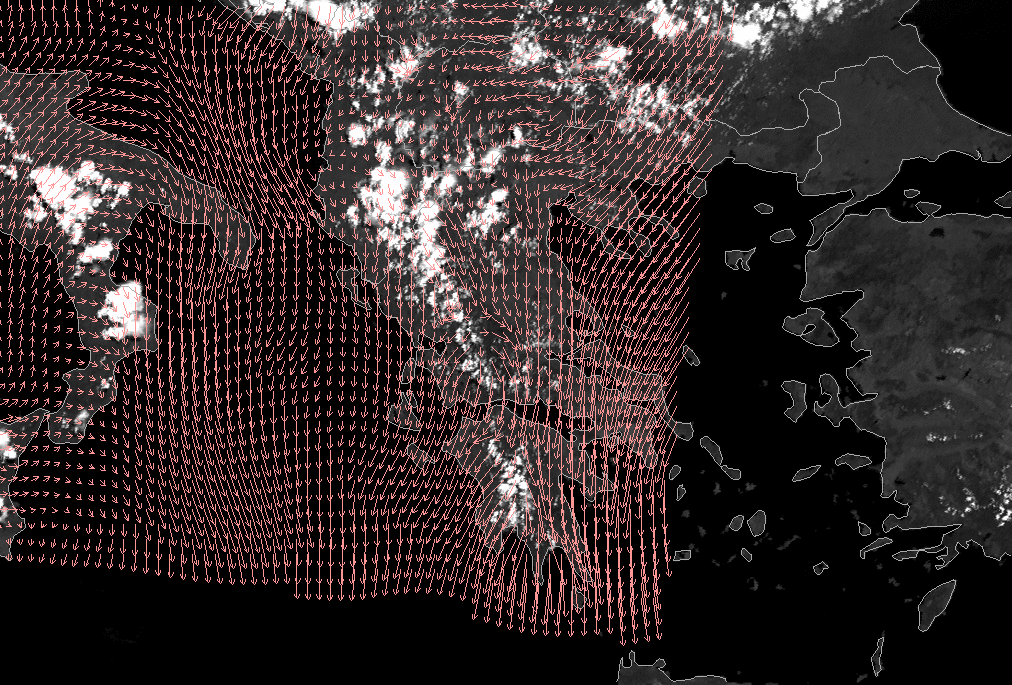
In the example case of the Dinarides the wind in the lower levels is presented by the 10m wind field:
|
24 July 2006/06.00 UTC - Meteosat 8 HRVIS image; 10m wind vectors
|
24 July 2006/06.00 UTC - Meteosat 8 HRVIS image; wind vectors 700 hPa
|
|
|
In the region of the Dinarides there is mostly easterly to south-easterly flow passing over the mountain chain. Upper level flow, represented by the 700 hPa wind is mostly south to south-easterly.
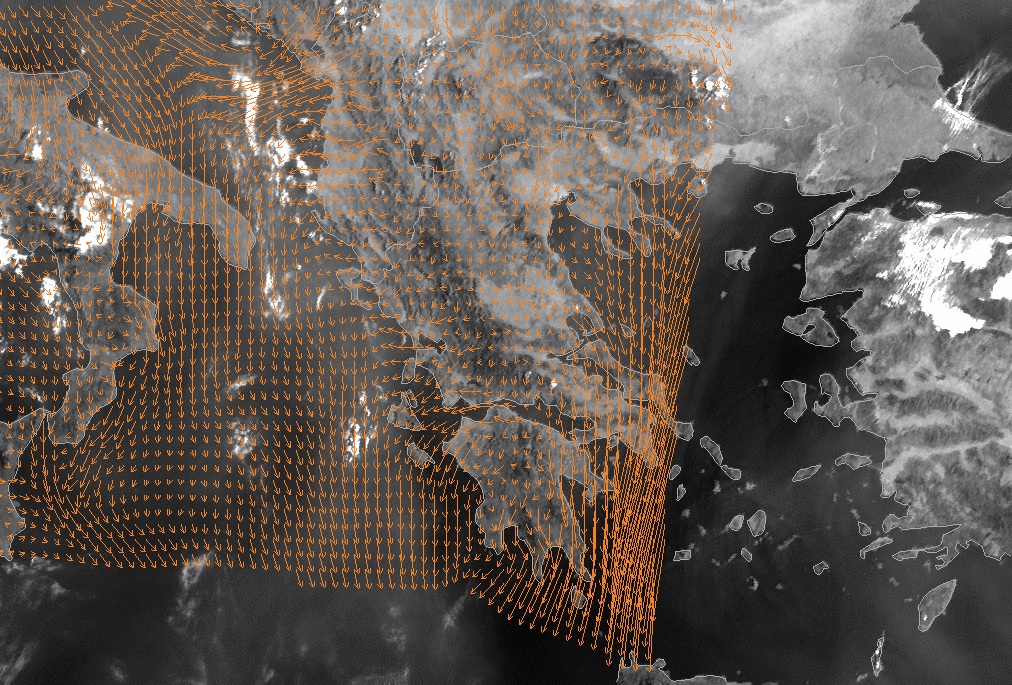
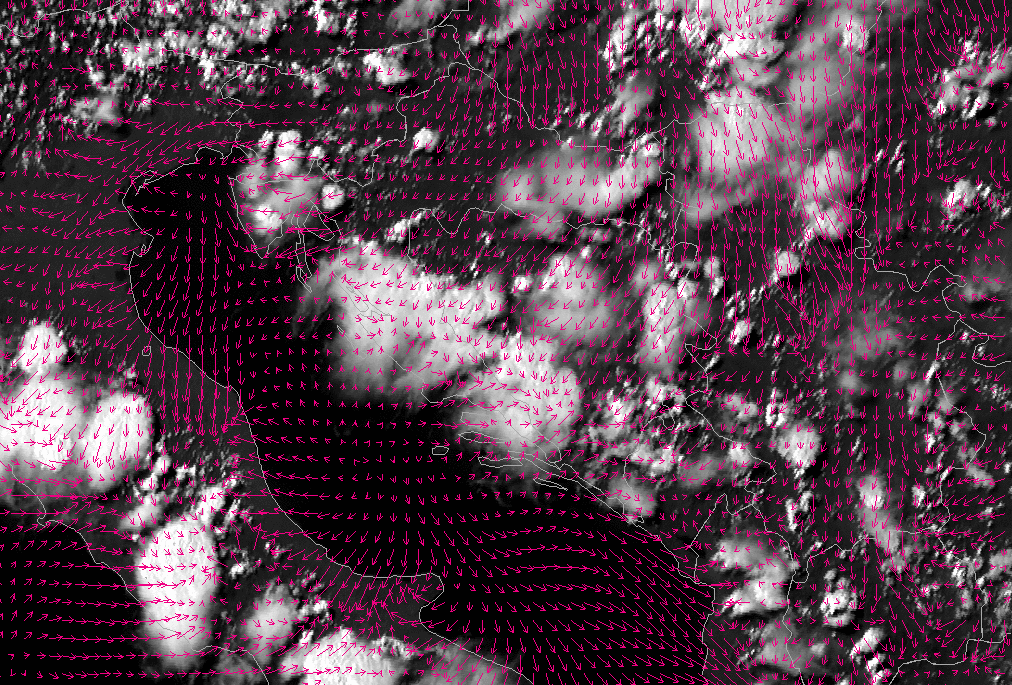
Typical distribution of the wind fields, convergence and vertical motion at noon
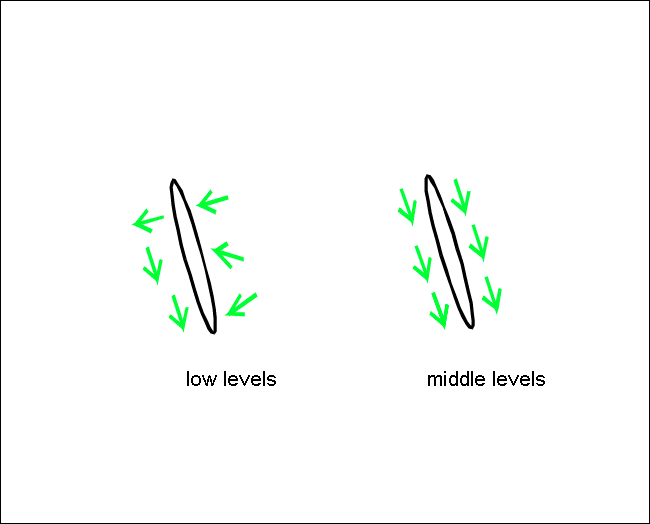
- Wind fields are influenced by orography up to about 700 hPa: There is a confluence at lower levels.
- As a consequence of this wind field, small scale convergence can be observed up to 800 hPa. At the 925 hPa level, the maximum of convergence is shifted to the west (the windward side of the mountain ridge).
- Therefore, the maximum of upward motion can also often be found west of the mountain chain (around 1 degree), in a layer which is somewhat thicker than can be observed for the convergence. Above 700 hPa, there appears to be no upward motion which can be related to convergence cloudiness.
Typical distribution of wind-fields at noon
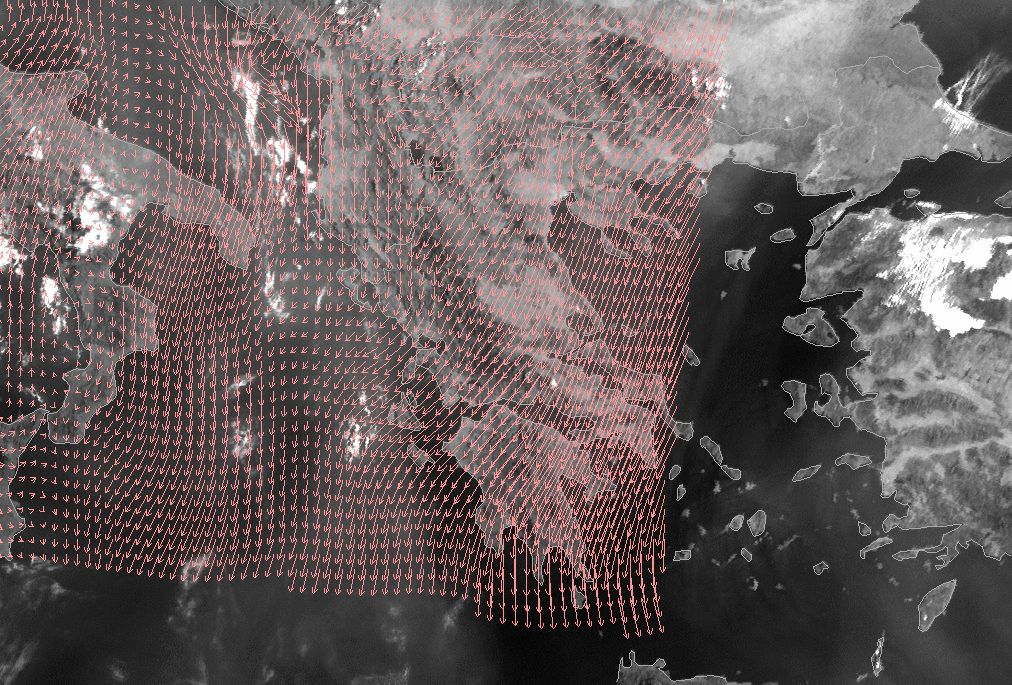
There is general confluence at low levels. At high levels, the wind direction is more or less parallel to the mountain chain, depending on the synoptic situation.
|
24 July 2006/12.00 UTC - Meteosat 8 HRVIS image; wind vectors 925 hPa
|
24 July 2006/12.00 UTC - Meteosat 8 HRVIS image; wind vectors 700 hPa
|
|
|
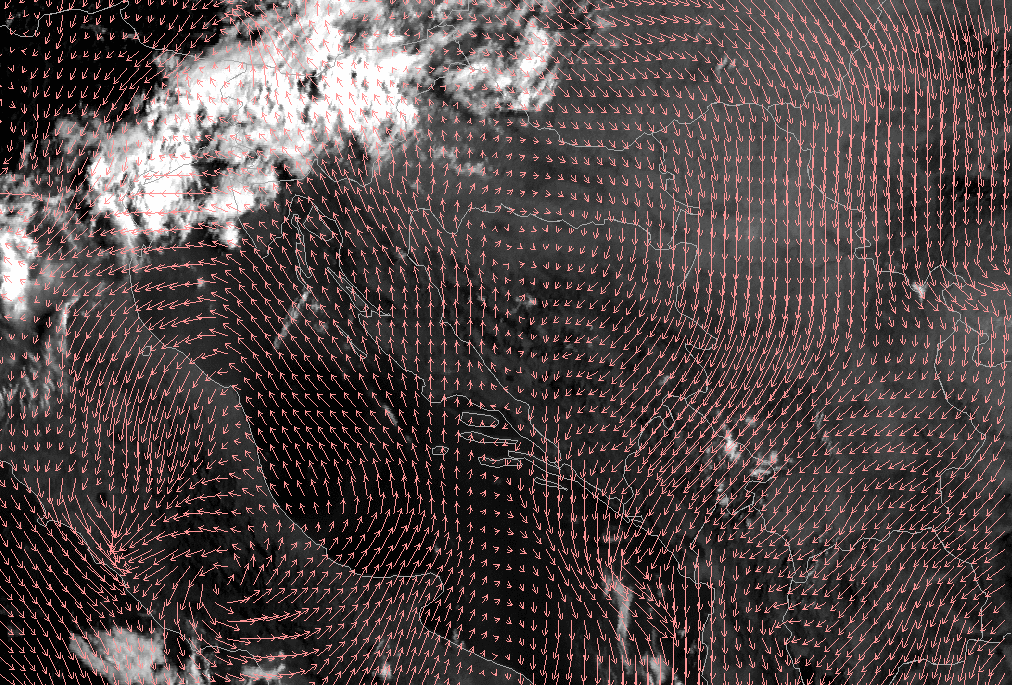
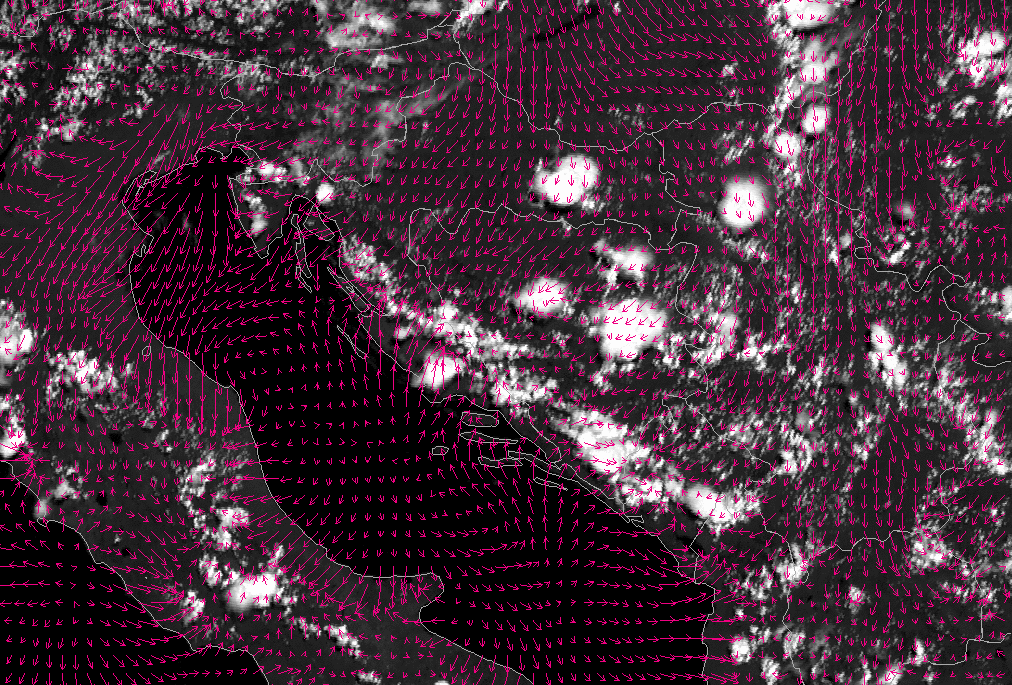
The image shows pronounced confluence around the mountain chain generated by easterly and north-easterly winds in the east and westerly winds in the west. At higher levels, winds are parallel to the mountain chain.
|
|
24 July 2006/12.00 UTC - Meteosat 8 HRVIS image; 10m wind vectors
|
|
|

|
|
|
24 July 2006/12.00 UTC - Meteosat 8 HRVIS image; wind vectors 700 hPa
|
|
Over the Dinarides confluence is seen over the mountain chain, in the region where clouds already start to develop. At 700 hPa there is southerly to south-westerly flow in the western part and nort-easterly flow over the mountains in the eastern part of the Dinarides.
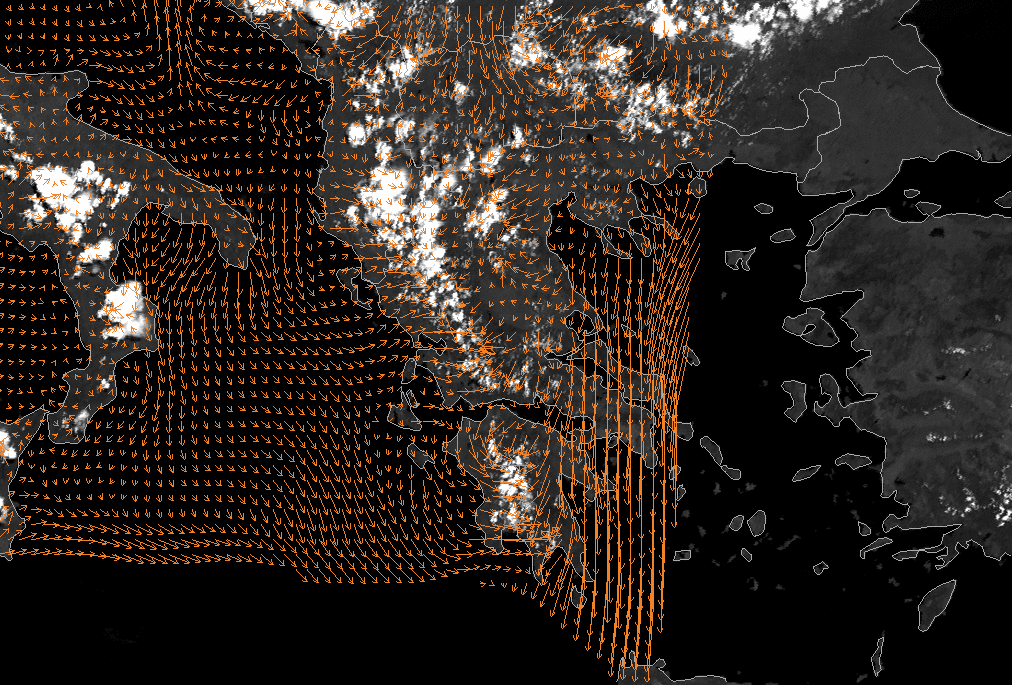
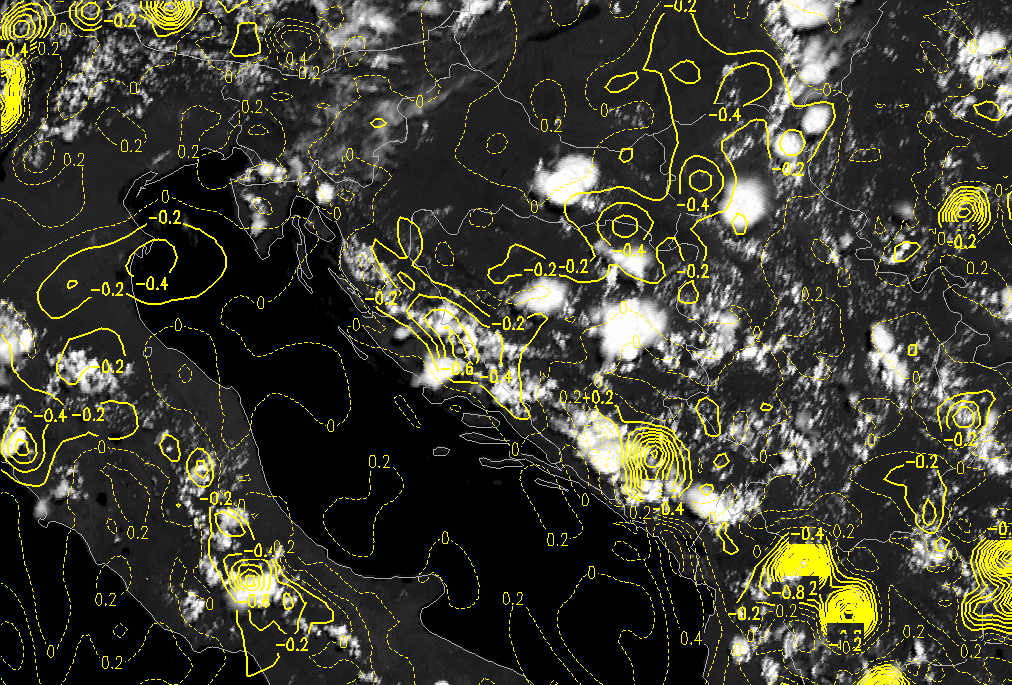
Typical distribution of divergence
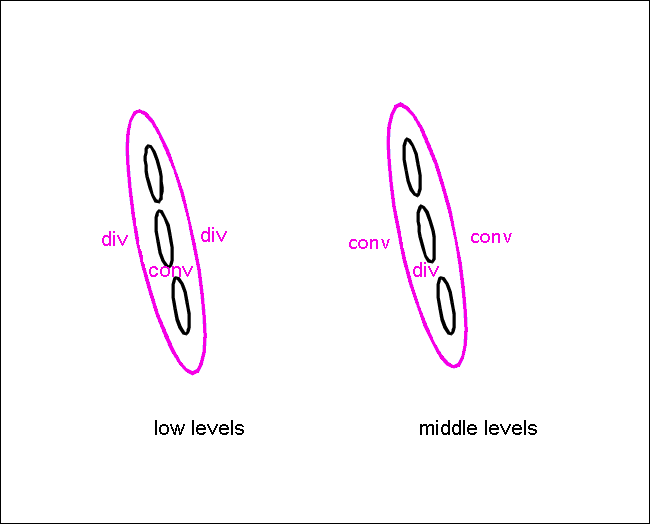
Low level convergence is occurring at the mountain, divergence alongside. The situation at higher levels is reversed.
|
24 July 2006/12.00 UTC - Meteosat 8 HRVIS image; magenta solid: convergence 850 hPa, magenta dashed: divergence 850 hPa
|
24 July 2006/12.00 UTC - Meteosat 8 HRVIS image; magenta solid: convergence 700 hPa, magenta dashed: divergence 700 hPa
|
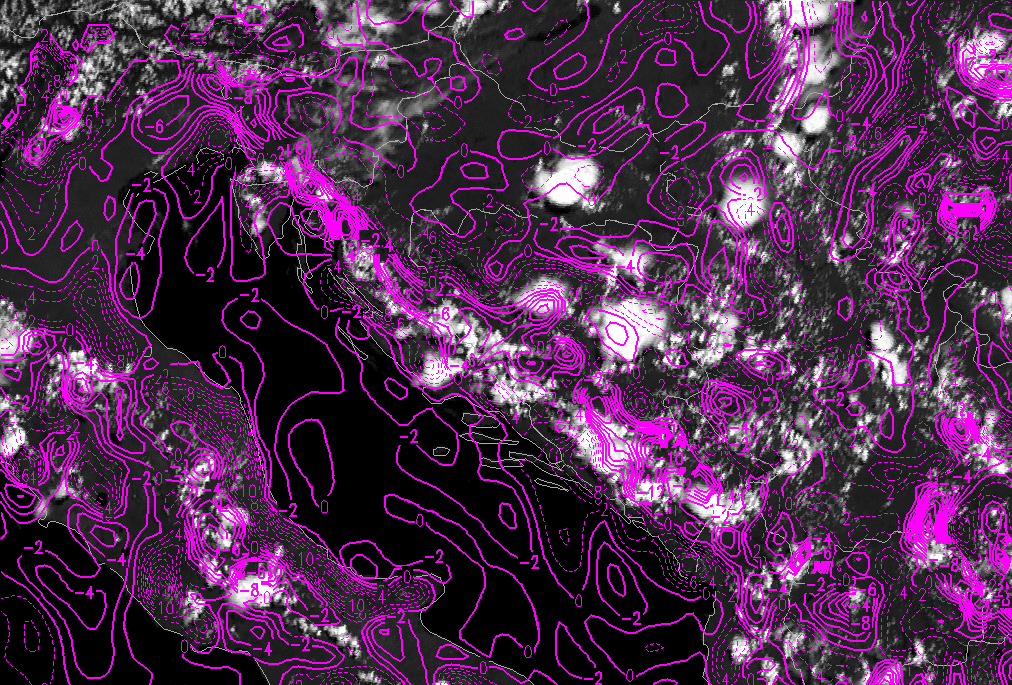
|
|
The clouds of the convective Convergence Line closely follow a narrow zone of convergence (solid lines) at 850 hPa.
At 700 hPa the flow is more divergent over the mountains, specially in the south-eastern part, suggesting that the phenomenon is rather shallow.
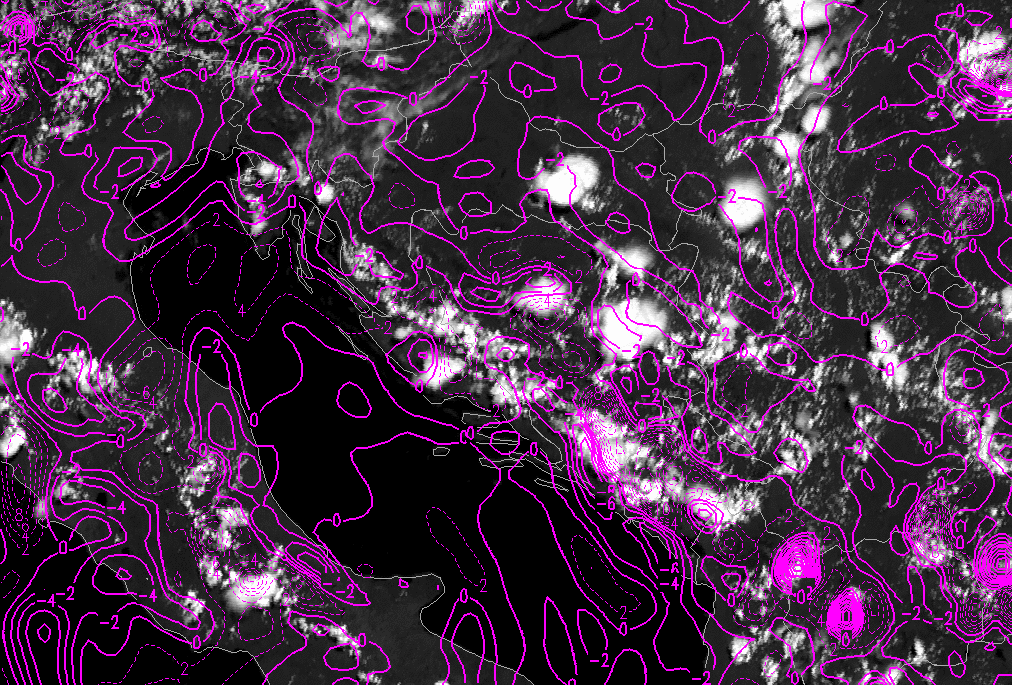
Typical distribution of vertical motion at noon
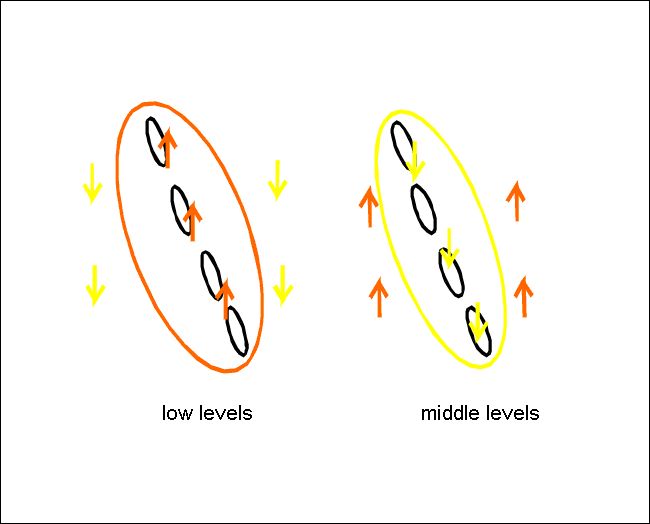
There is low level upward motion occurring at the mountain, downward motion alongside. The situation at higher levels is reversed.
|
24 July 2006/12.00 UTC - Meteosat 8 HRVIS image; yellow solid: vertical motion - upward motion 850 hPa, yellow dashed: vertical
motion - downward motion 850 hPa
|
24 July 2006/12.00 UTC - Meteosat 8 HRVIS image; yellow solid: vertical motion - upward motion 700 hPa, yellow dashed: vertical
motion - downward motion 700 hPa
|
|
|
Both images show upward motion in the region of the mountains. At 925 hPa, the velocities are much higher. At 850 hPa there is still some upward motion, although at this level there is also some areas of divergence (see above).
Typical distribution of wind-fields in the afternoon
In the afternoon (15.00 UTC) the model parameter are getting similar to those at 06.00 UTC, but they still show some remnants of "daytime
features". The convergence zone that developed at noon is starting to decay at this point in time and, consequently, shows a less distinct
pattern.
Wind fields are reverting to a typical night-time non-convergent flow. However, at that point there are still convective cells along the Line,
sometimes even well developed.
|
|
24 July 2006/15.00 UTC - Meteosat 8 HRVIS image; wind vectors 925 hPa
|
|
|
|
|
|
24 July 2006/15.00 UTC - Meteosat 8 HRVIS image; 10m wind vectors
|
|
The noon confluent pattern is disappearing, but there are still convective cells along the Convergence Line.
Additional features apparent in the Carpathian Convergence Lines
- In general, the wind field can be characterised by north-easterly winds east of the Eastern Carpathians which become south-easterly winds at the Southern Carpathians. Therefore, there are components directed towards the mountain ranges. In Transylvania southerly and easterly winds prevail. In addition, the wind field shows a lot of small vortices within this orographic region.
- As a consequence of the wind field, areas of convergence can be found at lower levels. At 925 hPa it is more or less associated with the lines of cloudiness. The Southern Carpathians and the Eastern Carpathians show two separate areas of convergence with a small area of divergence at the "corner".
- In the afternoon and evening, some small areas of convergence still exist, although they are more likely connected with huge convective cells (MCS) which can survive for longer points of time.
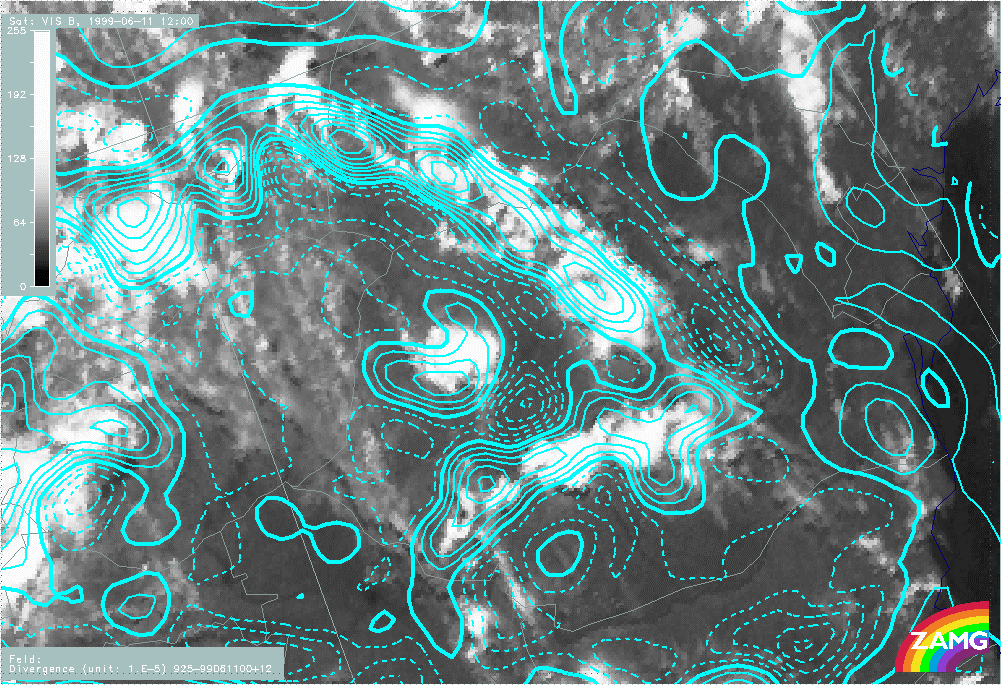
|
11 June 1999/12.00 UTC - Meteosat 7 VIS image; cyan solid: convergence 925 hPa, cyan dashed: divergence 925 hPa
|
|
|
The image shows pronounced orographically induced convergence at 925 hPa. At the transition between the Southern and Eastern Carpathians there is almost no convergence, and even some divergence.
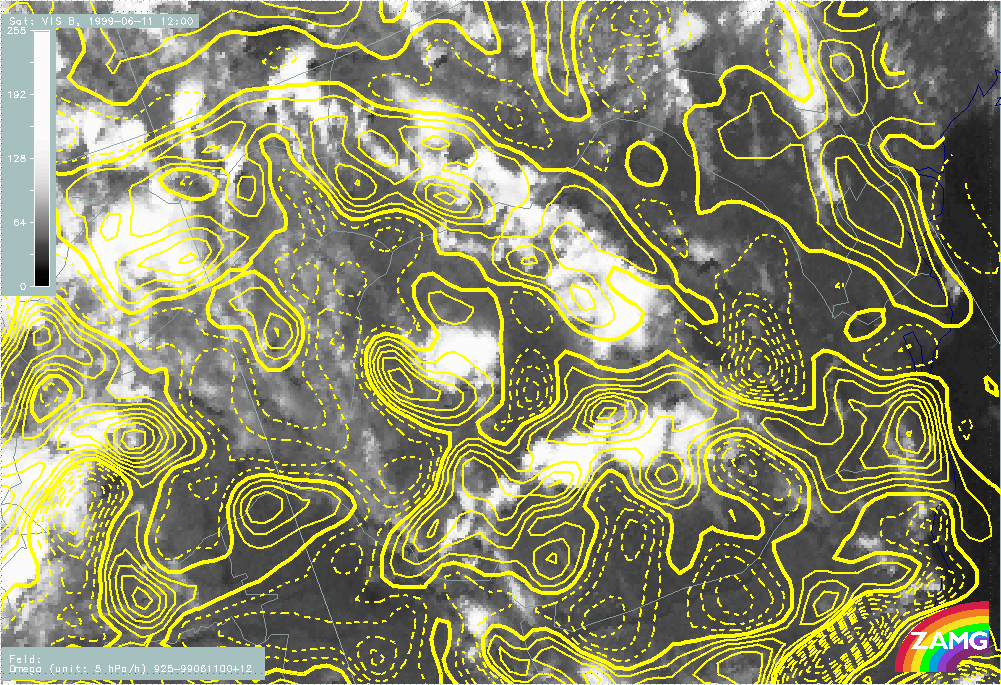
|
11 June 1999/12.00 UTC - Meteosat 7 VIS image; yellow solid: vertical motion - upward motion 925 hPa, yellow dashed: vertical
motion - downward motion 925 hPa
|
|
|
The image shows pronounced upward motion at 925 hPa. At the "corner", downward motion is found, the position of this area is more clearly seen with this parameter than with the field of convergence.
Additional features for the Convergence Lines in the French mountains
- The wind fields show northerly directions becoming northwest and west with height but show distinct confluence at several mountain ridges (Massif Central, Jura mountains, West Alps) leading to upward motion from the surface up to levels of 850/800 hPa.
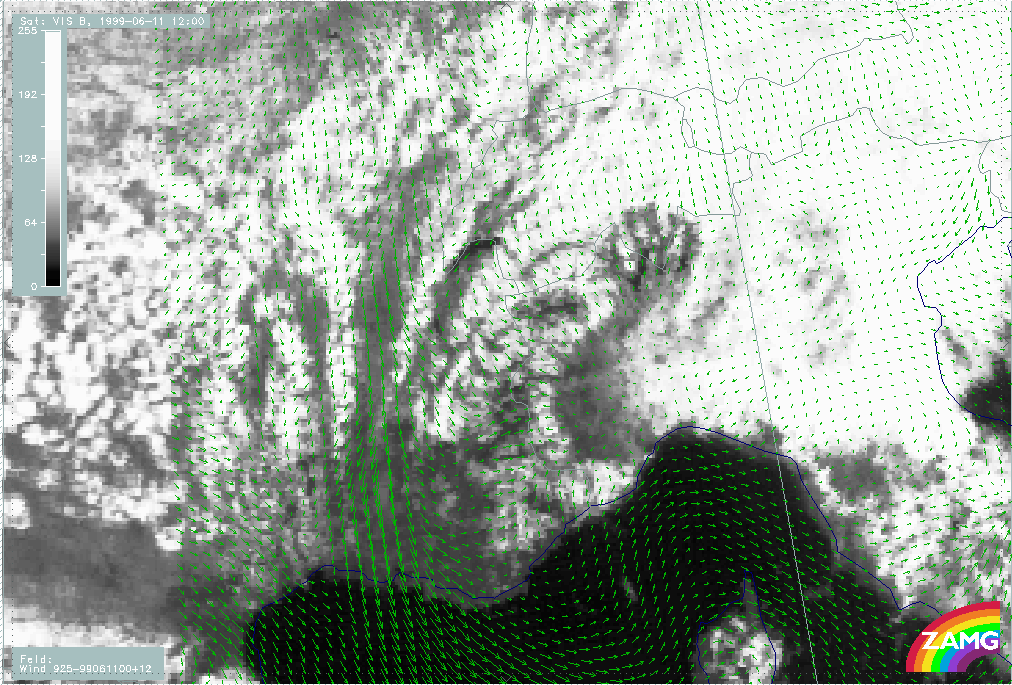
|
11 June 1999/12.00 UTC - Meteosat 7 VIS image; green: wind vectors 925 hPa
|
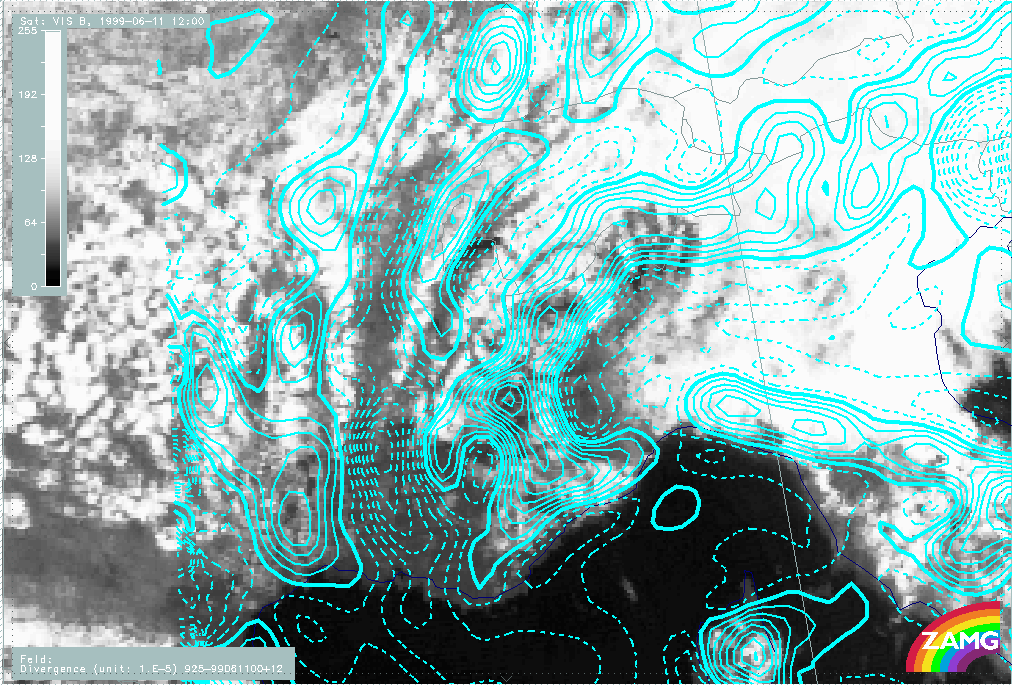
11 June 1999/12.00 UTC - Meteosat 7 VIS image; cyan solid: convergence 925 hPa, cyan dashed: divergence 925 hPa
|
|
|
|
|
|
11 June 1999/12.00 UTC - Meteosat 7 VIS image; yellow solid: vertical motion - upward motion 925 hPa, yellow dashed: vertical
motion - downward motion 925 hPa
|
|
Typical Appearance In Vertical Cross Sections
Two types of vertical cross sections are presented in this chapter: one from the large scale ECMWF model and the other from the meso-scale model Aladin.
Vertical cross-sections from the ECMWF model
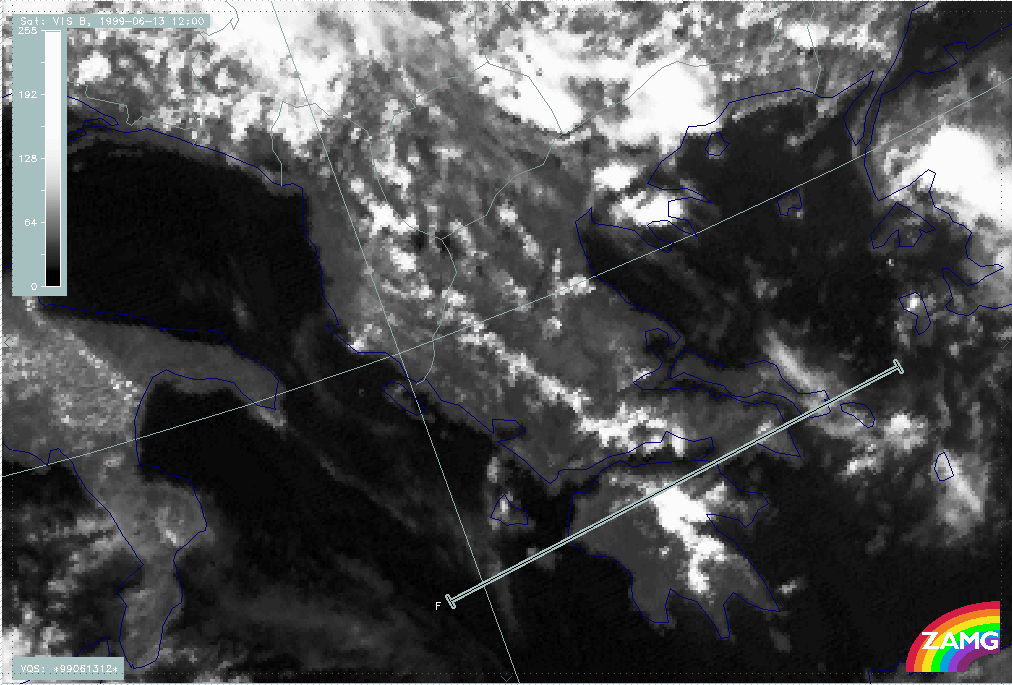
When ECMWF cross-sections are analyzed, it can be noted that some features can be recognised even with the coarse grid of this large area model. The typical parameters are equivalent potential temperature, divergence and upward motion. The ECMWF cross section is laid over a Greek Convergence Line.
|
13 June 1999/12.00 UTC - Meteosat 7 VIS image; position of vertical cross section indicated
|
|
|
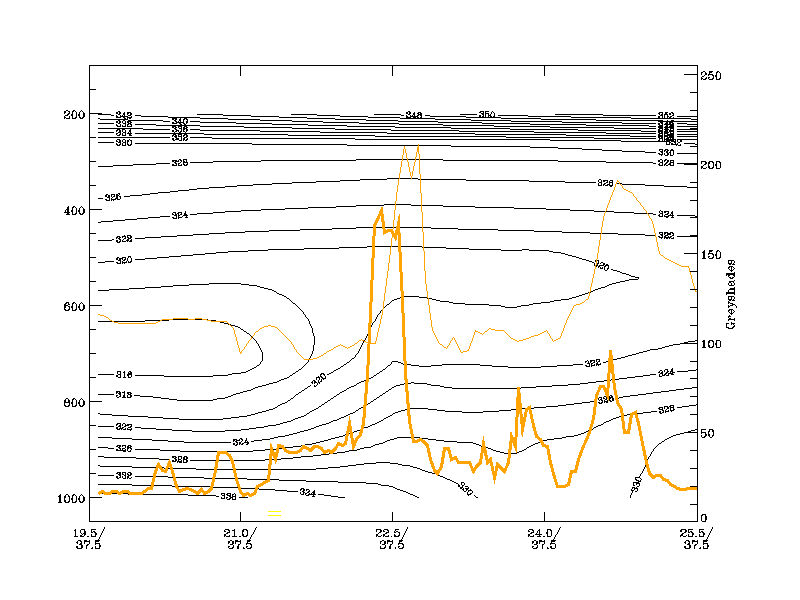
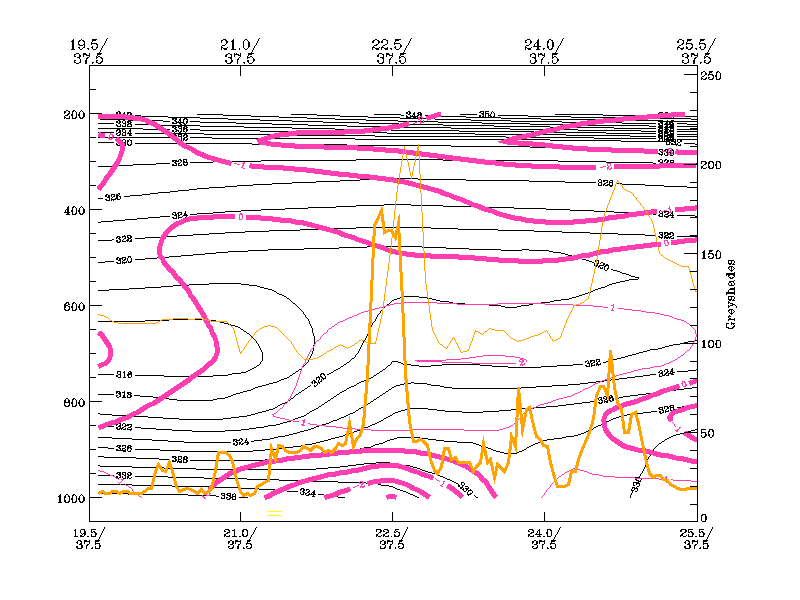
The isentropes show an unstable air mass up to 700 hPa (or even higher) characterised by decreasing values of equivalent potential temperature with height. The difference between the surface and the minimum value can exceed 10 degrees.
|
|
13 June 1999/12.00 UTC - Vertical cross section; black: isentropes (ThetaE), orange thin: IR pixel values, orange thick: VIS pixel
values
|
|
|
The convective line under consideration is accompanied by the pronounced peak, located in the centre of the image at about 22,5E/37,5N. The shift between VIS and IR signals represent the core and the Cirrus shield of the cell. The unstable air mass can be observed from the surface up to 550 hPa in this region.
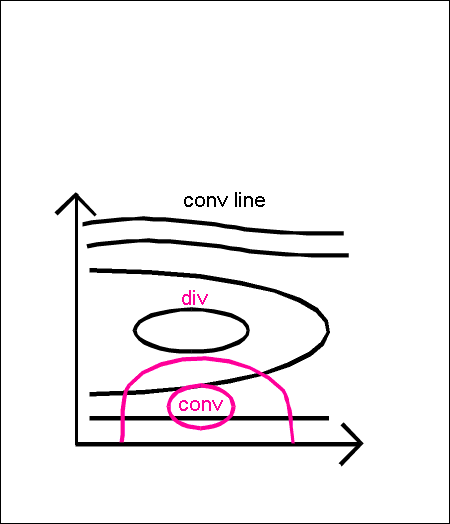
- There is convergence in low layers and divergence above.
|
|
13 June 1999/12.00 UTC - Vertical cross section; black: isentropes (ThetaE), magenta thin: divergence, magenta thick: divergence,
orange thin: IR pixel values, orange thick: VIS pixel values
|
|
|
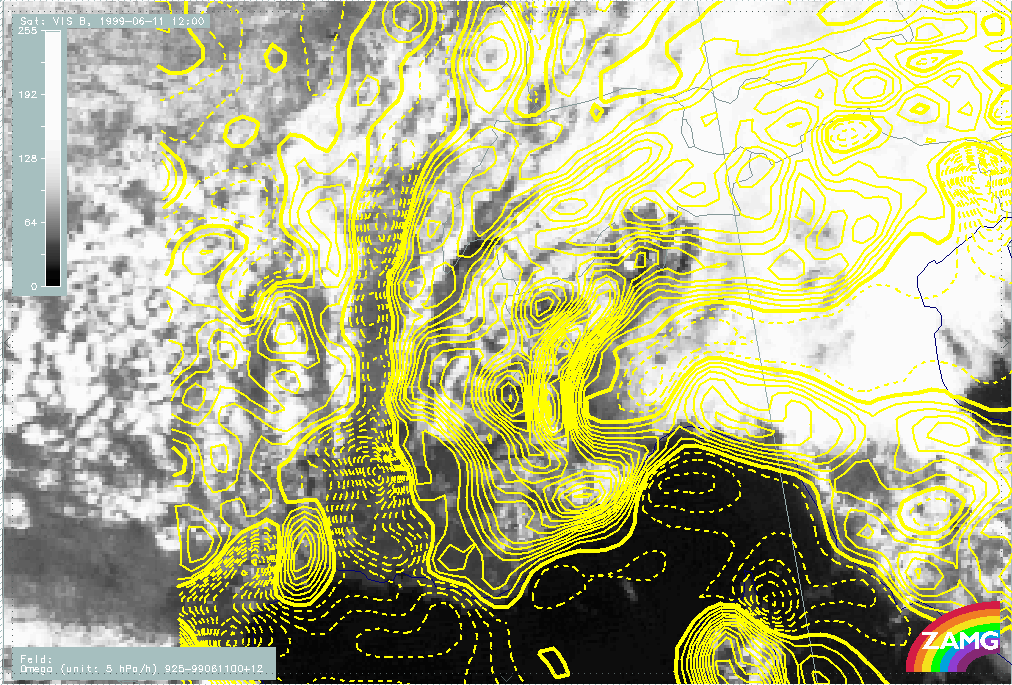
The example shows pronounced convergence up to 900 hPa, above there is divergence.
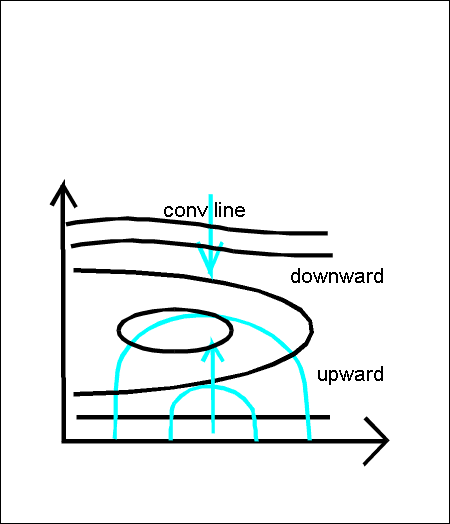
- Upward motion is situated in the convergence lines on top of the convergence zone.
|
|
13 June 1999/12.00 UTC - Vertical cross section; black: isentropes (ThetaE), cyan thick: vertical motion (omega) - upward motion,
cyan thin: vertical motion (omega) - downward motion, orange thin: IR pixel values, orange thick: VIS pixel values
|
|
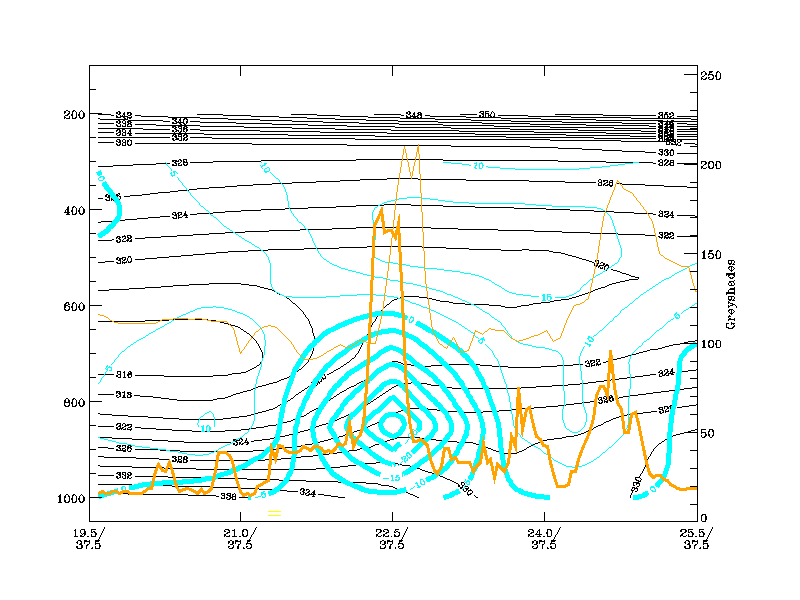
|
Vertical cross-sections from the meso-scale model Aladin
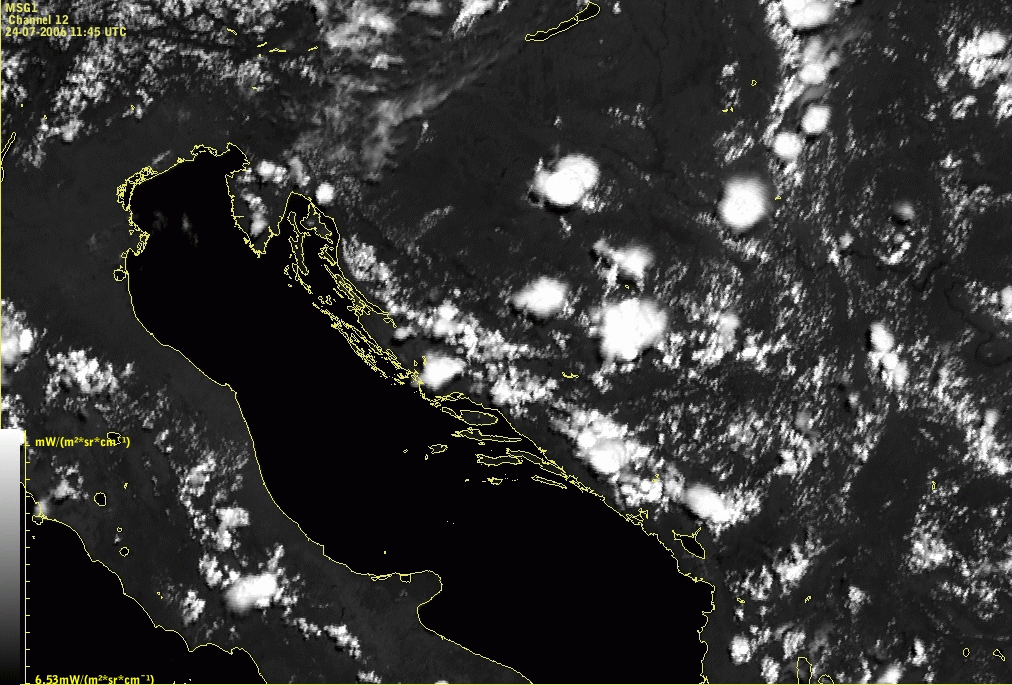
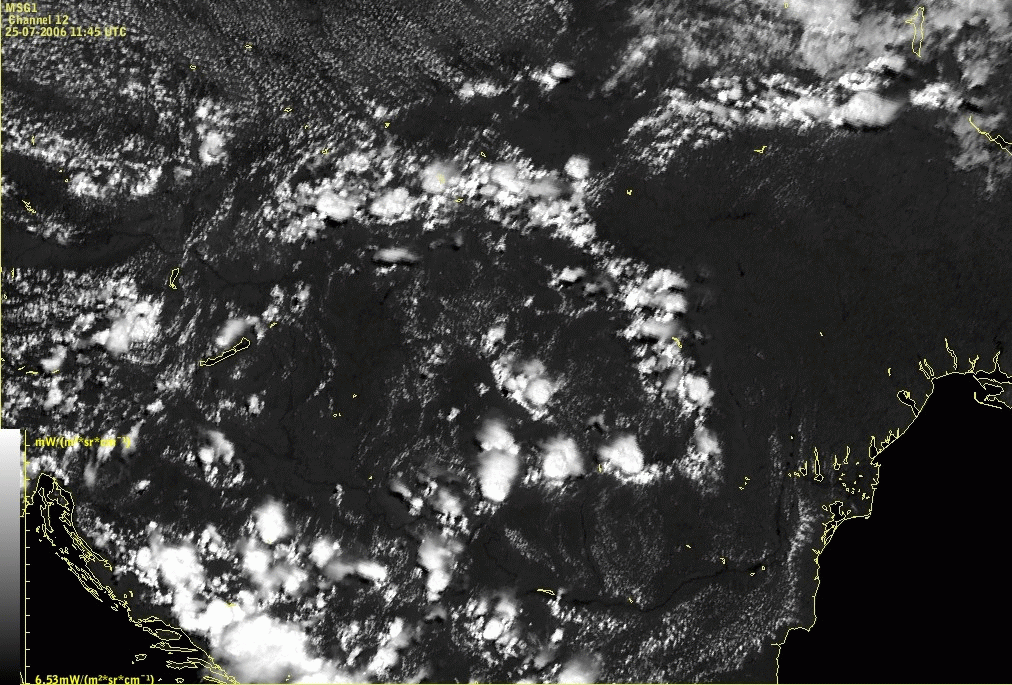
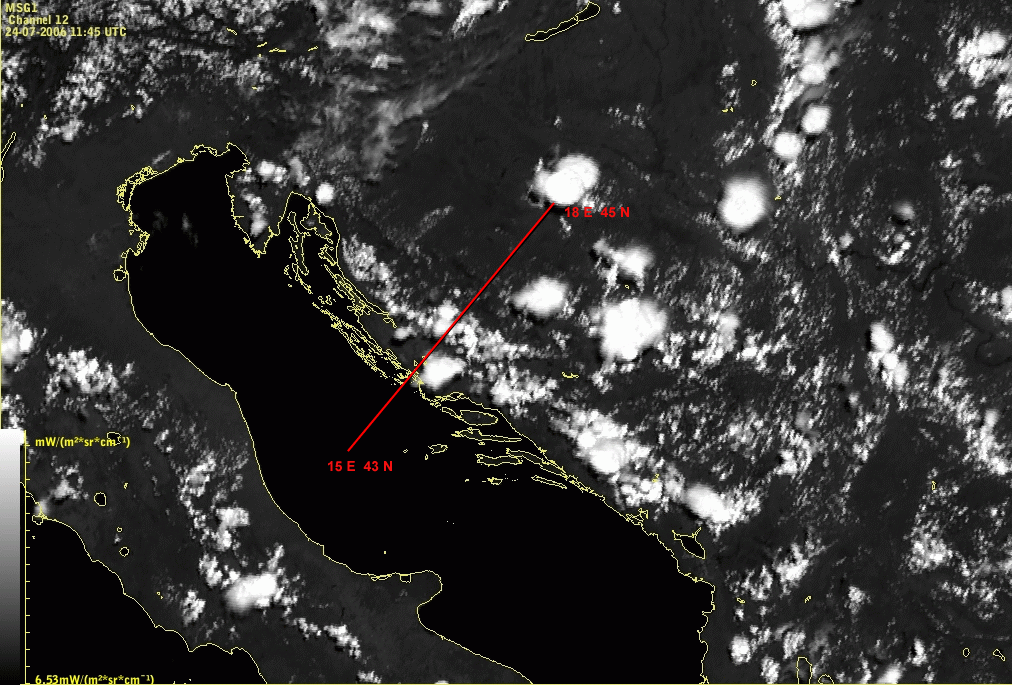
The example cross-section is laid across the Dinaric Alps as shown in the image below.
|
24 July 2006/11.45 UTC - Meteosat 8 HRVIS image; position of vertical cross section indicated
|
|
|
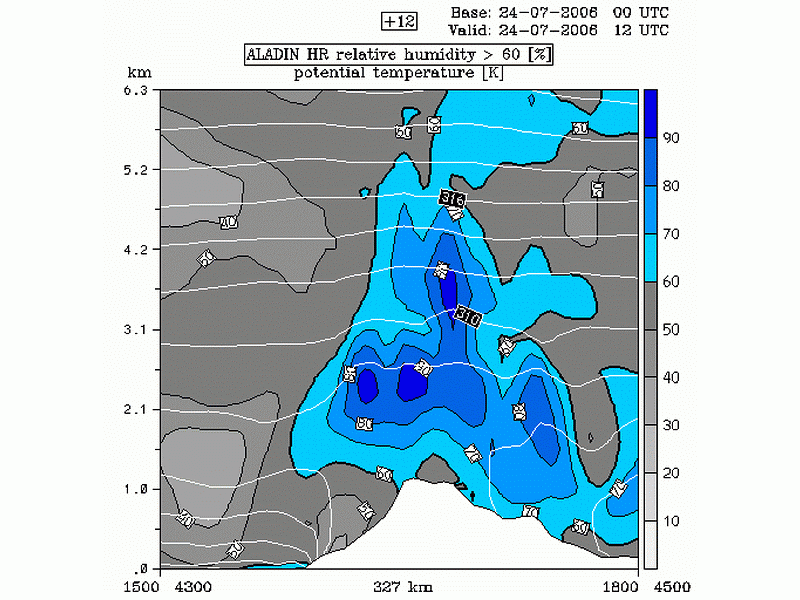
- Highest values of relative humidity are found above the mountain chain, representing the clouds forming there.
- The isentropes show an unstable air mass up to 2.5 km height in the region above the mountains
|
24 July 2006/12.00 UTC - Vertical cross section; grey: relative humidity <60%; blue: relative humidity >60%; white: potential
temperature (isentropes)
|
|
|
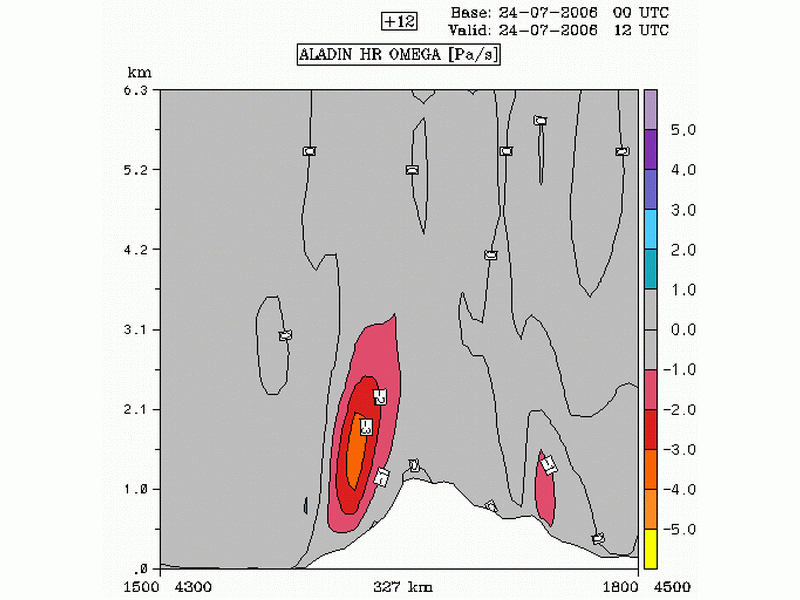
- Upward motion occurs above the slopes of the mountains.
|
24 July 2006/12.00 UTC - Vertical cross section; red: omega <0 (upward motion)
|
|
|
Vertical velocity field shows that there is upward motion in the first 3 km above the ground, slightly on the seaward side of the mountain.
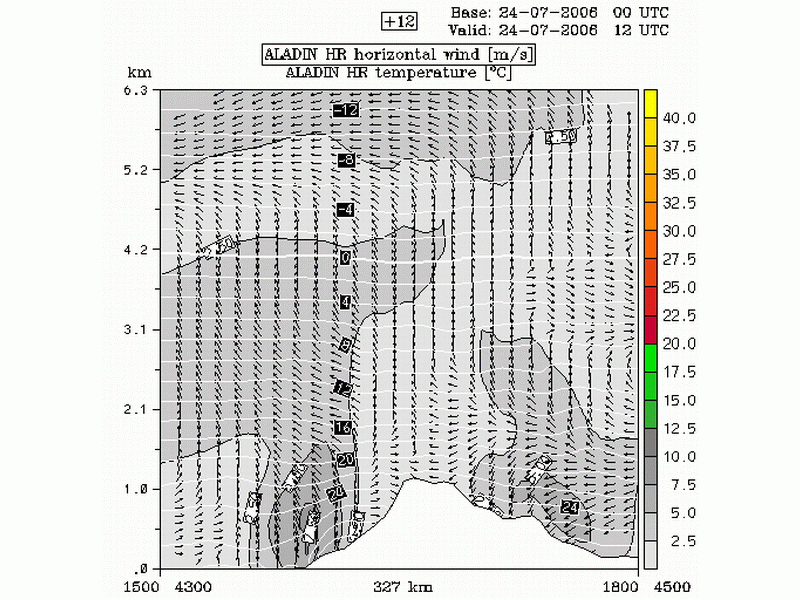
- Convergence of the wind in the lower layers above the mountain chain
|
24 July 2006/12.00 UTC - Vertical cross section; wind vectors; grey: wind speed; white: isotherms
|
|
|
The wind field shows convergence of the wind taking place in the lower 2 km.
Radio Sonde data
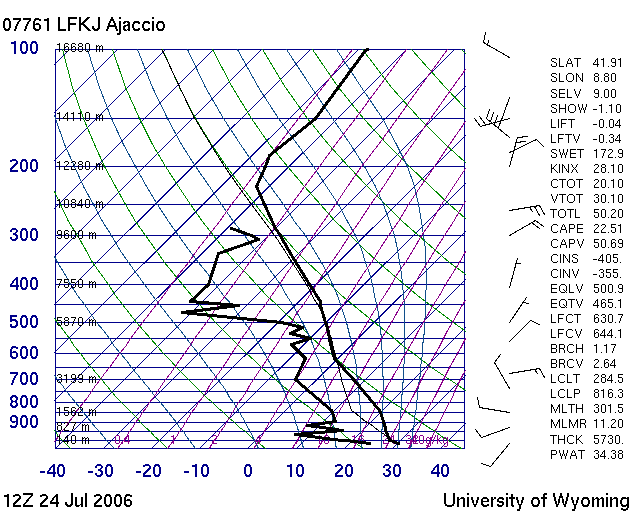
Another way to investigate the vertical structure of the atmosphere in the region of the convergence induced by orographic influence is the analysis of the radiosonde measurement, presented by Skew T diagram.
A Skew T diagram is a plot of temperature with height as denoted by pressure. The pressure lines are plotted horizontally and are on an inverse log scale. The concept of Skew T means that the temperature is not plotted vertically but angles off to the right at a 45 degree angle. The green curved lines are called dry adiabats. The blue curved lines are saturation adiabats. The sounding is plotted as two black lines. The right line is the temperature profile and the left line is the dewpoint profile. The thin black line (behind the temperature line) is the parcel temperature. The winds are plotted as wind barbs with height on the right edge of the plot.
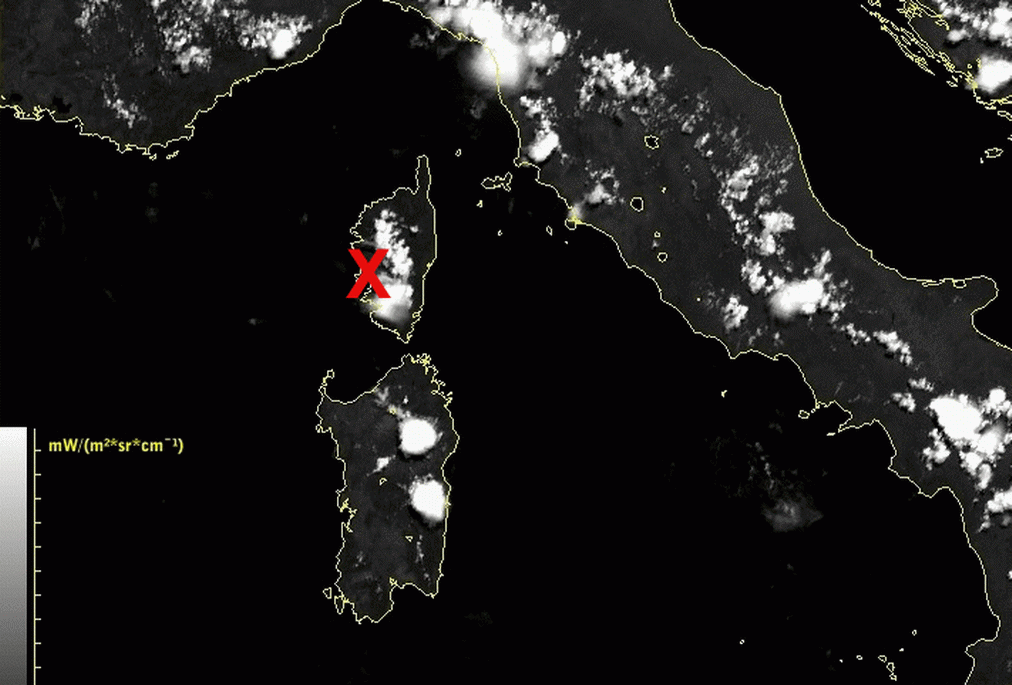
The example shown here is from the radiosonde station in Ajaccio.
|
24 July 2006/11.45 UTC - Meteosat 8 HRVIS image; position of Ajaccio station indicated
|
24 July 2006/12.00 UTC - Skew T diagram of the radio sonde measurement in Ajaccio
|
|
|
What is seen in this Skew T plot is that the atmosphere above the Ajaccio station was not very unstable, although some of the stability parameters, such as Showalter index and K index, indicate instability. If the parcel temperature is looked at it can be seen that a parcel in given conditions is cooler than the surrounding air or, in other words, rather stable. Since Ajaccio is not placed at the mountain top, but very low (at the altitude of just 9 m) the effect of the mountain is not visible. In other words, this diagram represents the conditions of the air surrounding the mountain, but not at the mountain itself. The fact that the air was rather stable corresponds to the theoretical background of the Convergence Lines which actually develop in generally stable air and the formation of the clouds is caused by the convergence produced by diabatic heating of the mountain slopes.
Weather Events
Since the nature of the clouds in the Convergence Line is convective, it is clear that also the corresponding weather events are similar to the ones connected to other types of convective events.
This conceptual model can be used to detect "small" showers, which do not result in large areas of heavy precipitation, but can result in localised heavy precipitation in the mountains. Thunderstorms can also appear in cases with more developed single cells.
| Parameter | Description |
| Precipitation |
|
| Temperature |
|
| Wind (incl. gusts) |
|
| Other relevant information |
|
|
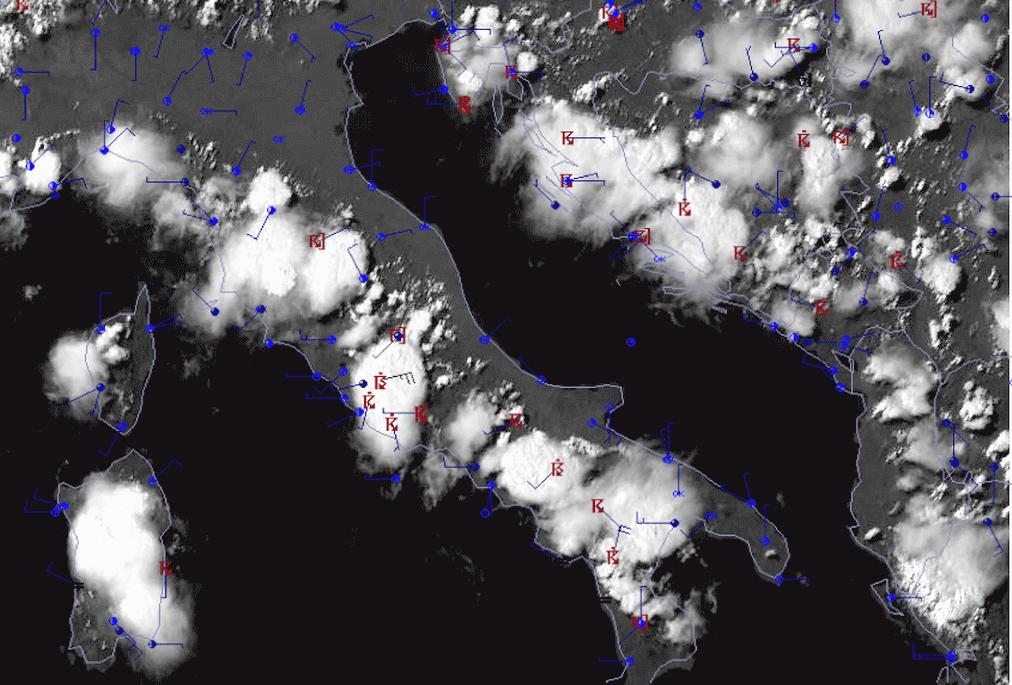
24 July 2006/12.00 UTC - Meteosat 8 HRVIS image; actual weather from synop measurements
|
|
|
|
|
|
|
24 July 2006/15.00 UTC - Meteosat 8 HRVIS image; actual weather from synop measurements
|
Weather events on 24 July 2006 at 12.00 and 15.00 UTC clearly show the development of showers and thunderstorms along the mountain chains over Italy and Dinaric Alps.
References
- WEIGEL, A. P., CHOW, F. K., ROTACH, M. W., STREET, R. L. and XUE, M. (2006): High-Resolution Large-Eddy Simulations of Flow in a Steep Alpine Valley. Part II: Flow Structure and Heat Budgets. J. Appl. Meteorol. Climatol. 45, 87-107.
- WHITEMAN, C. D. (1982): Breakup of temperature inversions in deep mountain valleys. Part I: Observations. J. Appl. Meteorol., 21, 270-289.
- WHITEMAN, C. D. (2000): Mountain meteorology - Fundamentals and applications, Oxford University Press, 355 pp.