Table of Contents
Cloud Structure In Satellite Images
- Coastal Convergence clouds generally appear as of elongated, relatively narrow cloud lines or bands oriented approximately parallel to the coastline.
- Cloud lines can be located either slightly offshore or onshore depending on the wind flow across the coastline.
- Cloud lines are mostly convective in nature, with individual cells often travelling along the coast with the gradient wind, but the whole cloud band appears quasi-stationary for a relatively long period of time.
- The enhancement of cloudiness by Coastal Convergence may at times be difficult to detect if embedded in larger-scale frontal cloud systems.
|
|
|
|
|
|
30 July 2007/18.00 UTC - Meteosat 9 IR10.8 image; 30/18.00 UTC - 31/03.00 UTC hourly image loop
|
30 July 2007/21.00 UTC - Meteosat 9 IR10.8 image
|
|
|
|
|
|
31 July 2007/00.00 UTC - Meteosat 9 IR10.8 image
|
31 July 2007/03.00 UTC - Meteosat 9 IR10.8 image
|
The IR images above show a case of Coastal Convergence along the coast of Poland, Kaliningrad and Lithuania. The cloud band is clearly parallel to the coastline. During the night between 30 and 31 July 2007 the cloud band remains almost stationary, but individual cells can be seen moving within the cloud band from west-southwest to east-northeast. The cells are characterized by higher pixel values indicating higher (cold) cloud tops.
Meteorological Physical Background
The IR images above show a case of Coastal Convergence along the coast of Poland, Kaliningrad and Lithuania. The cloud band is clearly parallel to the coastline. During the night between 30 and 31 July 2007 the cloud band remains almost stationary, but individual cells can be seen moving within the cloud band from west-southwest to east-northeast. The cells are characterized by higher pixel values indicating higher (cold) cloud tops.
Physical background
Modification of the wind due to friction near the surface produces an ageostrophic component of the wind towards lower pressure. This is a direct result of the three-way balance between the pressure gradient force, the Coriolis force and the viscous force. Generally this can be seen as backing of the wind in boundary layer.
The image above shows the ideal hodograph representing the well-known Ekman spiral. The wind profile is generally unstable for a neutrally buoyant atmosphere. The secondary circulations which develop as a result of this instability tend to flatten the above-shown hodograph, that is, to decrease the ageostrophic component. However, a distinct ageostrophic component of the wind (v/ug) still remains in the boundary layer. The velocity of this ageostrophic component depends on the roughness of the underlying surface. Over land the roughness length z0 is in the order of few centimeters while for sea surface z0 is only a few millimeters. Due to this the wind backs more over land than over sea.
Friction not only causes the wind to back but also slows down the air flow in the boundary layer. Wind blowing from sea to land is decelerated, while the opposite is true for wind blowing offshore. The adjustment of wind speed to changes in surface roughness is a much faster process than the adjustment of wind direction. Typically, a geostrophic wind having a speed of 10 m/s is adjusts itself at 20 km distance from coast. By contrast, wind direction is adjusted much slower, length scale typically being on the order of 500 km.
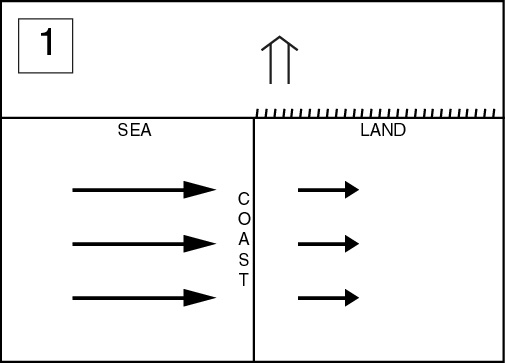
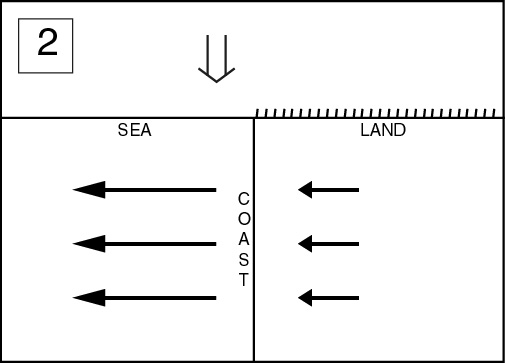
The differences in both the speed and direction of wind across the coast lead to small-scale convergent and divergent areas and associated vertical motions. The locations of convergence-divergence driven vertical motions naturally depend on the orientation of the coastline with respect to the flow. The basic types of frictional convergence can be described schematically as follows:
|
Direct onshore flow deceleration at coast
|
Direct offshore flow acceleration at coast
|
|
|
|
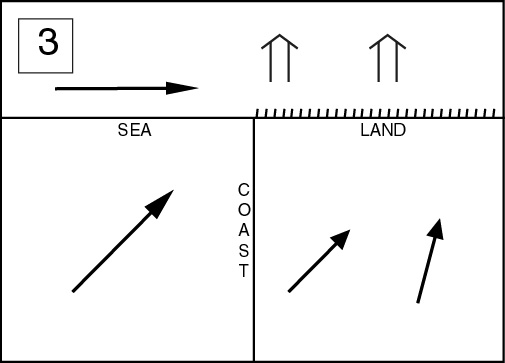
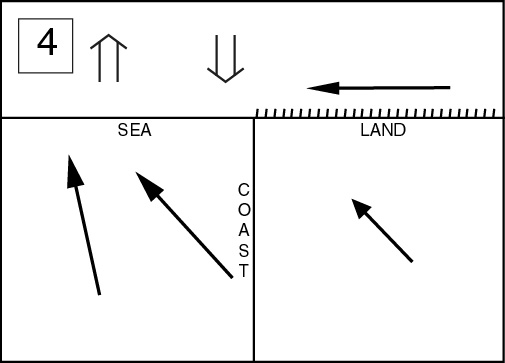
Onshore deceleration and increased backing of the wind over land
|
Offshore acceleration and decreased backing of the wind over sea
|
|
|
|
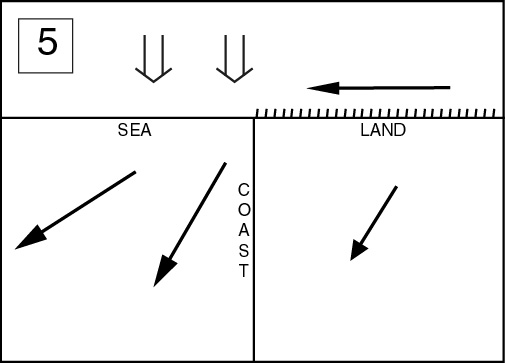
Offshore acceleration and decreased backing of the wind over sea
|
Onshore flow and increased backing of the wind over land
|
|
|
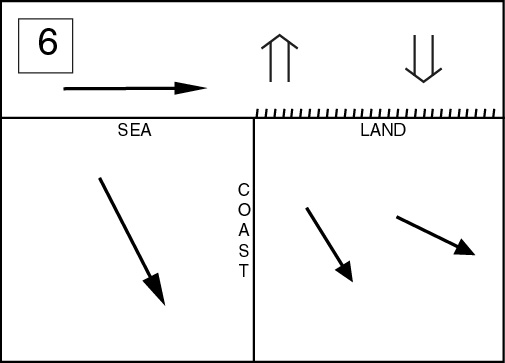
Simplified diagrams of frictional effects on flow at coast (black thin arrows) and resulting convergence-driven vertical motions (open thick arrows). Diagrams 3-6 are adapted from Roeloffzen et al. (1986).
The diagrams 1 and 2 shown in the upper row represent a flow blowing over coast at an acute angle. This will result in convergence for onshore wind and divergence for offshore wind. The convergence or divergence patterns induce ascending or descending motions, respectively.
|
18 November 2006/18.00 UTC - Meteosat 9 IR10.8 image; magenta: divergence 1000 hPa, blue arrows: 10-metre-wind streamlines
|
|
|
Convergence caused by the wind blowing across the coastline is seen on the French and British western coasts. Respectively low-level divergence is seen at the regions where offshore wind is observed (on French coast and particularly on east coast of Britain).
|
18 November 2006/18.00 UTC - Meteosat 9 IR10.8 image; yellow: omega 925 hPa, blue arrows: 10-metre-wind streamlines
|
|
|
The low-level omega field (925 hPa) matches well with the low-level convergence; local maxima are located on the French coast as well as on the west coast of Britain. Respectively descending motion is mostly found on the regions with offshore wind.
The flow configurations already described in diagrams 3-6 show the convergence-divergence patterns and the vertical motions when the airflow has a small angle with respect to the coastline. The most interesting type is case number 3, where onshore wind blowing from southwest has a major influence on ascending motion over land. This applies to a north-south -oriented coastline; more generally the type could be described as follows:
The most intensive Coastal Convergence by friction is induced when the wind blows parallel or in small angle onshore, the lower pressure being to the left of the wind component parallel to the coast.
Coastal fronts are mesoscale, quite shallow features, often only 1 km deep. They are frequently a cyclogenesis site because they provide a narrow zone along the coast where lower-tropospheric convergence, warm-air advection (from the sea), baroclinity and low-level cyclonic vorticity are greatest.
Recent studies have shown that low-level stability conditions modify the general pattern described above. A warm surface generally enhances momentum transfer and wind speed, and reduces the cross-isobar angle. This transforms to rapid acceleration and downstream veering of offshore winds as they enter a warm, smooth sea. Cold sea, on the other hand, strongly inhibits vertical momentum transfer. This leads to offshore winds, and even decreasing in speed in some cases. In these cold sea cases, the induced coastal convergence and rising motion typically are inhibited near surface and only become distinguishable approximately 100 m above the surface.
Respectively, an onshore flow on to cold land may bring along rapid deceleration and strong inland backing of winds. The deceleration is weaker and more gradual over warm land.
Alternating land contours, such as narrow peninsulas, islands, bays, etc. have an influence on the low-level air flow and can cause complex patterns of divergence and convergence, resulting in complex patterns of enhanced convective lines adjacent to the coast. The following diagram illustrates the effect of north-pointing narrow peninsula for a northeasterly flow. In the example shown above the local maxima of convergence over and northeast of Brittany may partially be explained with peninsula effect.
Sheets of frontal cloudiness can sometimes hide the Coastal Convergence and enhanced precipitation associated with it. The example below shows such a case near the Swedish east coast. A frontal cloud layer with widespread snowfall extends from Central Finland southwestwards to Sweden. Surface winds along the Swedish coast give an indication of Coastal Convergence as shown by the numerical model surface wind field. In Gävle (marked with red dot) precipitation enhancement by Coastal Convergence was extremely strong; with stationary wind conditions lasting for two days a total snowfall amount of 100 cm was achieved. The actual enhancement of precipitation on the coast due to Coastal Convergence is hard to detect from satellite imagery alone. Other tools, such as radar, can be used for quantitative precipitation analyses.
The example shows that even when the frontal cloudiness hides the Coastal Convergence, it still indirectly can give valuable information for diagnosis: the orientation of the frontal cloud in respect to the coastline may assist in evaluating the likelihood of Coastal Convergence - even without the numerical wind fields. If the frontal cloudiness remains stationary for a period of time, the probability of appreciable enhancement of coastal precipitation increases.
|
13 January 2007/12.00 UTC - Meteosat 9 IR10.8 image; magenta: divergence 1000 hPa, blue arrows: 10-metre-wind streamlines
|
13 January 2007/12.00 UTC - Meteosat 9 IR10.8 image; yellow: omega 925 hPa, blue arrows: 10-metre-wind streamlines
|
|
|
|
|
|
13 January 2007/12.00 UTC - 6h accumulated precipitation
|
|
Key Parameters
- Low-level divergence/convergence:
Convergence in the lowest layers in the atmosphere along or parallel to the coast. - Low-level omega:
Rising motion at lower troposphere along or parallel to the coastline. - Angle of geostrophic wind with the coastline:
Onshore wind having a relatively small angle with coastline, the lower pressure being on sea, higher pressure over land. - Accumulated precipitation:
Signs of enhanced accumulated precipitation within the next 6-24 hours along or parallel to the coastline indicative of coastal effects.
Low-level divergence/convergence
|
|
31 July 2007/00.00 UTC - Meteosat 9 IR 10.8 image; magenta: divergence 1000 hPa
|
|
|
Low-level omega
|
|
31 July 2007/00.00 UTC - Meteosat 9 IR 10.8 image; yellow: omega 925 hPa
|
|
|
Angle of geostrophic wind with the coastline
|
|
31 July 2007/00.00 UTC - Meteosat 9 IR 10.8 image; blue arrows: 10-metre-wind streamlines
|
|
|
Accumulated precipitation
|
|
31 July 2007/00.00 UTC - Meteosat 9 IR 10.8 image; blue: accumulated 12 hour total precipitation (30 July 12 UTC - 31 July 00 UTC)
|
|
|
Typical Appearance In Vertical Cross Sections
The extent of circulation induced by Coastal Convergence depends on the general stability of the lower troposphere. In stable conditions the circulation is restricted to the lowest kilometre of the atmosphere, whereas in unstable conditions Coastal Convergence can be conducive to deep convection.
- Divergence:
Low-level Convergence along or parallel to coast, typically maximum below 2 km altitude. Divergence above. - Vertical motion:
Enhanced ascent along or parallel to coast.
|
|
31 July 2007/00.00 UTC - Meteosat 9 10.8 image; position of vertical cross section indicated
|
|
|
Divergence
|
|
31 July 2007/00.00 UTC - Vertical cross section; black: isentropes (ThetaE), magenta thick: convergence, magenta thin: divergence;
Location of Polish coastline is shown with a green star.
|
|
|
Vertical motion
|
|
31 July 2007/00.00 UTC - Vertical cross section; black: isentropes (ThetaE), cyan thick: vertical motion (omega) - upward motion,
cyan thin: vertical motion (omega) - downward motion; Location of Polish coastline is shown with a green star.
|
|
|
Weather Events
| Parameter | Description |
| Precipitation |
|
| Temperature |
|
| Wind (incl. gusts) |
|
| Other relevant information |
|
|
31 July 2007/00.00 UTC - Meteosat 9 IR 10.8 image; green: weather events
|
|
|
References
- ALESTALO, M., SAVIJÄRVI, H. (1985): Mesoscale circulations in a hydrostatic model: coastal convergence and orographic lifting.
- ANDERSSON, T., GUSTAFFSON, N. (1994): Coast of Departure and Coast of Arrival: Two Important Concepts for the Formation and Structure of Convective Snowbands over Seas and Lakes. Monthly weather review, Vol. 122, pp. 1036-1050.
- ANDERSSON, T., MICHELSSON, D.B. (1999): The December 1998 snowfall over Sweden as seen by weather radars. Polarfront, Vol. 26, Nr. 100/101, pp. 26-33.
- ANDERSSON, T., NILSSON, S. (1990): Topographically Induced Convective Snowbands over the Baltic Sea and Their Precipitation Distribution. Weather and Forecasting, Vol. 5, pp. 299-312.
- ATLAS, D., CHOU, S.-H. (1983): The Influence of Coastal Shape on Winter Mesoscale Air-Sea Interaction. Monthly Weather Review, Vol. 111, pp. 245-252.
- BALLENTINE, R. J. (1980): A Numerical Investigation of New england Coastal Frontogenesis. Monthly Weather review, vo.. 108, pp. 1479-1497.
- BOSART, L.F. (1975): New England coastal frontogenesis. Quarterly Journal of royal Met. Society, Vol. 101, pp. 957-978.
- DOYLE, J., WARNER; T. T. (1993): A Numerical Investigation of Coastal Frontogenesis and Mesoscale Cyclogenesis during GALE IOP 2. Monthly Weather Review, Vol. 121, pp. 1048-1077.
- ROELOFFZEN, J. C., VAN DEN BERG, W. D., OERLEMANS, J. (1986): Frictional convergence at coastlines. Tellus, Vol. 38A, pp. 397-411.
- SAVIJÄRVI, H. (2004): Model predictions of coastal winds in a small scale. Tellus A. Vol. 56, Issue 4, pp. 287-295
- STAUFFER, D. R. , WARNER, T. T (1987): A Numerical Study of Appalachian Cold-Air Damming and Coastal Frontogenesis. Monthly Weather review, Vol. 115, pp. 799-821.
- STULL, R. B. (1988): Boundary Layer Meteorology. Kluwer Academic Publishers