Table of Contents
Cloud Structure In Satellite Images
An area with a high probability for the initiation of convection is the leading edge of Cold Front cloud bands. The initiation of convection only happens where there is an appropriate tropospheric structure (see Meteorological physical background and Key parameters).
|
30 May 2005/00.00 UTC - Meteosat 8 IR10.8 image
|
30 May 2005/00.00 UTC - Meteosat 8 WV6.2 image
|
|

|
The images above show a typical situation where convective cells have developed within a frontal zone. A series of very well developed MCSs can be observed from North Western Germany across the Elzas to Southern France and Andalusia. In the IR10.8 image (left) the cells are generally much brighter than the surroundings. The dark stripes in the WV image (right) near the cells are typical features associated with MCSs.
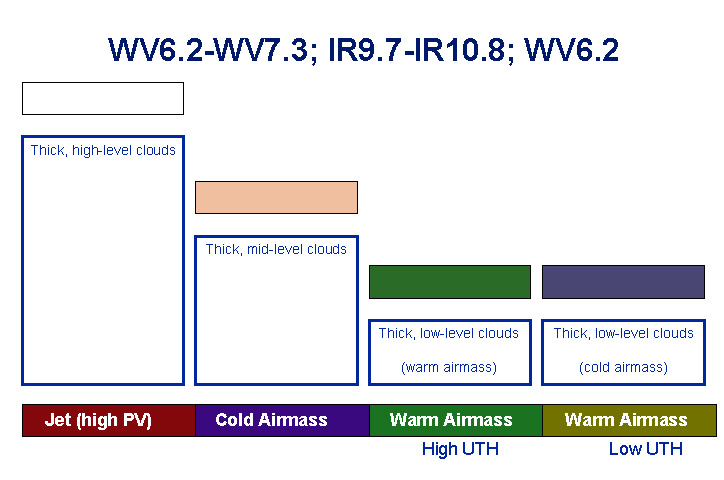
An artificial composite of the infrared and water vapour channels of Meteosat 8 is provided by the Airmass-RGB. The Airmass-RGB consists of the WV6.2 - WV7.3 Brightness Temperature Difference (BTD, on red), the IR9.7 - IR10.8 BTD (on green) and the WV6.2 channel (on blue). A particular feature of this RGB is that dry descending stratospheric air is marked by a reddish colour. Some other features recognizable in this RGB can be found here .
|
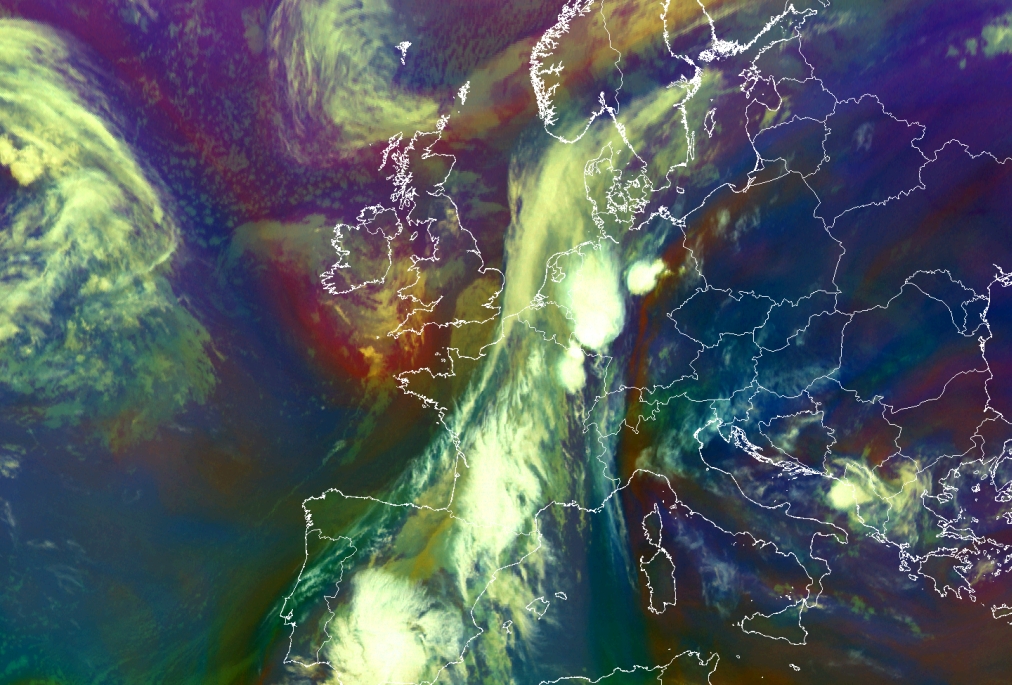
30 May 2005/00.00 UTC - Meteosat 8 Airmass-RGB image
|
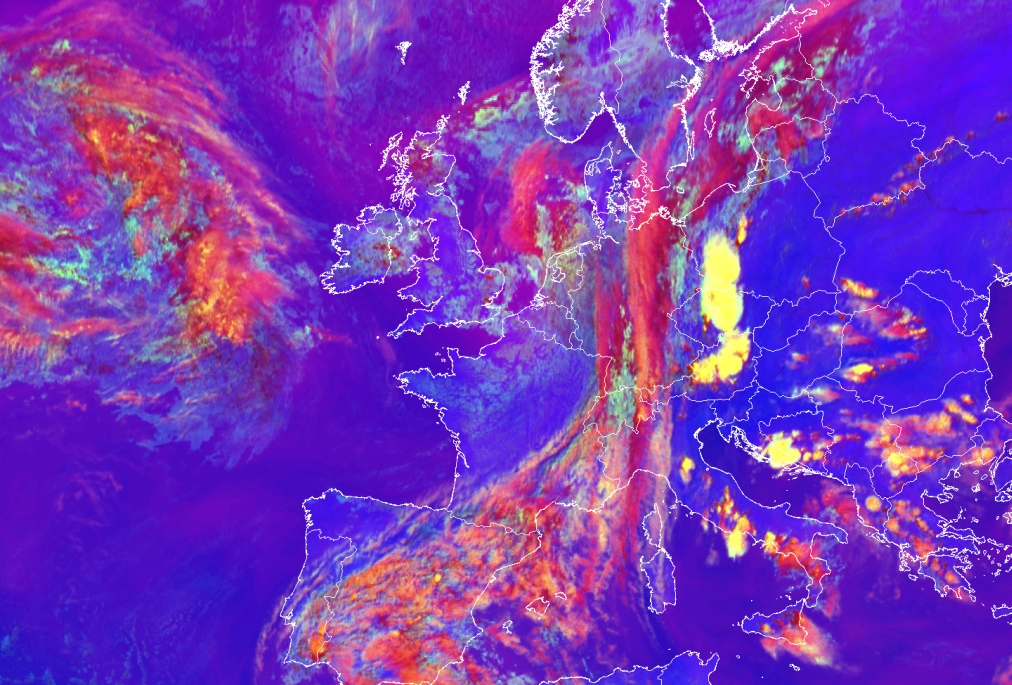
30 May 2005/12.00 UTC - Meteosat 8 Severe Convection-RGB image
|
|
|
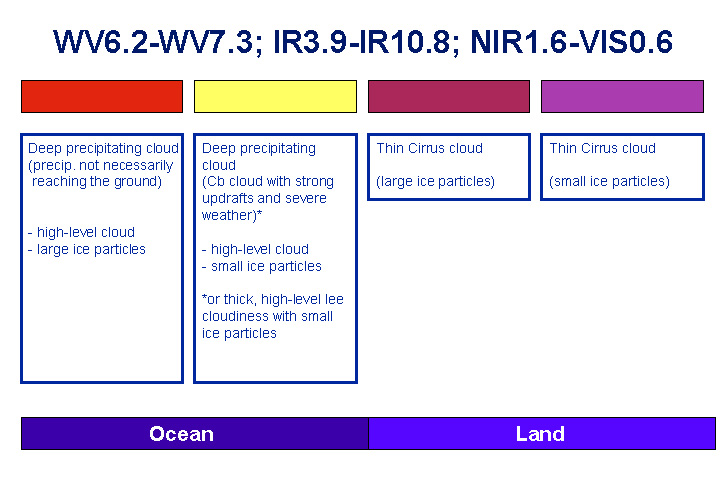
A second RGB useful to monitor convection is the Severe Convection RGB. An example of this RGB is shown in the image above right. The RGB is build up of the composite of the BTD of WV6.2-WV7.3 on red, the BTD of IR3.9-IR10.8 on green and the BTD of NIR1.6-VIS0.6 on blue. In the image all the cells can be recognised easily: a large bright yellow cell at the leading edge of the front over Austria and Czech Republic and a more orange cells over Eastern Europe.
The colours of these cells explain the physical content. Whereas the yellow cell at the leading edge of the front is mainly consisting of very small ice particles, the eastern cell has further developed and already consists of larger ice particles. More on the different colours observed in this Severe convection RGB can be found here .
Meteorological Physical Background
MCSs frequently develop at the leading edge of frontal cloud bands. This is most likely the situation where there is a specific vertical distribution of air mass and conveyor belts: a warm conveyor belt at low levels in front of the front and a dry intrusion in the layers above.
Such a situation develops when a jet streak crosses the front; dry air on the cyclonic side of the jet axis overruns the frontal cloud band and reaches its leading edge. Whilst the relative streams of the dry intrusion are sinking behind the frontal cloud band, they change to rising during the crossing of the front.
The troposphere under such conditions is characterized by (see Key Parameters):
- frontal conditions indicated by TFP, a zone of high thickness gradients, a downward inclined gradient of isentropes, a frontal circulation created through convergence and upward vertical motion, etc.
- a rising warm conveyor belt in low to middle layers along the leading edge of the frontal cloud band
- a (rising) dry intrusion in middle to high layers along the same leading edge of the frontal cloud band
- the effect of both conveyor belts lying on top of each other leads to the unstable stratification of the troposphere
|
|
|
|
|
|
|
|
30 May 2005/00.00 UTC - Meteosat 8 IR10.8 image; blue: thermal front parameter 850 hPa, red: temperature advection 700 hPa
|
30 May 2005/00.00 UTC - Vertical cross section; black: isentropes (ThetaE), orange thin: IR pixel values, orange thick: WV pixel
values
|
|
|
|
|
|
30 May 2005/00.00 UTC - Meteosat 8 IR10.8 image; magenta: relative streams 322K - system velocity: 221° 13 m/s, yellow: isobars
322K. Position of cross section indicated
|
30 May 2005/00.00 UTC - Meteosat 8 IR10.8 image; magenta: relative streams 326K - system velocity: 221° 13 m/s, yellow: isobars
326K. Position of cross section indicated
|
The satellite image shows a frontal cloud band extending from Morocco across the Mediterranean Sea, Spain and France and further north over the Netherlands and Denmark. Along the leading edge of the cloud band several MCSs have developed, especially over the Elzas and Germany. The first image (top left) shows the thermal front parameter with the temperature advection field superimposed. The MCSs have developed ahead of the surface cold front, indicated by the maximum values of thermal front parameter. The cross section (top right) crosses the Cold Front over the North Sea and the Netherlands and the convective system situated over Germany. The relative streams on the isentropic surface of 322K (bottom left) show that the MCS is under the influence of the moist air in the warm conveyor belt. On the higher isentropic surface at 326K (bottom right) the whole area of the MCS is under the influence of a relative stream of dry intrusion. This vertical distribution of conveyor belts, together with upward motion, leads to the development of a conditionally unstable stratified troposphere.
|
|
|
29 May 2005/18.00 UTC - Meteosat 8 WV6.2 image; yellow: isotachs 300 hPa, red: vorticity advection 300 hPa
|
29 May 2005/18.00 UTC - Meteosat 8 WV6.2 image
|
|
|
|
|
|
30 May 2005/00.00 UTC - Meteosat 8 WV6.2 image; yellow: isotachs 300 hPa, red: vorticity advection 300 hPa
|
30 May 2005/00.00 UTC - Meteosat 8 WV6.2 image
|
The satellite image (top left and right) shows the development of MCSs over Germany and the Elzas.
The MCS development is situated within the area of the left exit region of the jet streak which extends from the south coast of Ireland
(approximately 51N/09W), across the Bay of Biscay into Normandy (top left). The left exit region is accompanied by a pronounced PVA maximum at
300 hPa.
The WV image clearly shows the jet axis (dry air along the cyclonic side and moist air along the anticyclonic side of the jet axis) from the
Atlantic, South of Ireland and England. The MCS cloudiness itself is characterized in WV by a black area around each MCS which is typical for
such systems (see Cloud structure in satellite images).
Six hours later, the MCSs within the area of the left exit can be found over Western part of Germany and the Elzas. Other MCSs have developed downstream above Southern France and in Southern Spain (Andalusia). The WV image again very clearly shows the jet axis (bottom right). The jet axis can still be found just south of Ireland with an extensive dark area over South-East England and Normandy. The cloud tops along the cyclonic side are continuously increasing downstream which can be explained by the supply of more humid air in upper levels. The surroundings of the MCS cloudiness are again characterized by this typical black (dry) area around of the cell (see Cloud structure in satellite images).
MCSs develop in connection with warm air, therefore they can be found in front of or within the leading parts of Cold Fronts. Convective systems which develop in different synoptic environments and are described in chapters Cumulonimbus Cluster, Enhanced Cumulus and Comma. (see Cumulonimbus Cluster , Enhanced Cumulus and Comma ).
Key Parameters
Frontal Parameters (TFP, equivalent thickness)
Typical configurations for fronts and thickness ridges are described in detail by the relevant conceptual models (see also Cold Fronts, Warm Fronts). In this case, the typical area for the initiation of convection is along the leading edge of a Cold Front cloud band, immediately in front of the TFP and an area of high thickness gradients.
|
Environment typical for development of MCS: equivalent thickness ridge with a frontal system
|
30 May 2005/00.00 UTC - Meteosat 8 IR10.8 image; blue: thermal front parameter 500/850 hPa, green: equivalent thickness 500/850 hPa
|
|
|
Stability index (Showalter index)
The relevant area is indicated by Showalter values less than 3 and further east even less stable with negative values.
|
Environment typical for development of MCS: equivalent thickness ridge with a frontal system and Showalter Index values less than 3
|
30 May 2005/00.00 UTC - Meteosat 8 IR10.8 image; blue: thermal front parameter 500/850 hPa, green: equivalent thickness 500/850
hPa, yellow: Showalter index 500/850 hPa
|
|
|
Equivalent potential temperature at 850 hPa
The MCSs develop in the area of high gradient close to the front and to the W or NW of the ridge of high ThetaE values.
|
Environment typical for development of MCS: low level potential temperature ridge
|
30 May 2005/00.00 UTC - Meteosat 8 IR10.8 image; blue: thermal front parameter 500/850 hPa, magenta: ThetaE 850 hPa
|
|
|
Typical Appearance In Vertical Cross Sections
A cross section of the synoptic environment of MCSs along the leading edge of a frontal cloud band is characterised by the following features:
- Isentropes of equivalent potential temperature show an unstable stratified troposphere within the lower and mid-levels of the troposphere, which is mostly superadiabatic in the lower layers.
- The vertical distribution of temperature advection is characterised by CA at middle and higher levels indicating cold air overrunning the frontal air mass. This means that the stratification becomes unstable.
- Fields of divergence indicate convergence within the lower and mid-levels. In the case of pre frontal MCS development, the convergence is part of the frontal circulation cell and has a distinct pre frontal maximum, indicating strong ascending motion.
|
30 May 2005/00.00 UTC - Meteosat IR10.8 image; position of vertical cross section indicated
|
|
|
|
Vertical distribution of isentropes typical for development of MCS
|
30 May 2005/00.00 UTC - Vertical cross section; black: isentropes (ThetaE), orange thin: IR pixel values, orange thick: WV pixel
values
|
|

|
|
Vertical distribution of isentropes and temperature advection typical for development of MCS
|
30 May 2005/00.00 UTC - Vertical cross section; black: isentropes (ThetaE), red thick: temperature advection - WA, red thin:
temperature advection, CA, orange thin: IR pixel values, orange thick: WV pixel values
|
|
|
|
Vertical distribution of isentropes and divergence typical for development of MCS
|
30 May 2005/00.00 UTC - Vertical cross section; black: isentropes (ThetaE), magenta thin: divergence, magenta thick: convergence,
orange thin: IR pixel values, orange thick: WV pixel values
|
|
|
The above images show cross sections across the frontal cloud band and the MCSs in the warm air ahead of it. Isentropes in this area show an unstable stratified troposphere while the pronounced upward motion is driven by strong low and mid-level convergence. The existence of MCSs is indicated by high pixel values in the IR as well as in the WV image.
Weather Events
For weather events see Cumulonimbus (CB) And Mesoscale Convective System (MCS) - Weather Events
References
- BLUESTEIN, H.B., JAIN, M.H., (1985): Formation of Mesoscale Lines of Precipitation: Severe Squall Lines in Oklahoma During Spring, J. Atmos. Sci., 42, 1711p
- FANKHAUSER J. G. (1976): Structure of an Evolving Hailstorm, Part II: Thermodynamic Structure and Airflow in the Near Environment; Mon. Wea. Rev., Vol. 104, p. 576 - 587 Appl. Met., Vol. 11, p. 189 - 201
- NEWTON C. W. and FANKHAUSER J. C. (1975): Movement and propagation of multicellular convective storms; Pure Appl. Geophys., Vol. 113, p. 747 - 764
- WINKLER R. (1995): Auftreten von Multi-Cell Storms südlich des Alpenhauptkammes nach Kaltfrontdurchgang; Diploma thesis, University of Vienna