Table of Contents
Appearance in Satellite Data
|
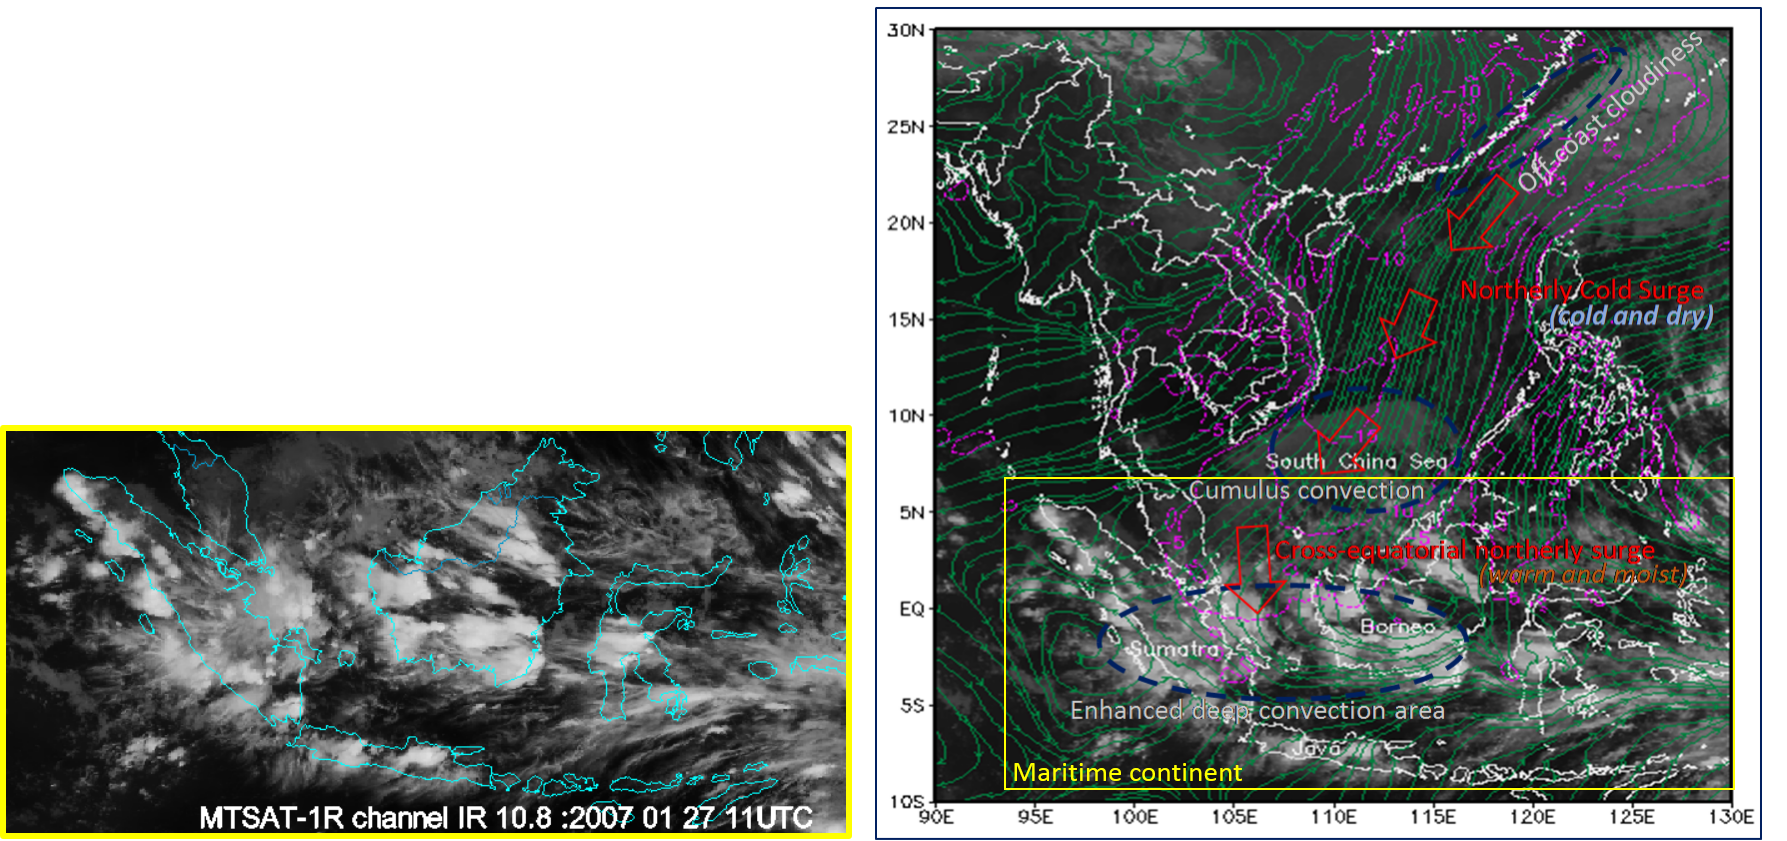
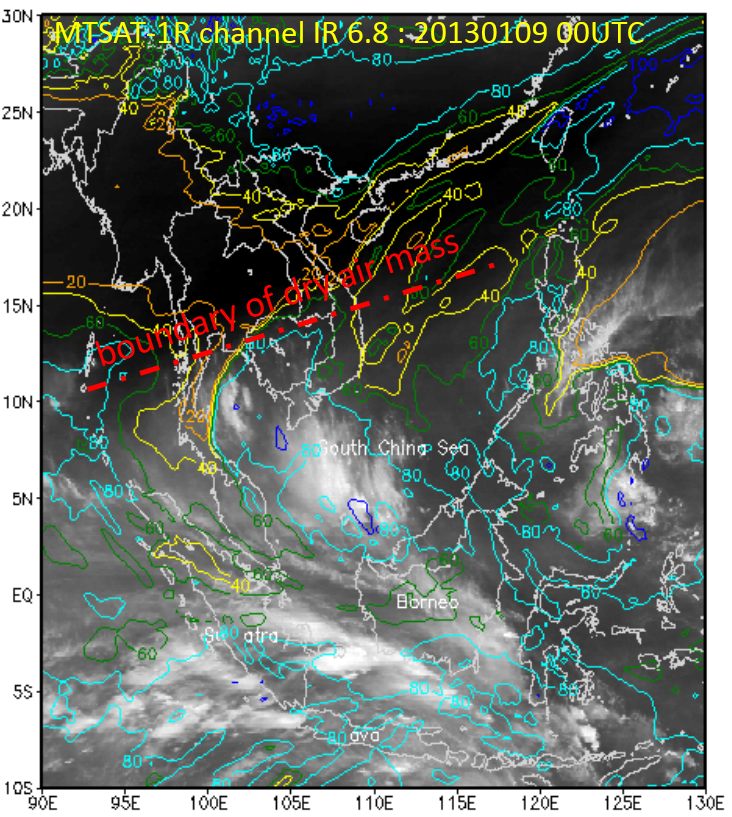
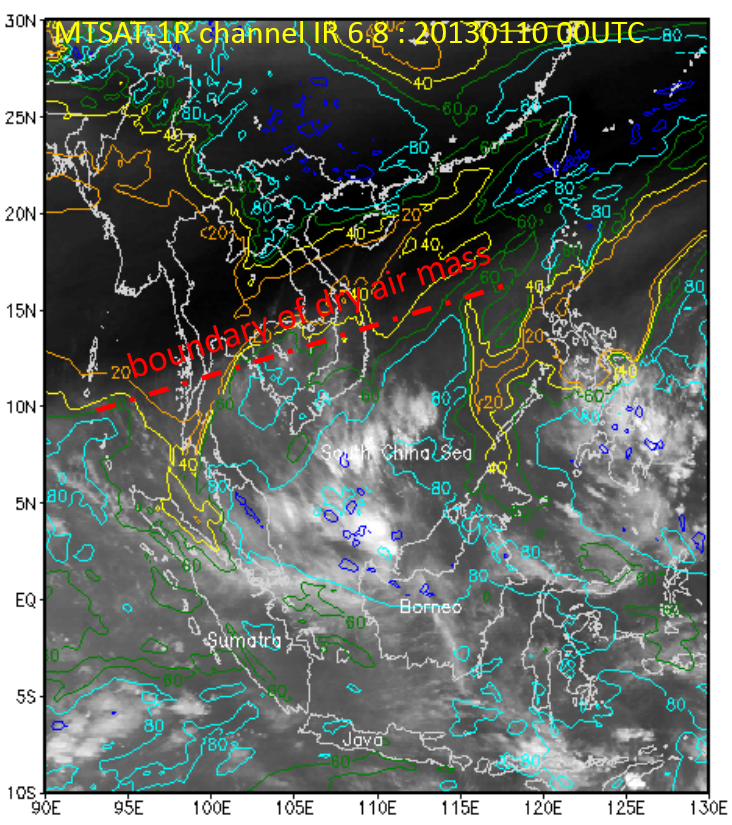
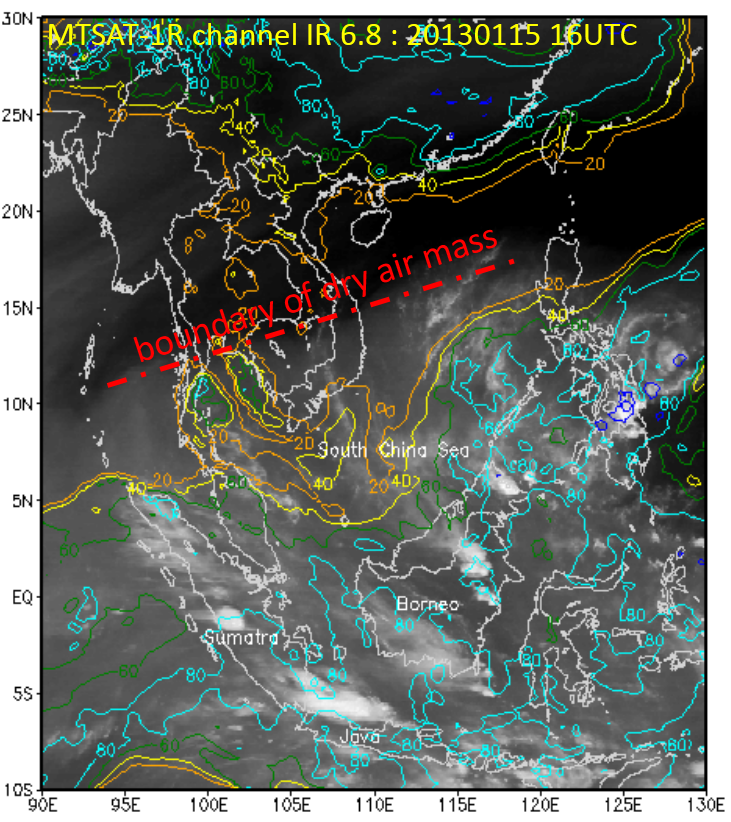
Typical northerly cold surge cloudiness
|
|
Convection in the Maritime Continent is typically the result of one of three synoptic disturbances, namely Northerly Cold Surge (NCS), Borneo Vortex, and Madden-Julian Oscillation (MJO).
- NCS events often occur during the peak of boreal winter monsoons (December-January-February). When the strong flow associated with NCS propagates southward and crosses the equator, it may affect the intensity of convection in the South China Sea and the Maritime Continent. The time scale for the whole system is a few days to a week.
- A Borneo vortex typically appears off the northwestern coast of northern Borneo. When a NCS event coincides with a vortex, the convection strengthens over northwest Borneo and weakens north of Java. The lifetime of the vortex is a few days.
- The MJO is a dominant intra-seasonal oscillation in tropical latitudes which makes the degree of convective activity depend on variations in zonal wind convergence. The MJO originates from the Indian Ocean and propagates eastward across the Maritime Continent into the Pacific Ocean with time period of 30 to 60 days. When the active phase of MJO reaches the Maritime Continent, enhanced convection appears in the eastern Indian Ocean (west of Sumatra), Java Island and south of Java.
The interaction of these disturbances of various scales leads to a favorable environment for deep convection in the Maritime Continent. Southern equatorial latitudes are impacted when cross equatorial flow develops.
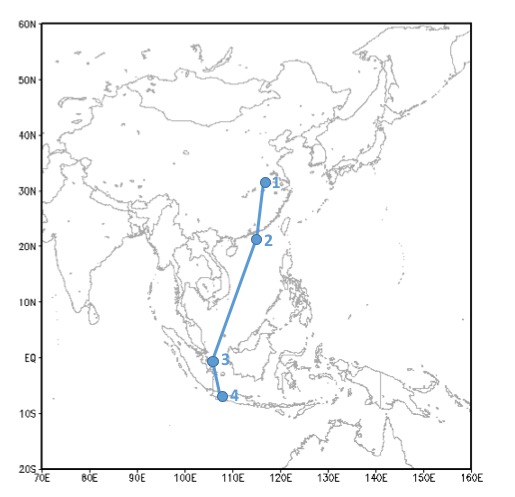
- Phase-1: when the NCS is estimated to arrive in Hongkong (22N, 114E), indicated by a change towards cold and dry conditions.
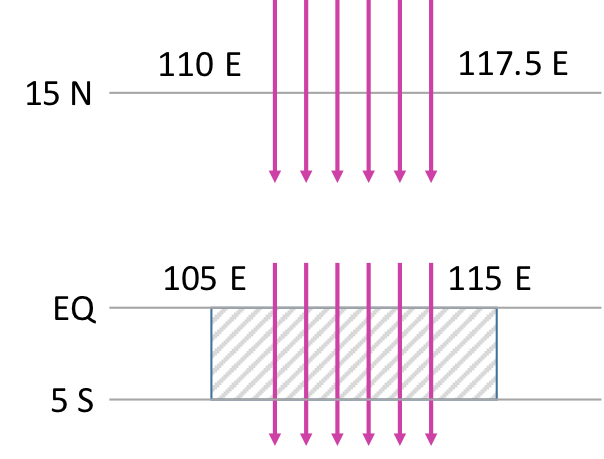
- Phase-2: when the NCS is estimated to reach 15N in the South China Sea, indicated by mean strong meridional wind above 8m/s along 15N.
- Phase-3: when there is a Cross-Equatorial Northerly Surge (CENS) due to the NCS, indicated by area averaged (0S-5S, 105E-115E) strong meridional wind above 5m/s.
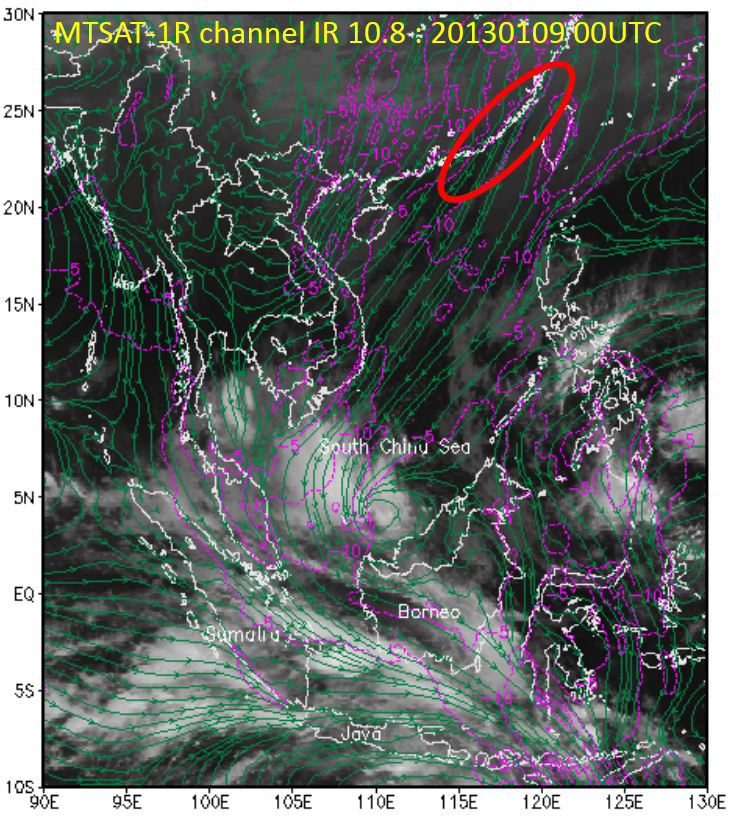
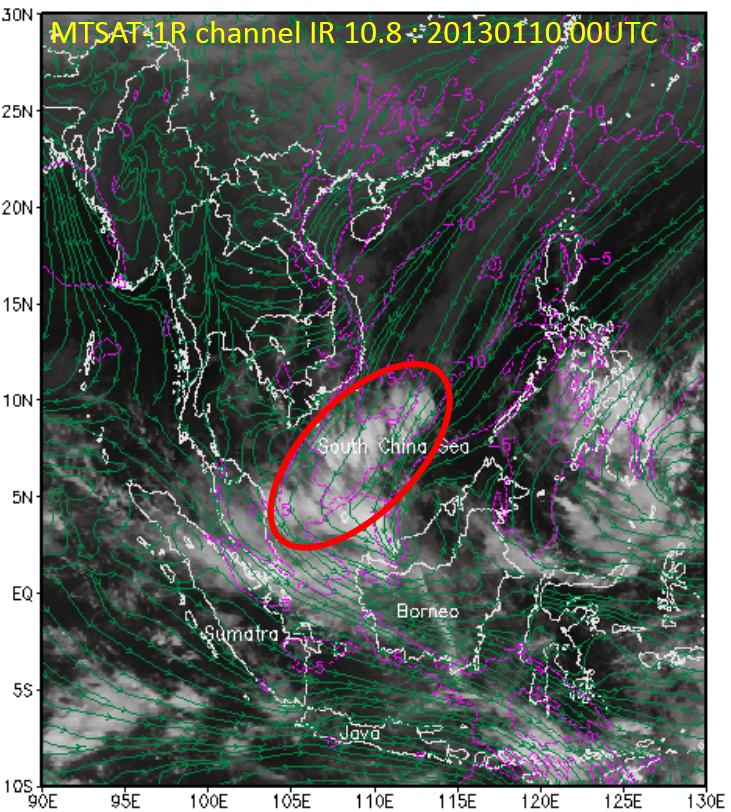
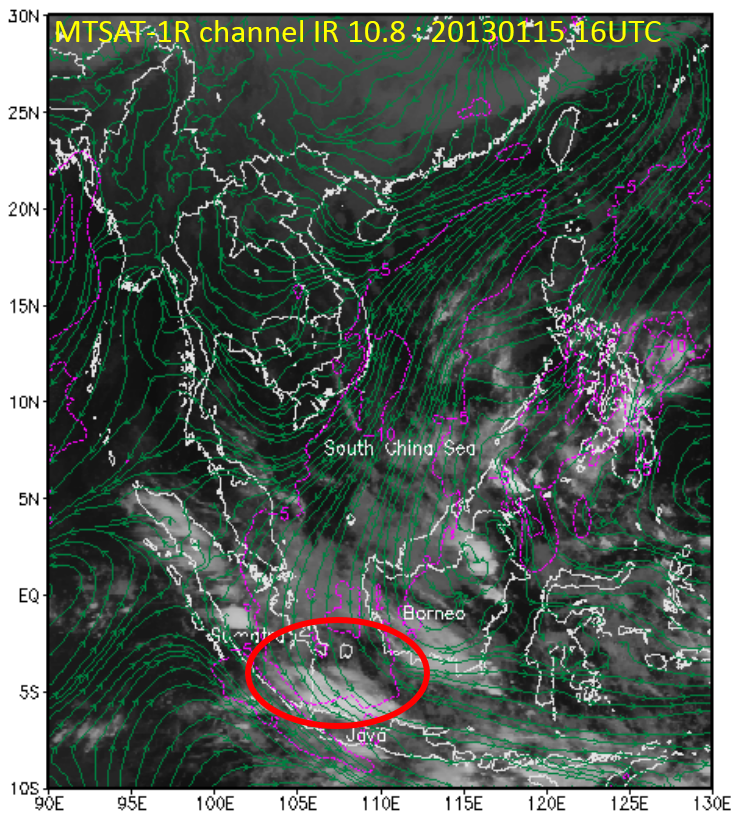
The significant temperature difference between land and sea surface produces a shallow convectively unstable layer. Initially this produces cloudiness just off the coast of China mainland, which indicates the Phase 1 of the NCS event. During Phases 1 and 2, cloudiness in the form of cloud streets appears in the South China Sea, as indicated by cumulus convection caused by the growing convectively unstable layer. During Phase 3 enhanced convection develops over the Karimata Strait and the Java Sea in the form of organized cloud systems of various scales, including Mesoscale Convective Systems (MCS). This is due to the presence of a favorable environment with enhanced low-level convergence, instability and strong vertical wind shear.
|
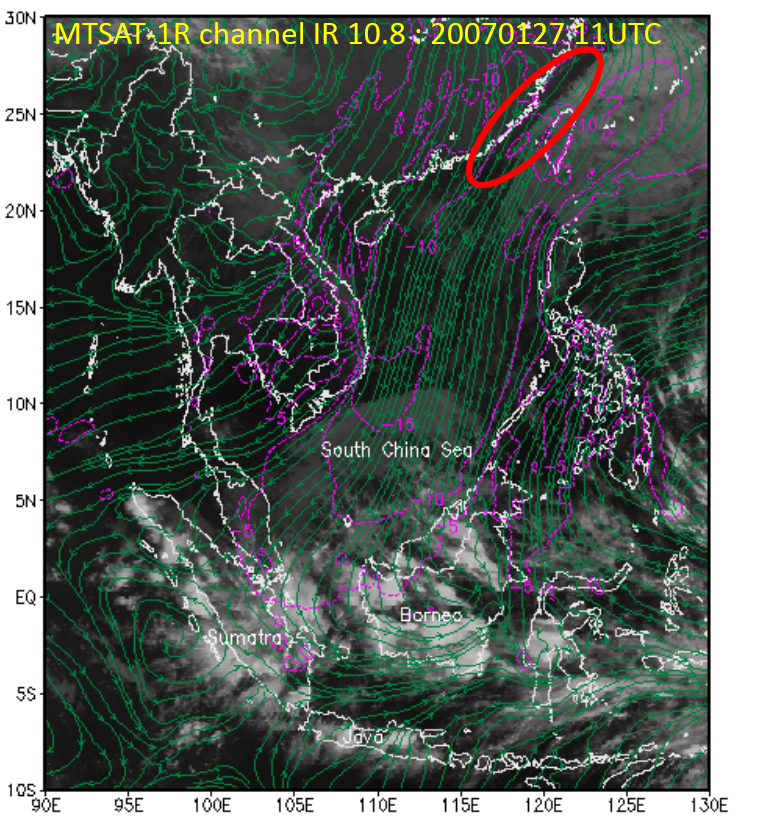
Typical northerly cold surge cloudiness
|

|
- Low level wind shear is a favorable and necessary condition for convection. This applies especially for convection that is triggered and maintained by downdrafts from previously existing organized cloud clusters.
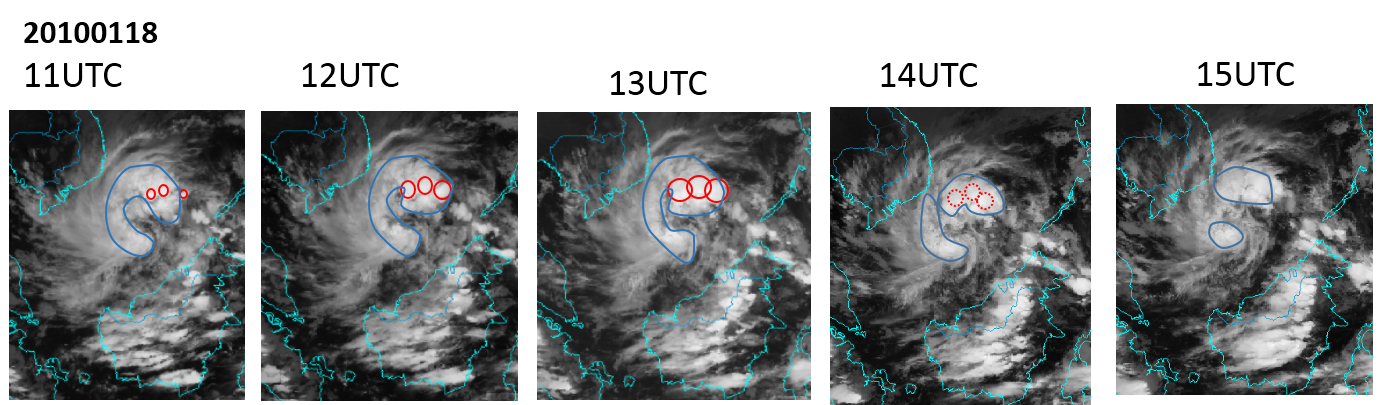
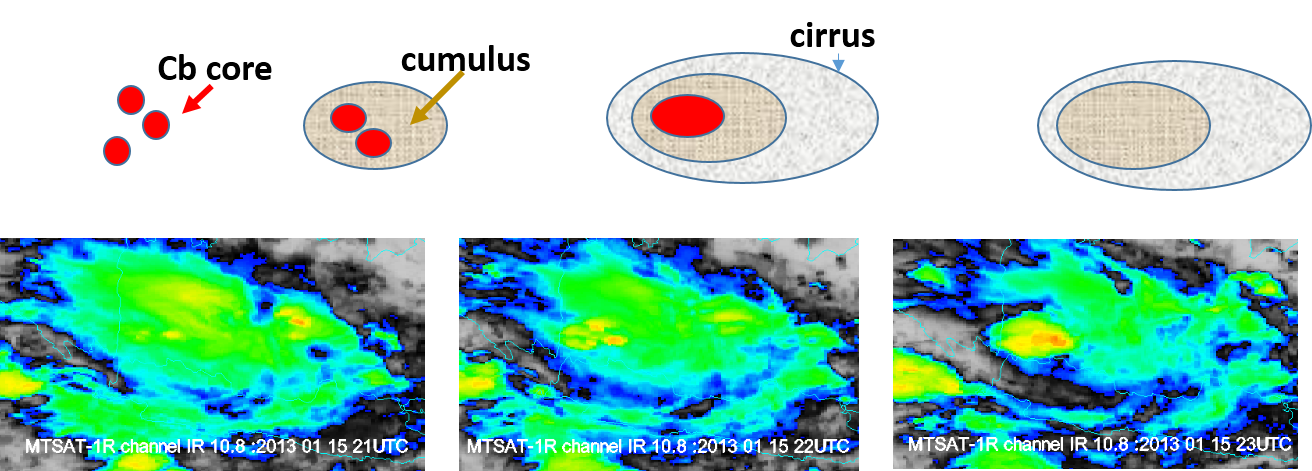
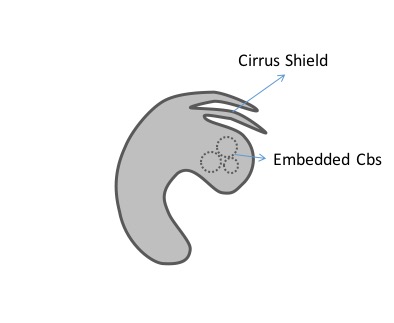
- Oval shape Cirrus shields with a distinctive appearance occur in several Cumulonimbus (Cb) cores that initiate the organized system.
- CENS may induce intensive low level wind convergence.
- Northwesterly flows at lower levels and southeasterly ones at upper levels could produce strong low level vertical wind shear over certain areas for days.
- Wind shear over Java is usually weak due to the limited number of periods with intense cross-equatorial flow.
 |
|
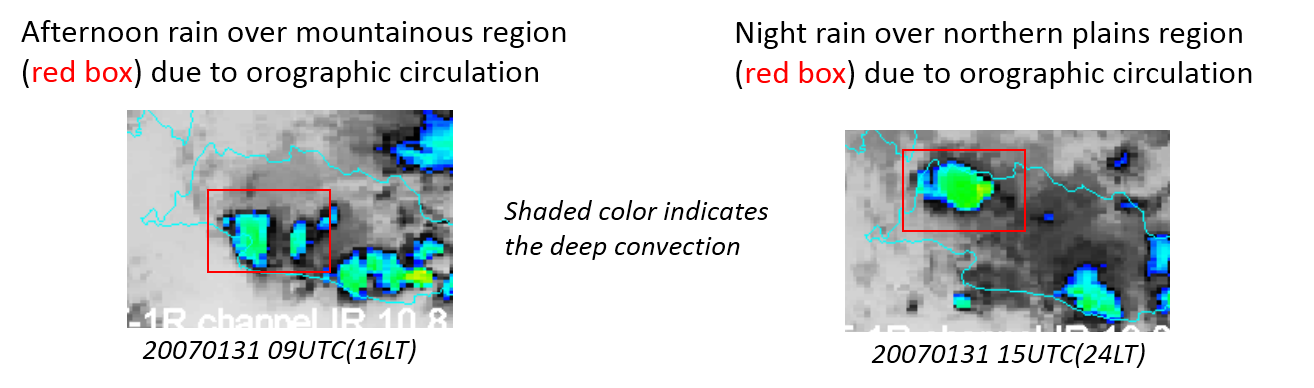
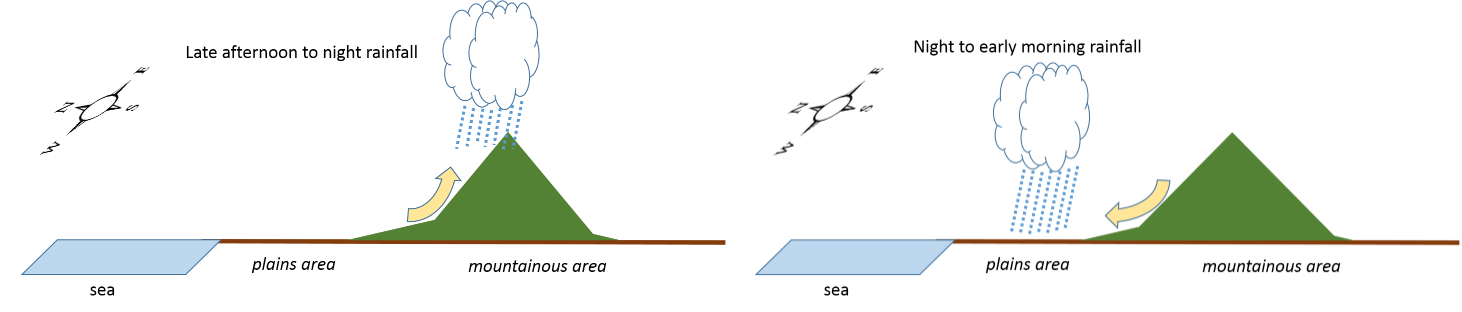
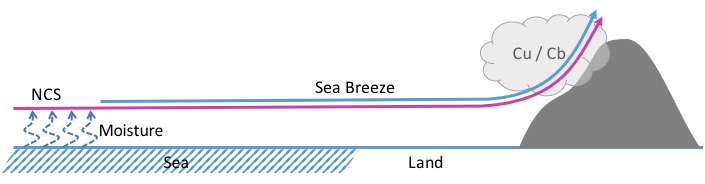
This schematic illustrates the convective activity and rain event due to diurnal orographic circulation
|
 |
NCS Pattern
|
Streamline : meridional wind at 925 hPa ; Color contour: relative humidity at 700 hPa
|
||
|
Stage 1
|
Stage 2
|
Stage 3
|
|
|
|
|
|
|
Notes:
- Cloudiness associated with NCS varies in MCS size clusters.
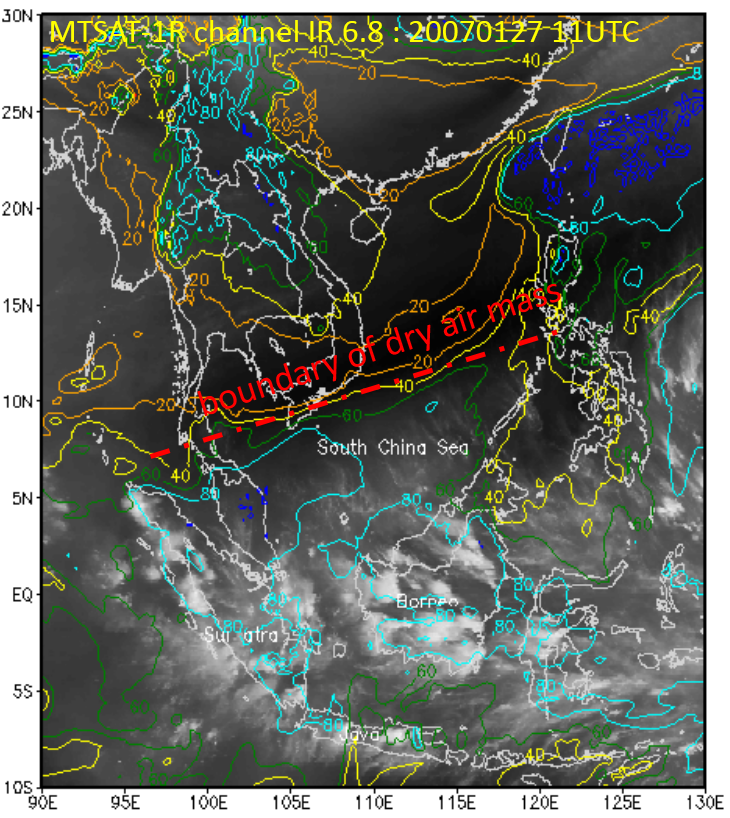
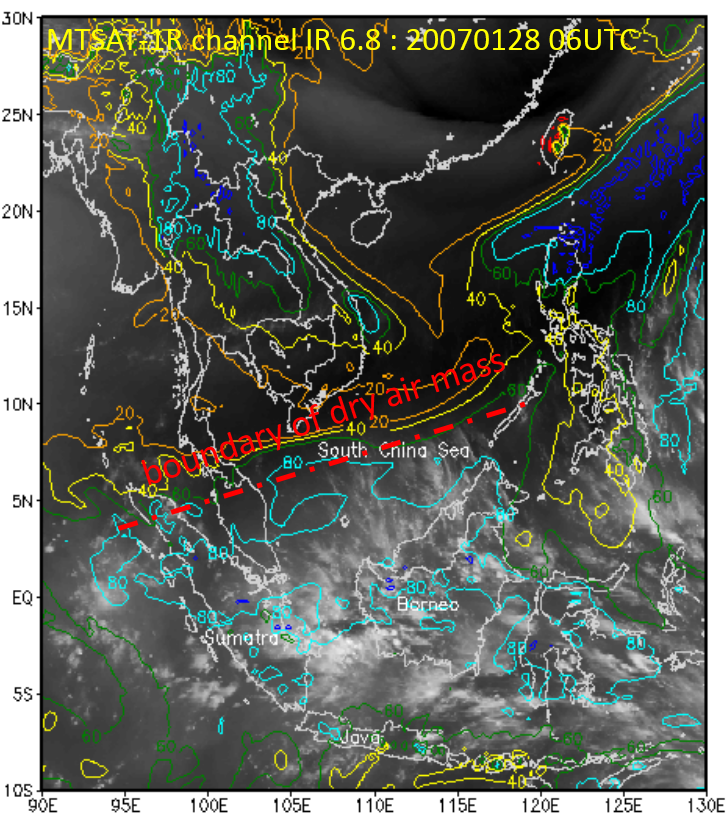
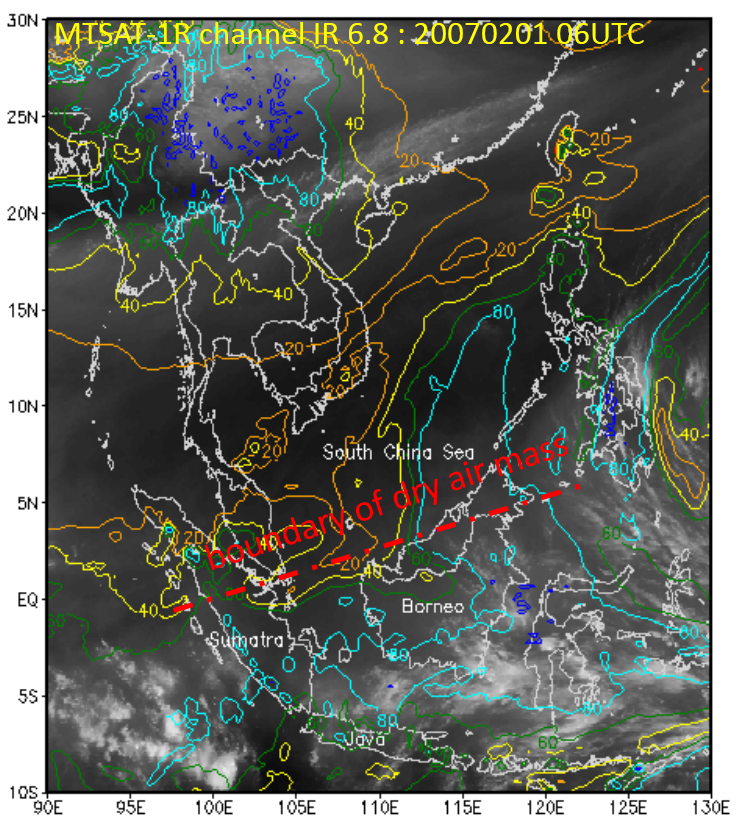
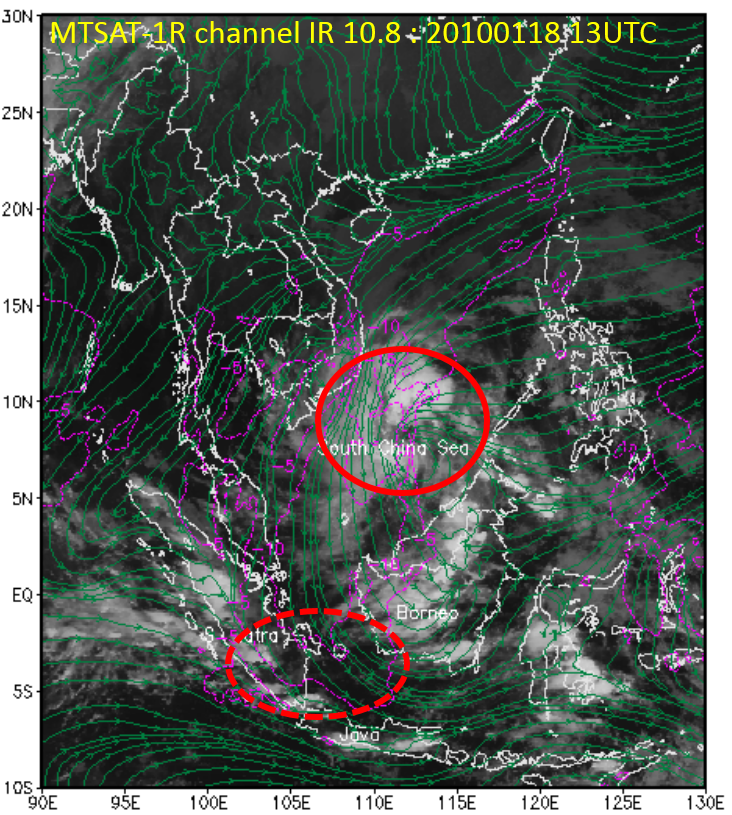
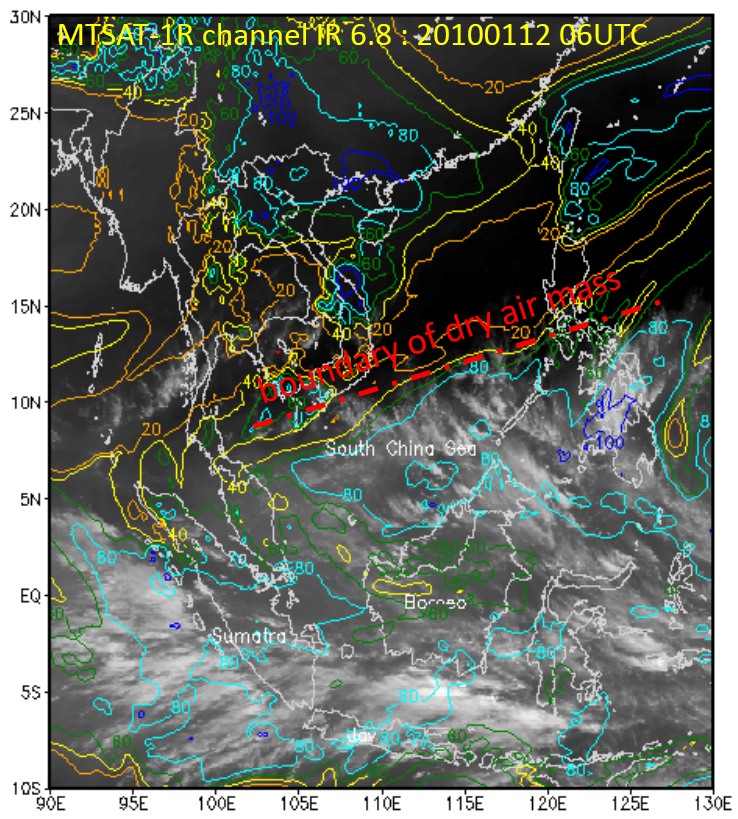
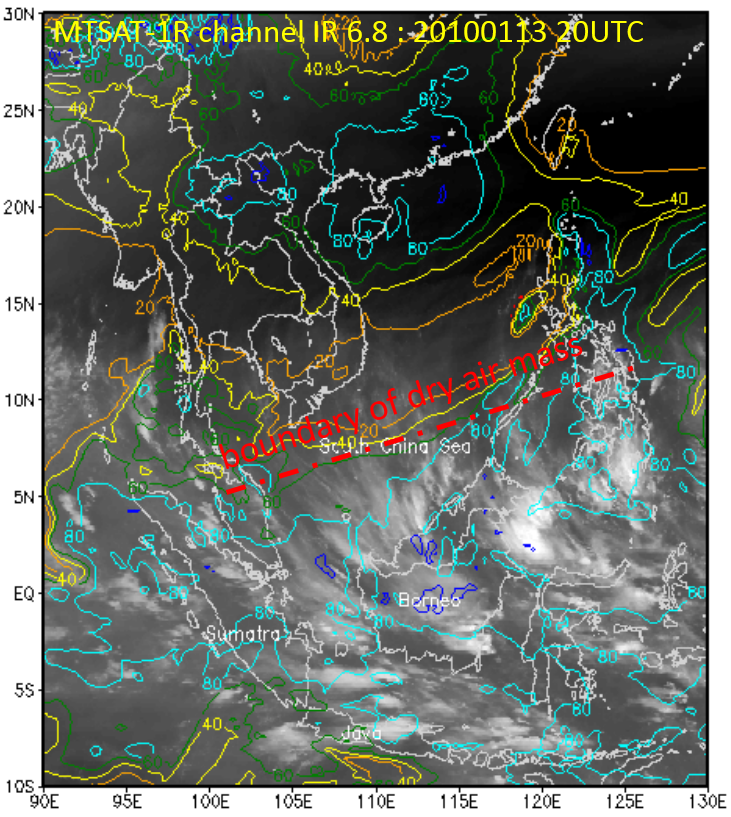
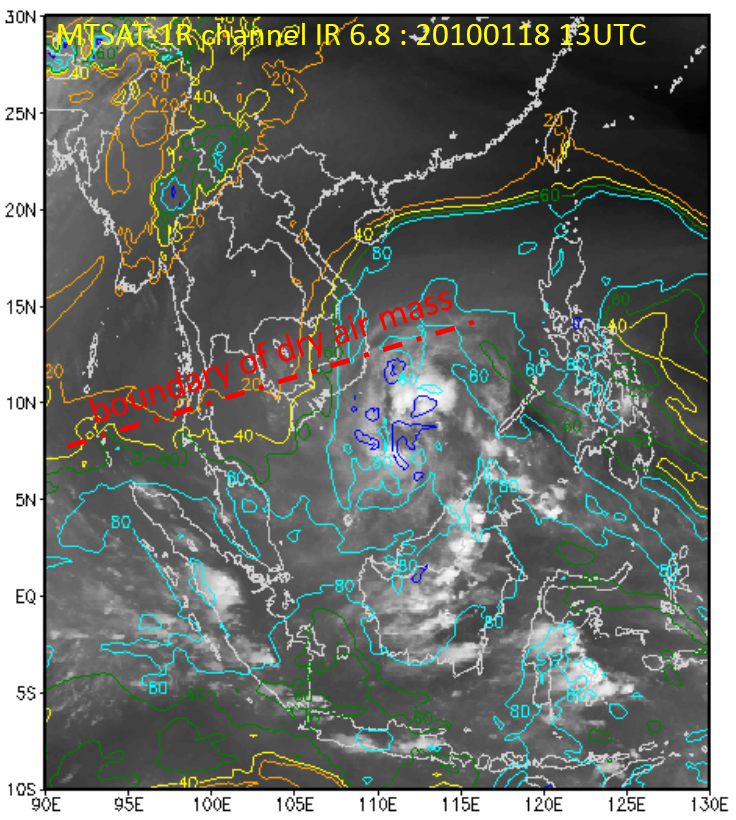
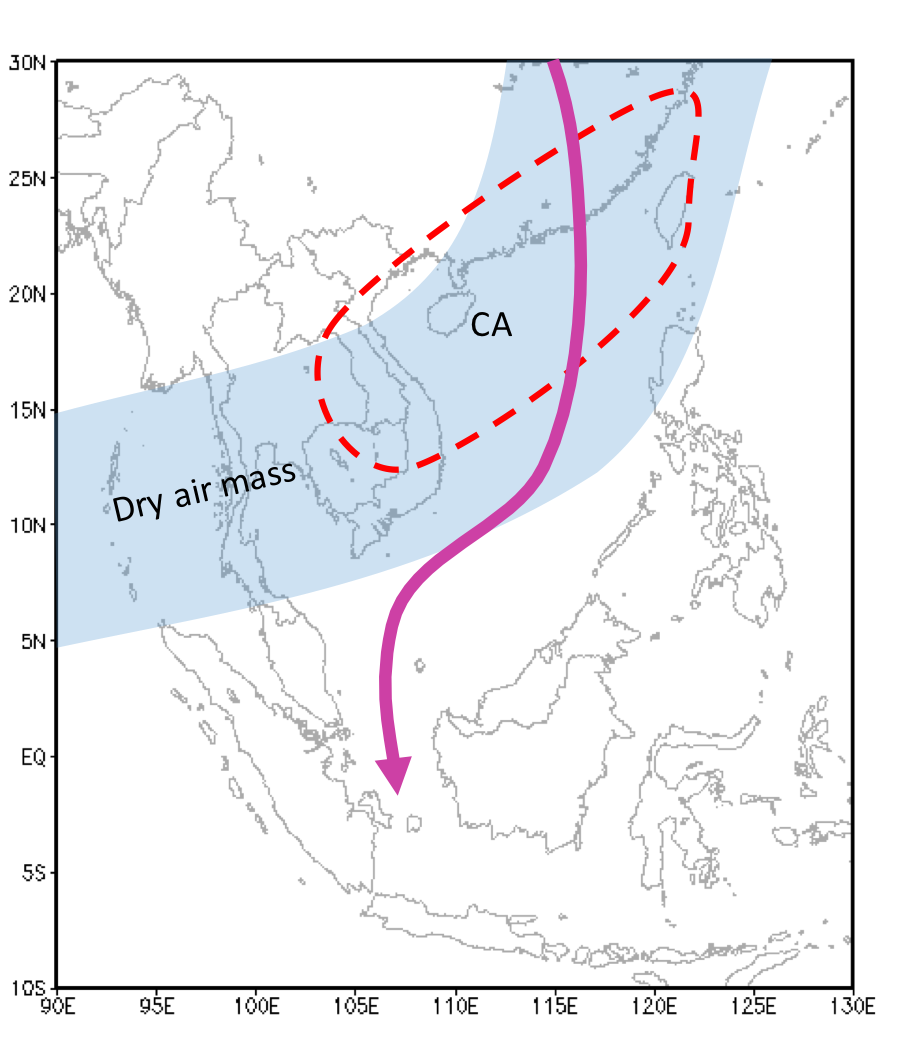
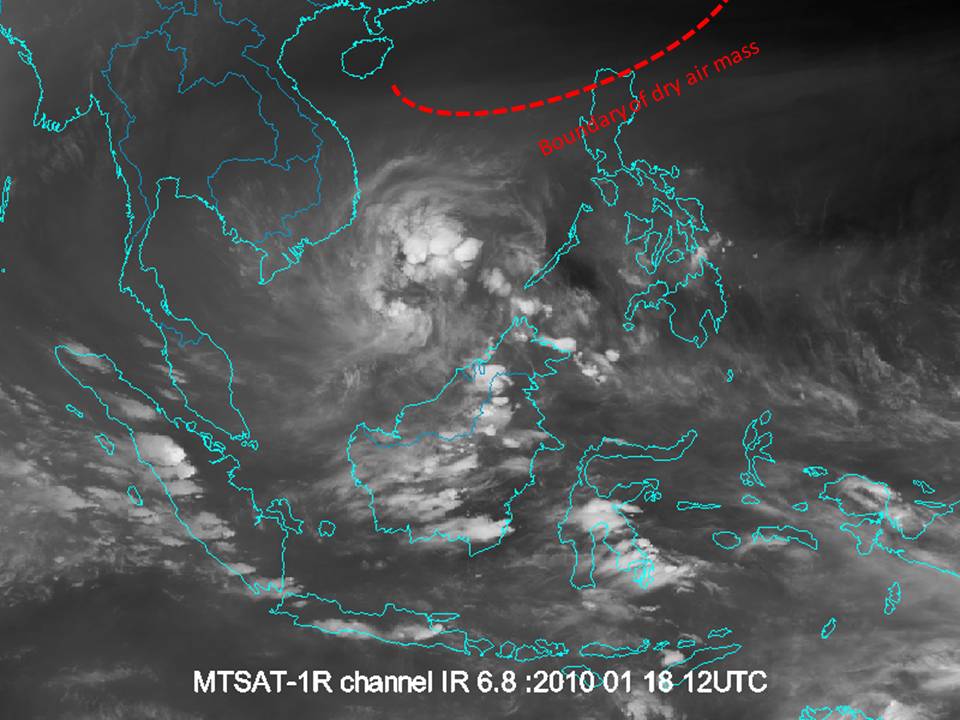
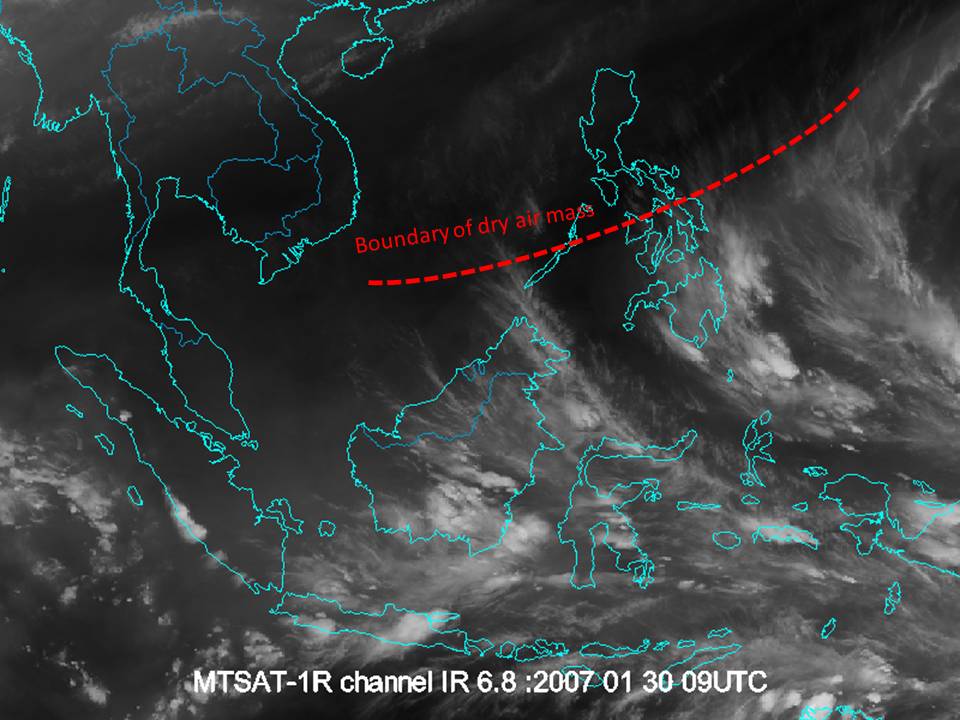
- WV channel is useful to indicate the persistence of NCS. Transportation of relatively drier air mass to the equator can be confirmed.
- Convergence caused by a strong cross-equatorial flow during NCS leads to an area of enhanced convection south of the equator, especially the Java Sea.
|
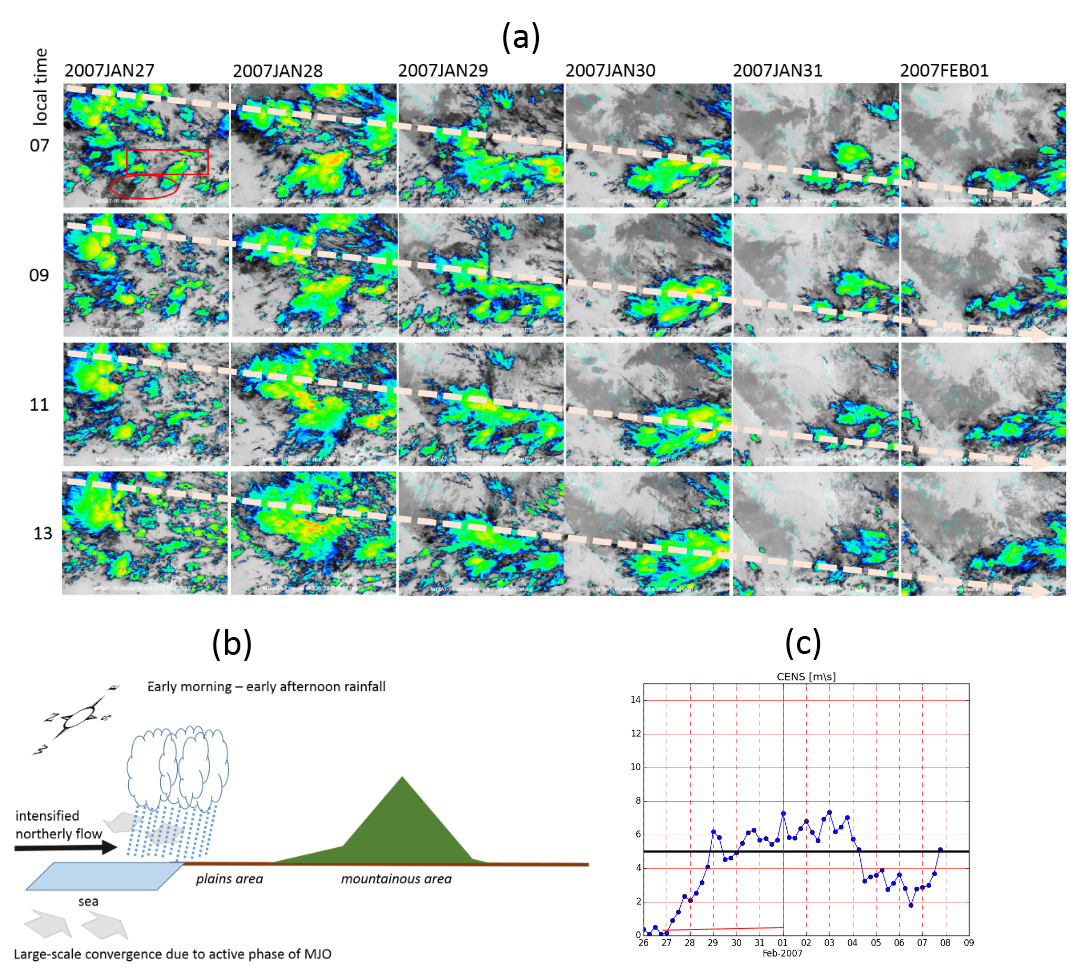
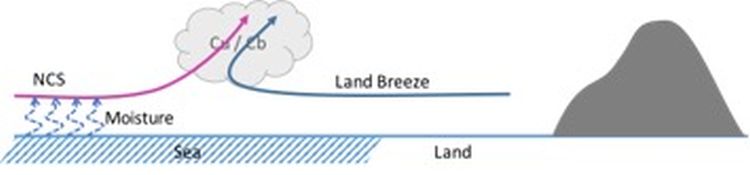
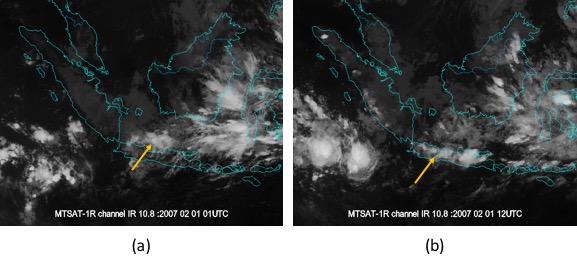
Fig (a) above shows the shift of enhanced convection from west to east. The red circle and rectangle indicate western Java and Java Sea, respectively. The schematic in fig (b) illustrates the heavy rainfall event from early morning to early afternoon. The marine convection north of Java forms at night due to convergence caused by NCS-generated cross-equatorial northerly flow which is further enhanced by nocturnal land breezes. This phenomena is more intense when it coincides with the active phase of MJO.
|
 |
NCS - Vortex Pattern
|
Streamline : meridional wind at 925 hPa ; Color contour: relative humidity at 700 hPa
|
||
|
Stage 1
|
Stage 2
|
Stage 3
|
|
|
|
|
|
|
Notes:
- Clouds in the northeastern parts of the vortex have a comma-shaped structure.
- The vortex limits the southward progression of the cold surge and the accompanying cross-equatorial flow. Hence, it limits convection over the Java Sea while aiding convective enhancement over the South China Sea.
|
Comma-shaped clouds north of Borneo (red : Cb cloud formation)
|
 |
NCS - Vortex - MJO Pattern
|
Streamline : meridional wind at 925 hPa ; Color contour: relative humidity at 700 hPa
|
||
|
Stage 1
|
Stage 2
|
Stage 3
|
|
|
|
|
|
|
Notes:
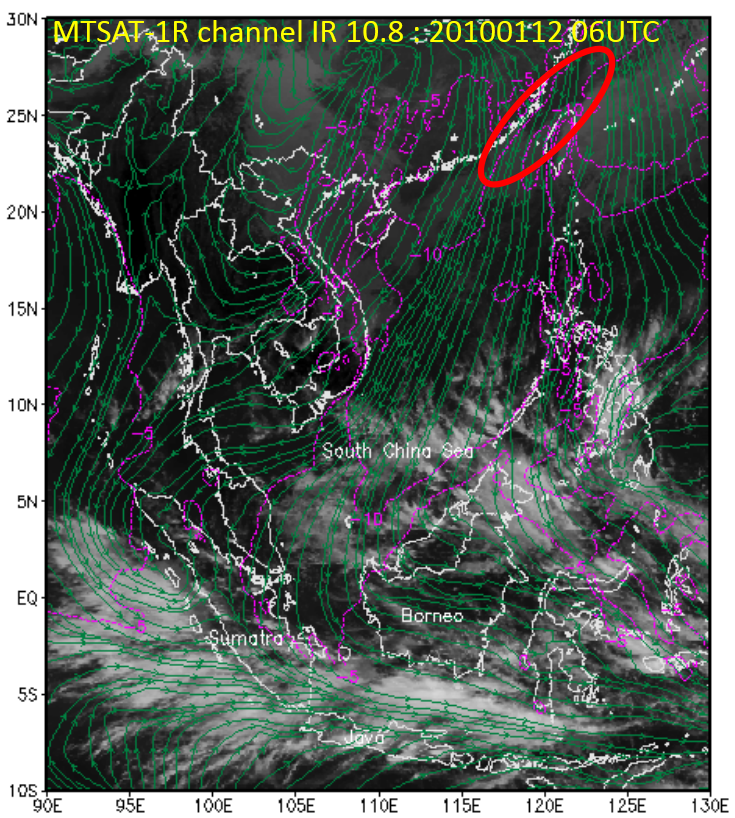
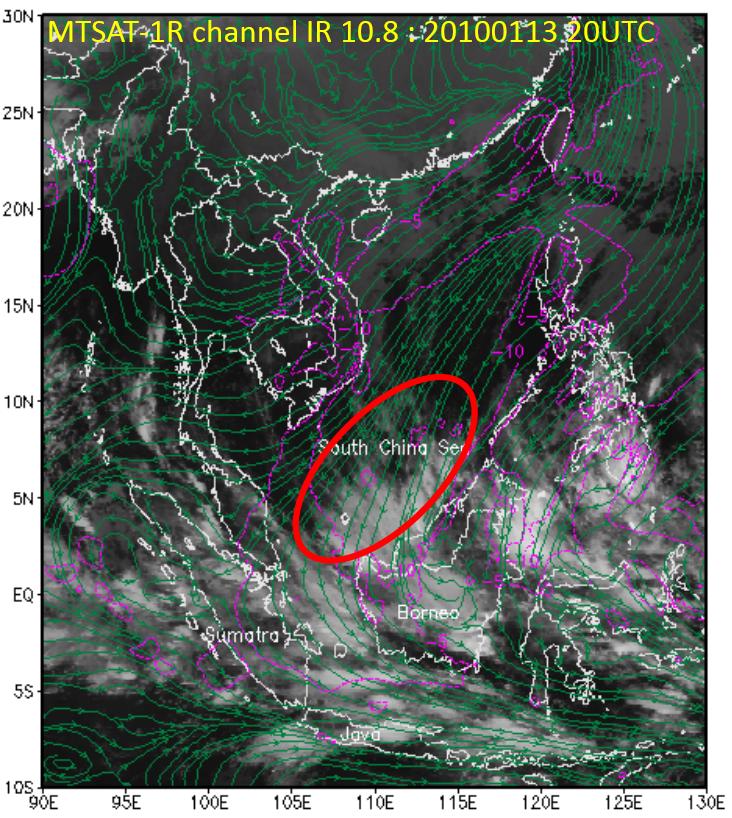
- When combined with a dominant easterly zonal flow, the MJO produces a carrot-shaped cloud structure. Cloudiness associated with the MJO produces a carrot-shaped structure which is also indicated the structure due to dominant eastward zonal flow.
- The MJO inhibits the penetration of the relatively drier air mass to equatorial latitudes.
- As it crosses the equator, the vortex retains the characteristics of a NCS-vortex pattern as more enhanced convection develops on its other side.
|
MCS cloud structure : Carrot-shaped
|
 |
Normally, the diurnal cycle causes deep convection to develop from late afternoon into the evening in mountainous areas, and from evening into early morning in the adjacent plains, as it does in Jakarta. Nevertheless, when additional synoptic forcing from an NCS is present, deep convection develops from morning to early afternoon.
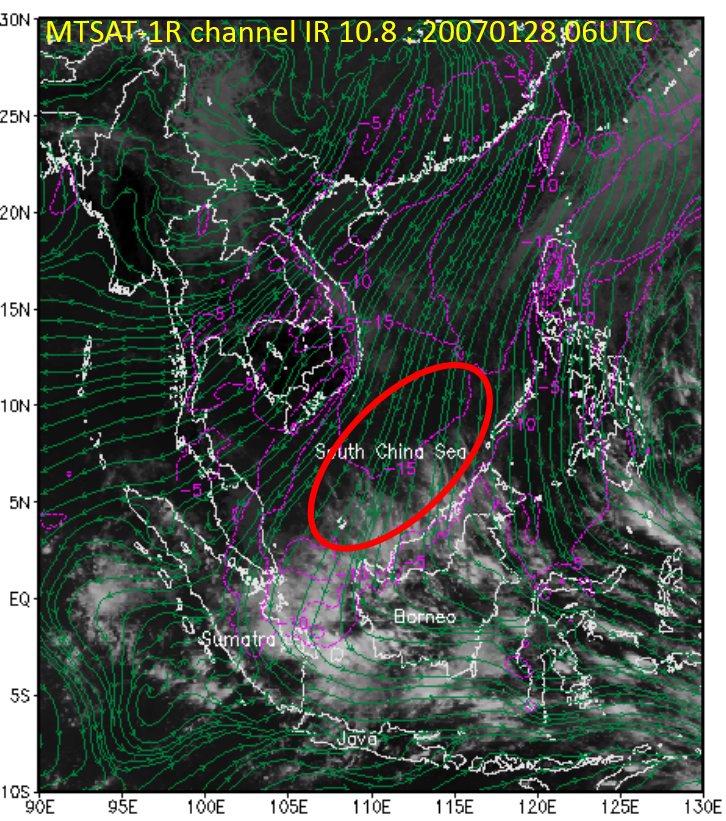
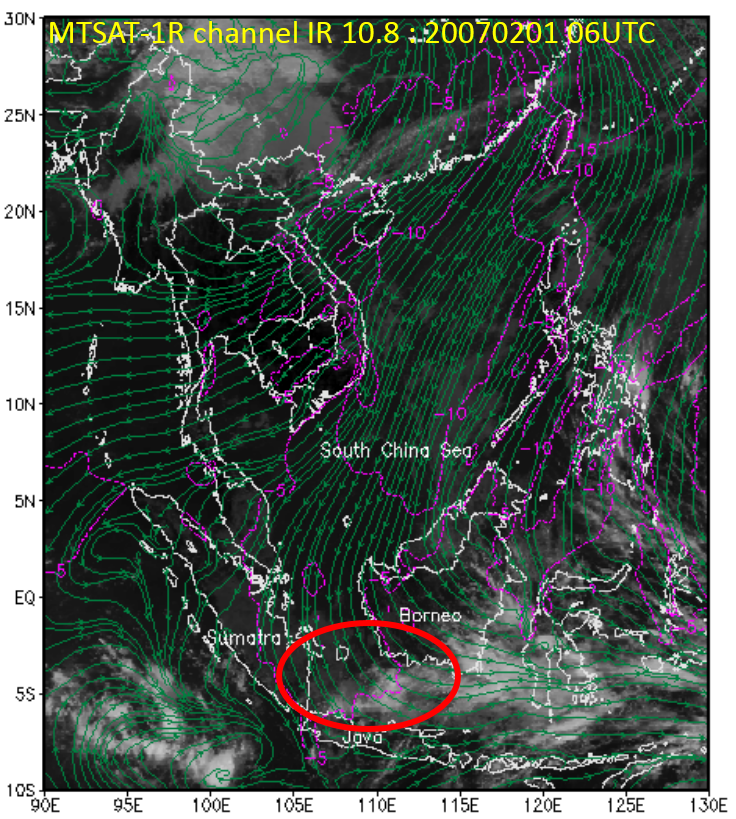
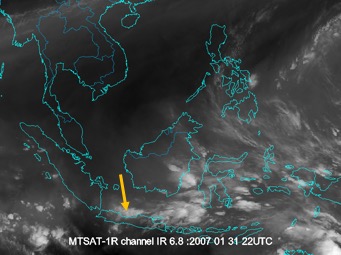
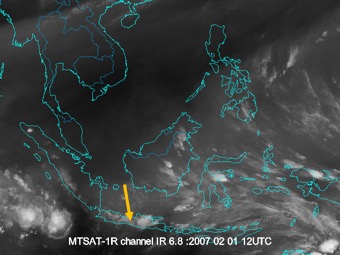
This loop shows the propagation of cumuliform clouds from the South China Sea to the equator starting from 27 January 2007. It is followed by deep convection above the Karimata Strait and reaches the Java Sea on 1 February 2007. The deep convection occurs between morning and early afternoon, leading to torrential rains in the northern parts of Java, including the coastal city of Jakarta and its surrounding areas.

|
Press "Play Button" to see the loop; Satellite images from 27 January 2007 at 00UTC to 1 February 2007 at 23UTC. |
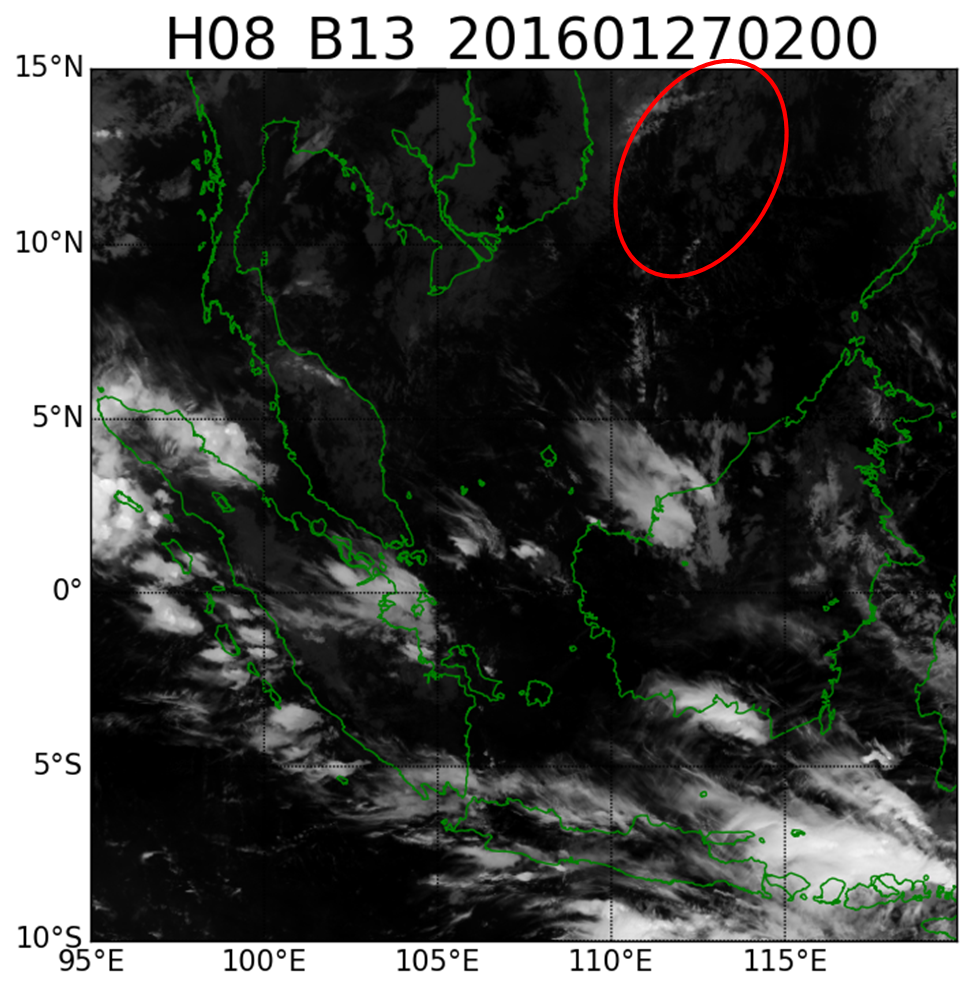
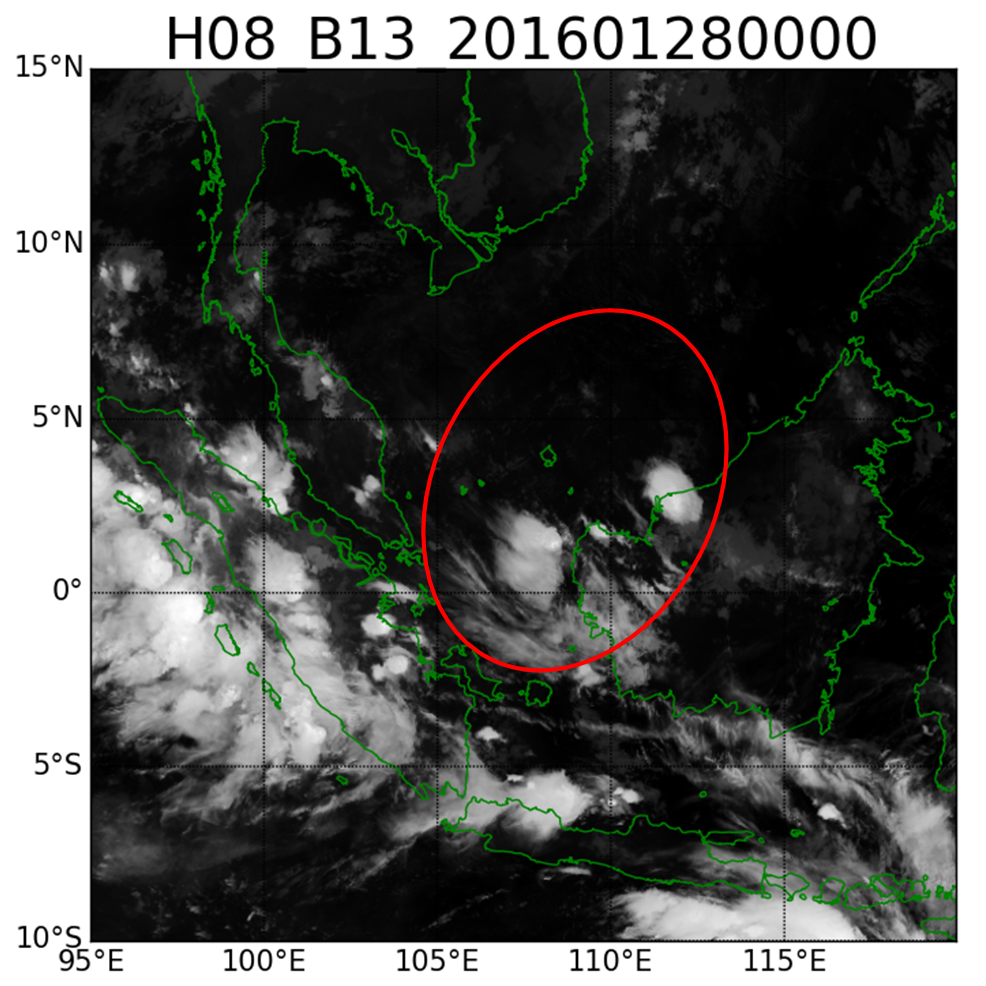
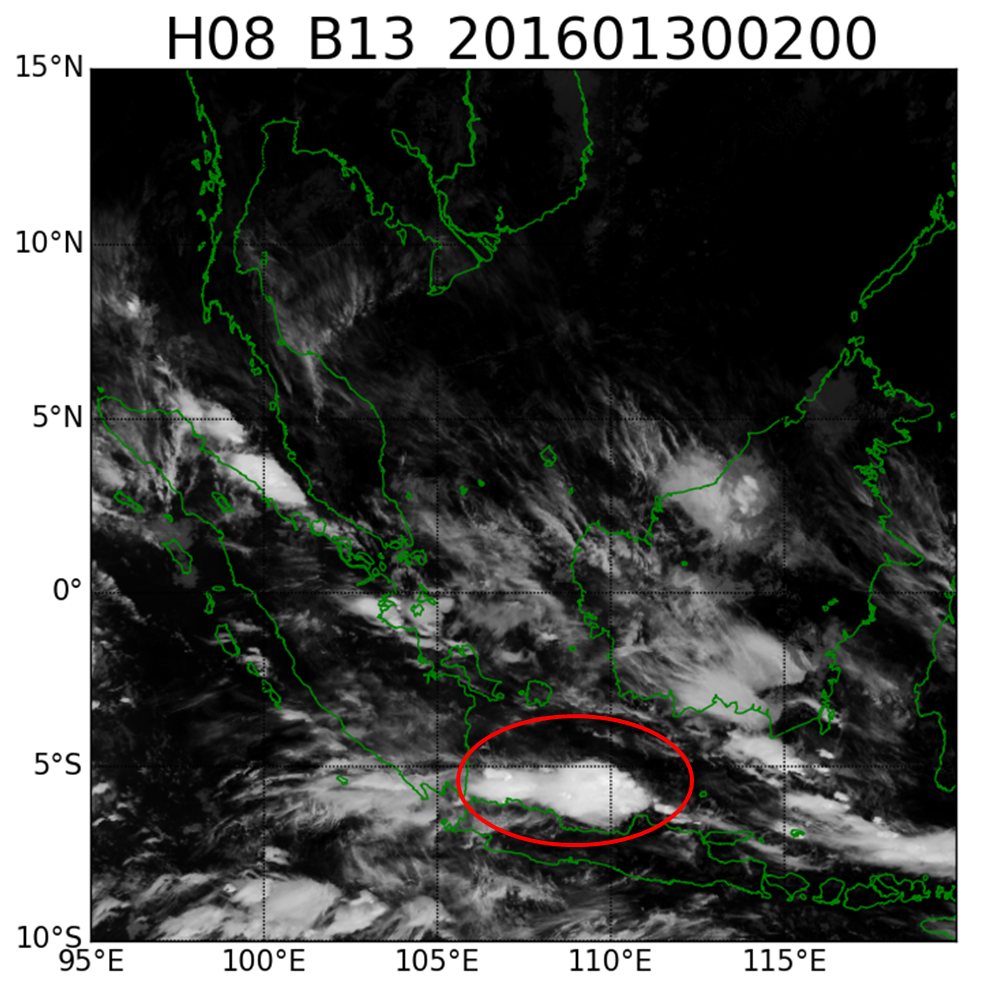
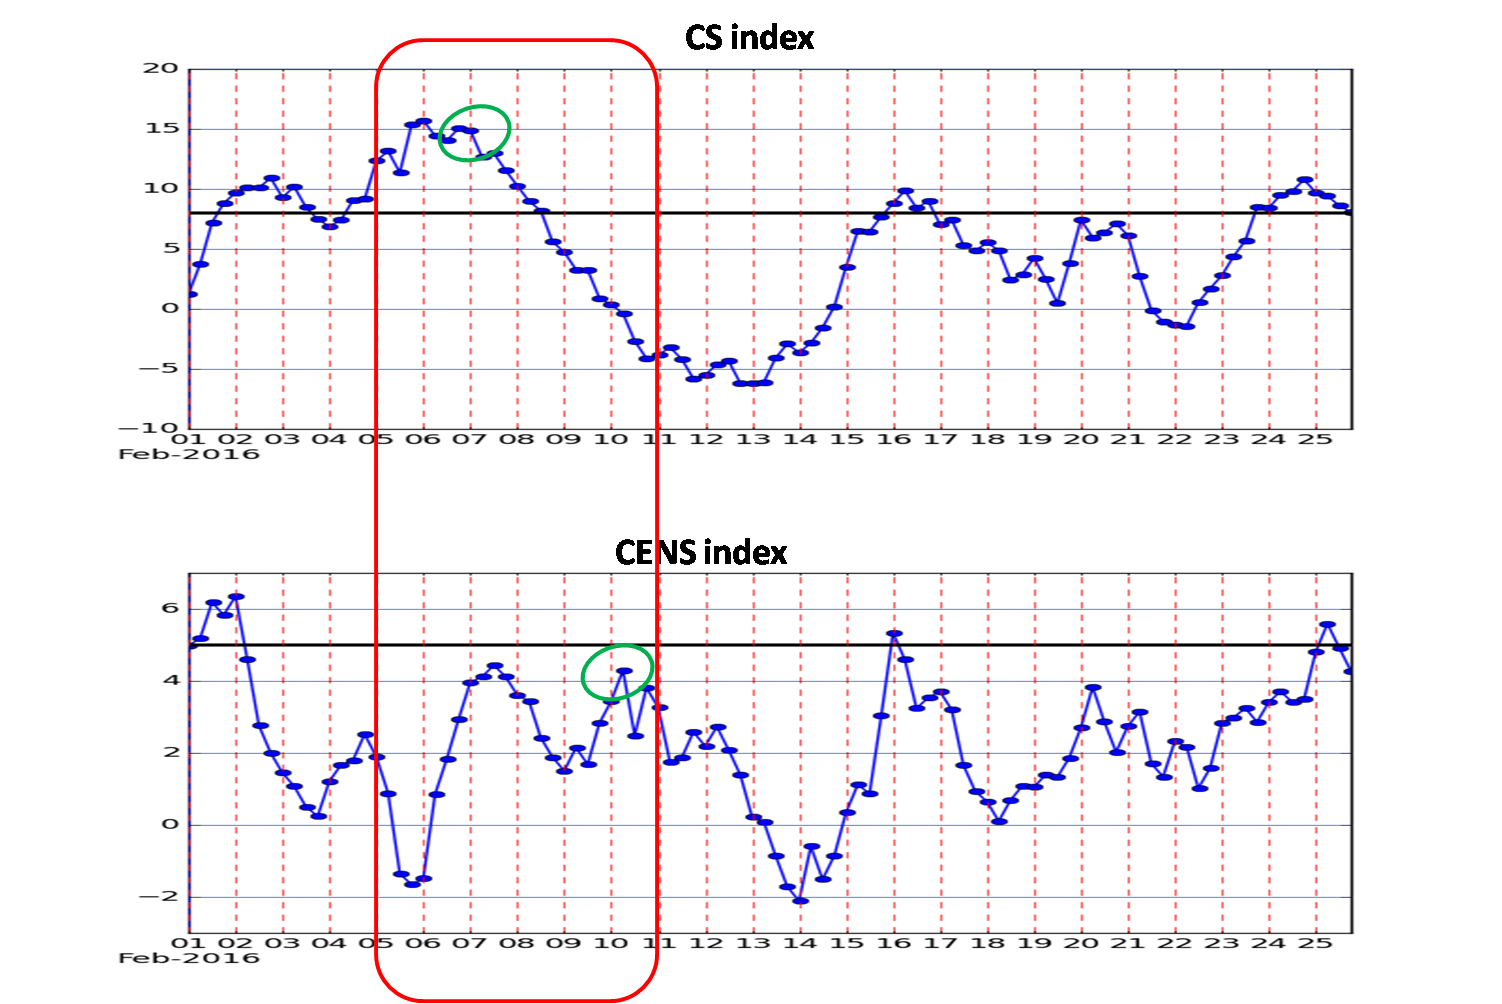
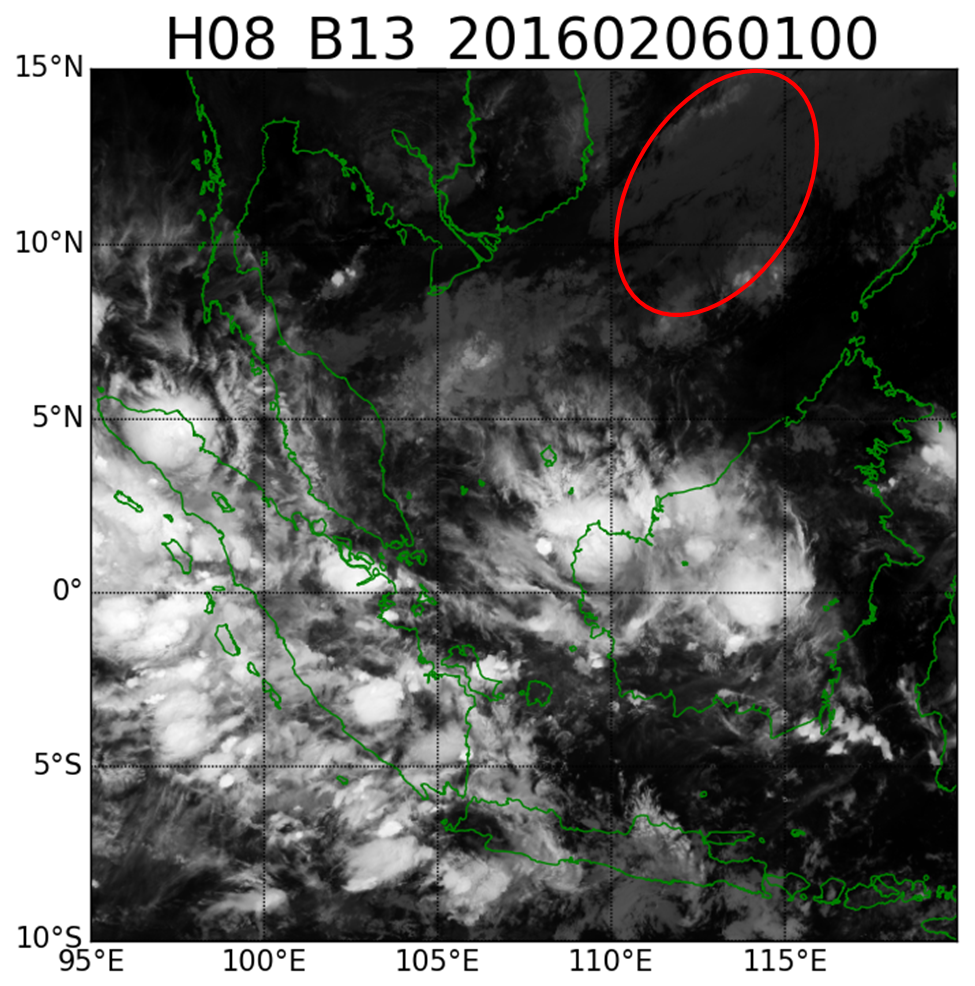
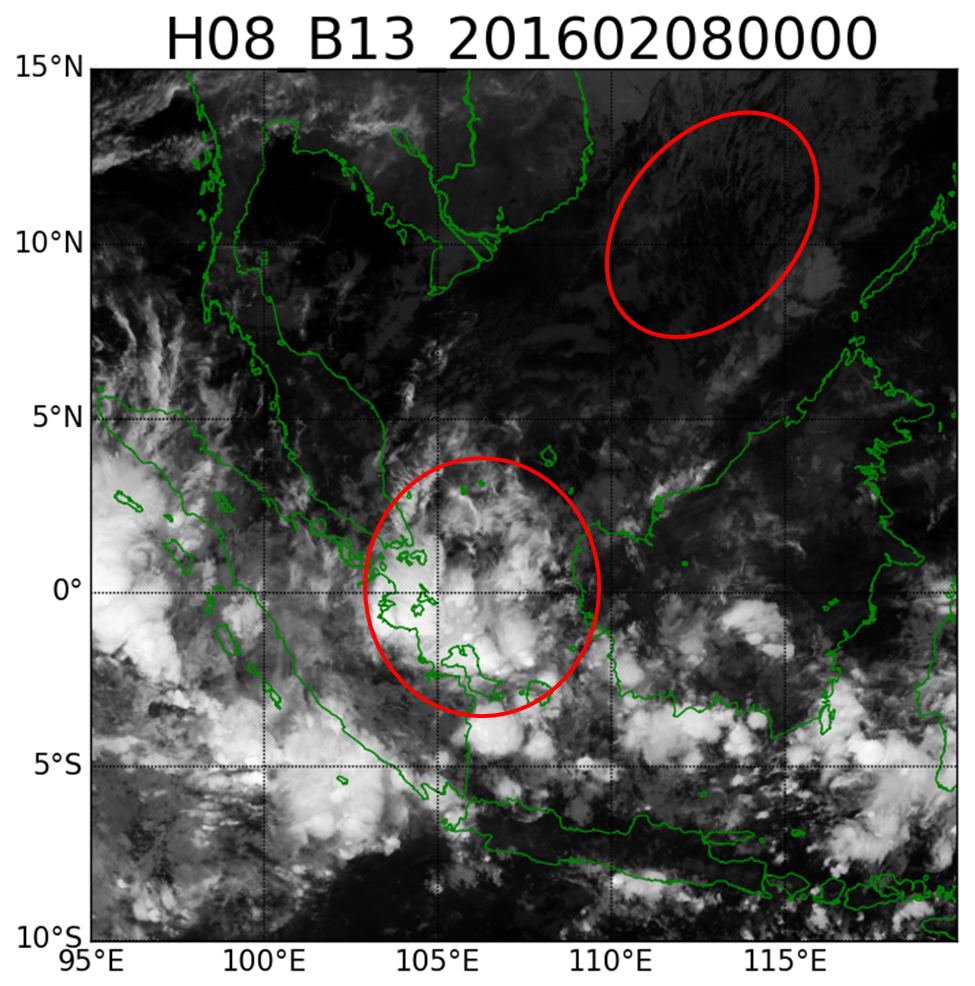
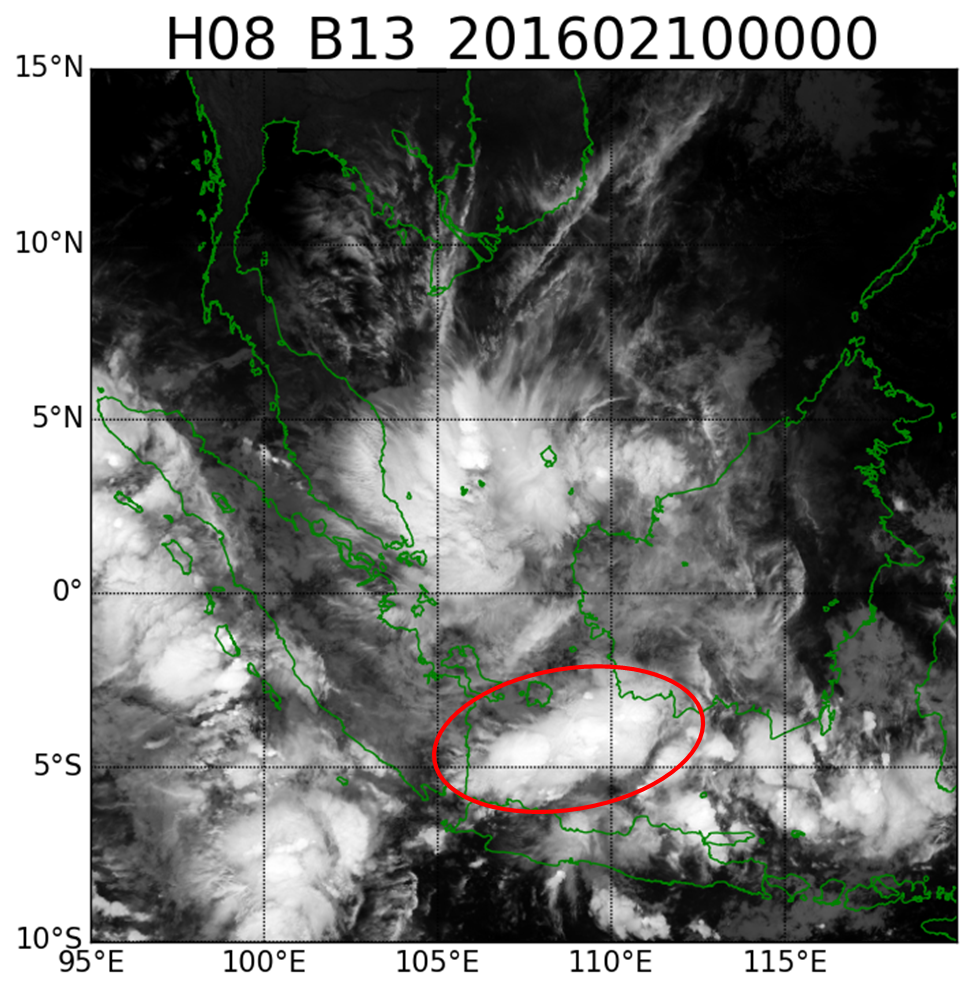
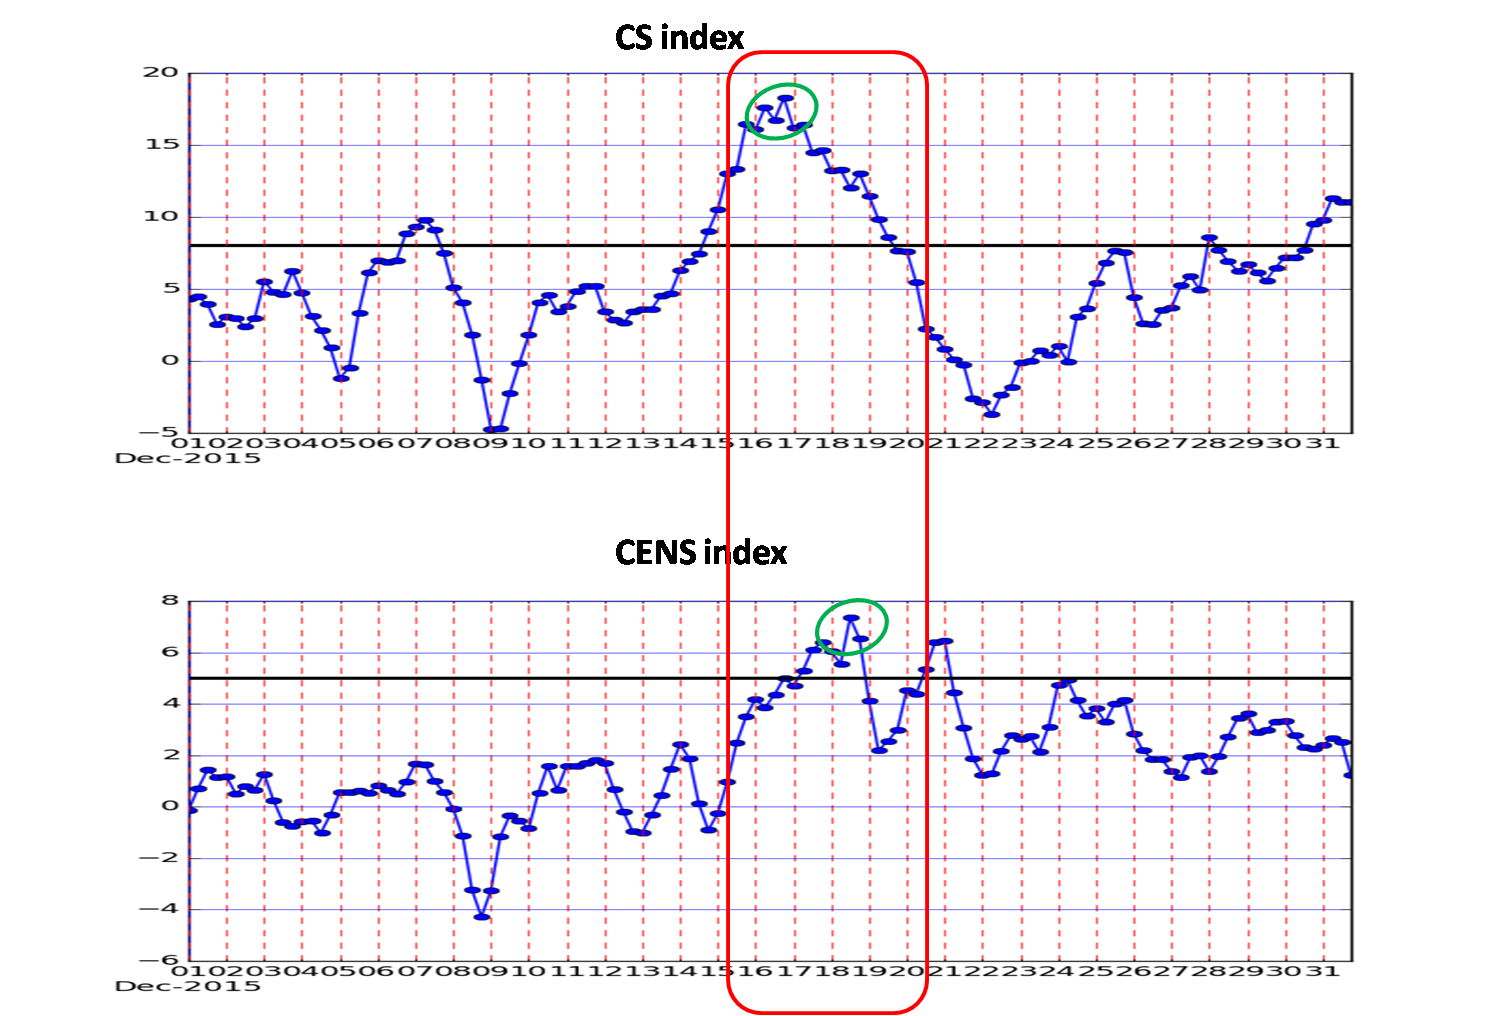
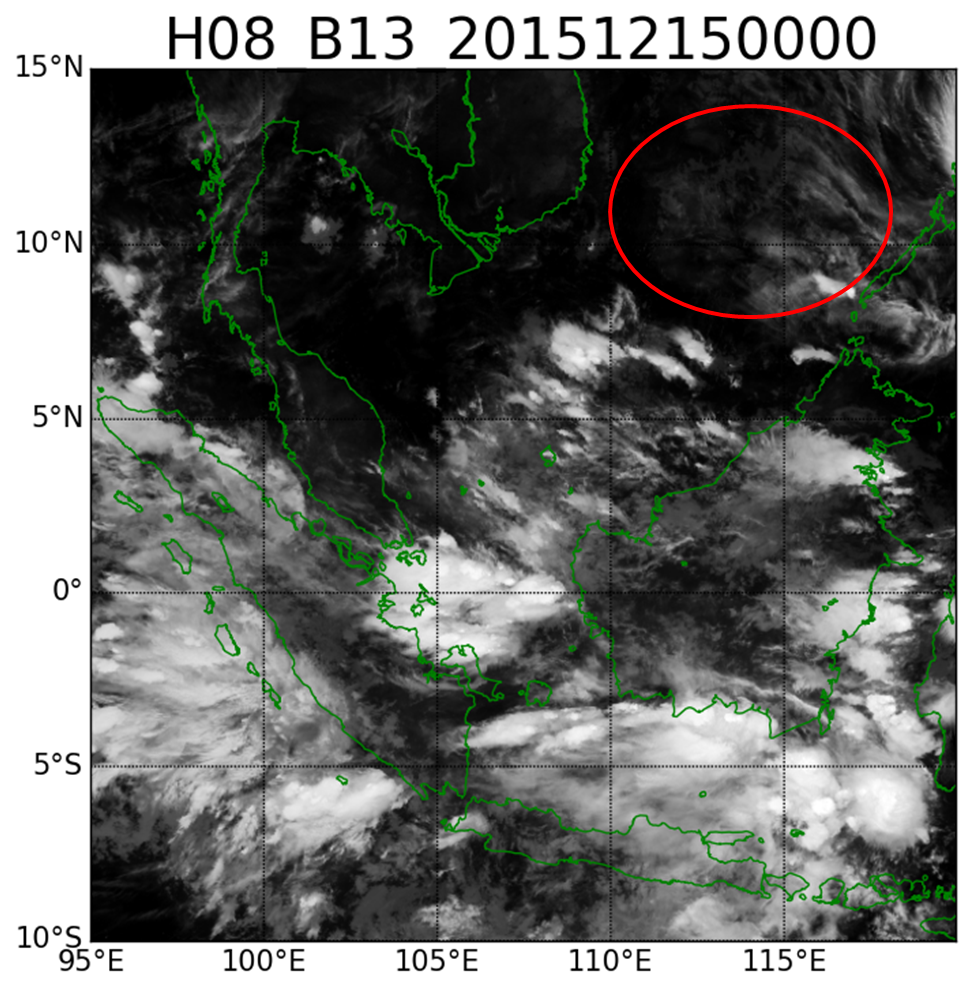
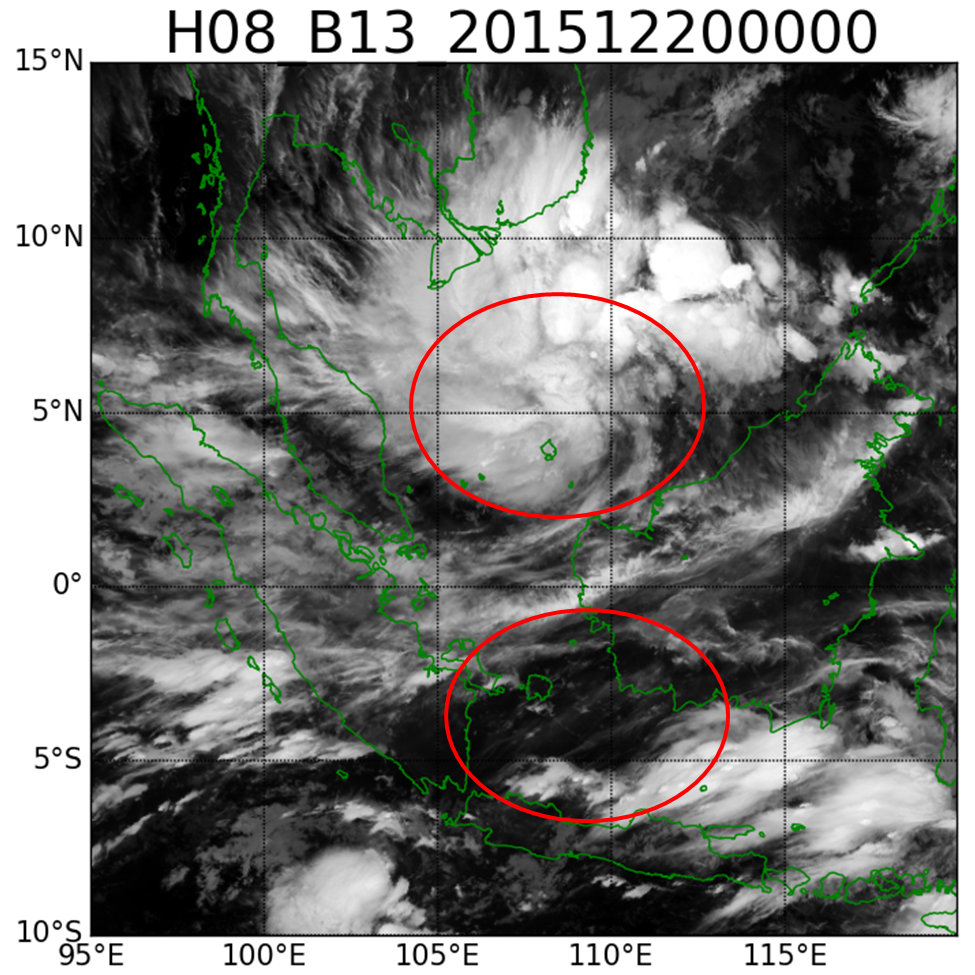
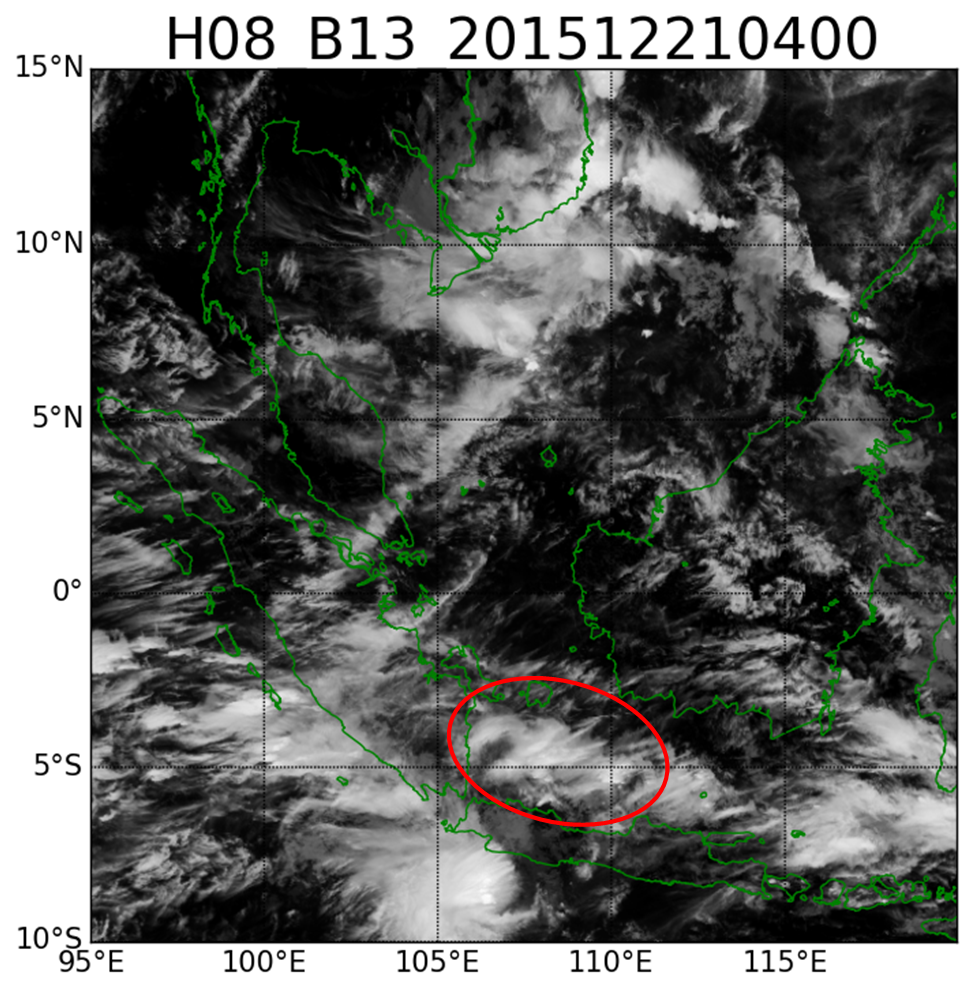
Special Investigation - NCS seen in Himawari-8 imagery
NCS pattern
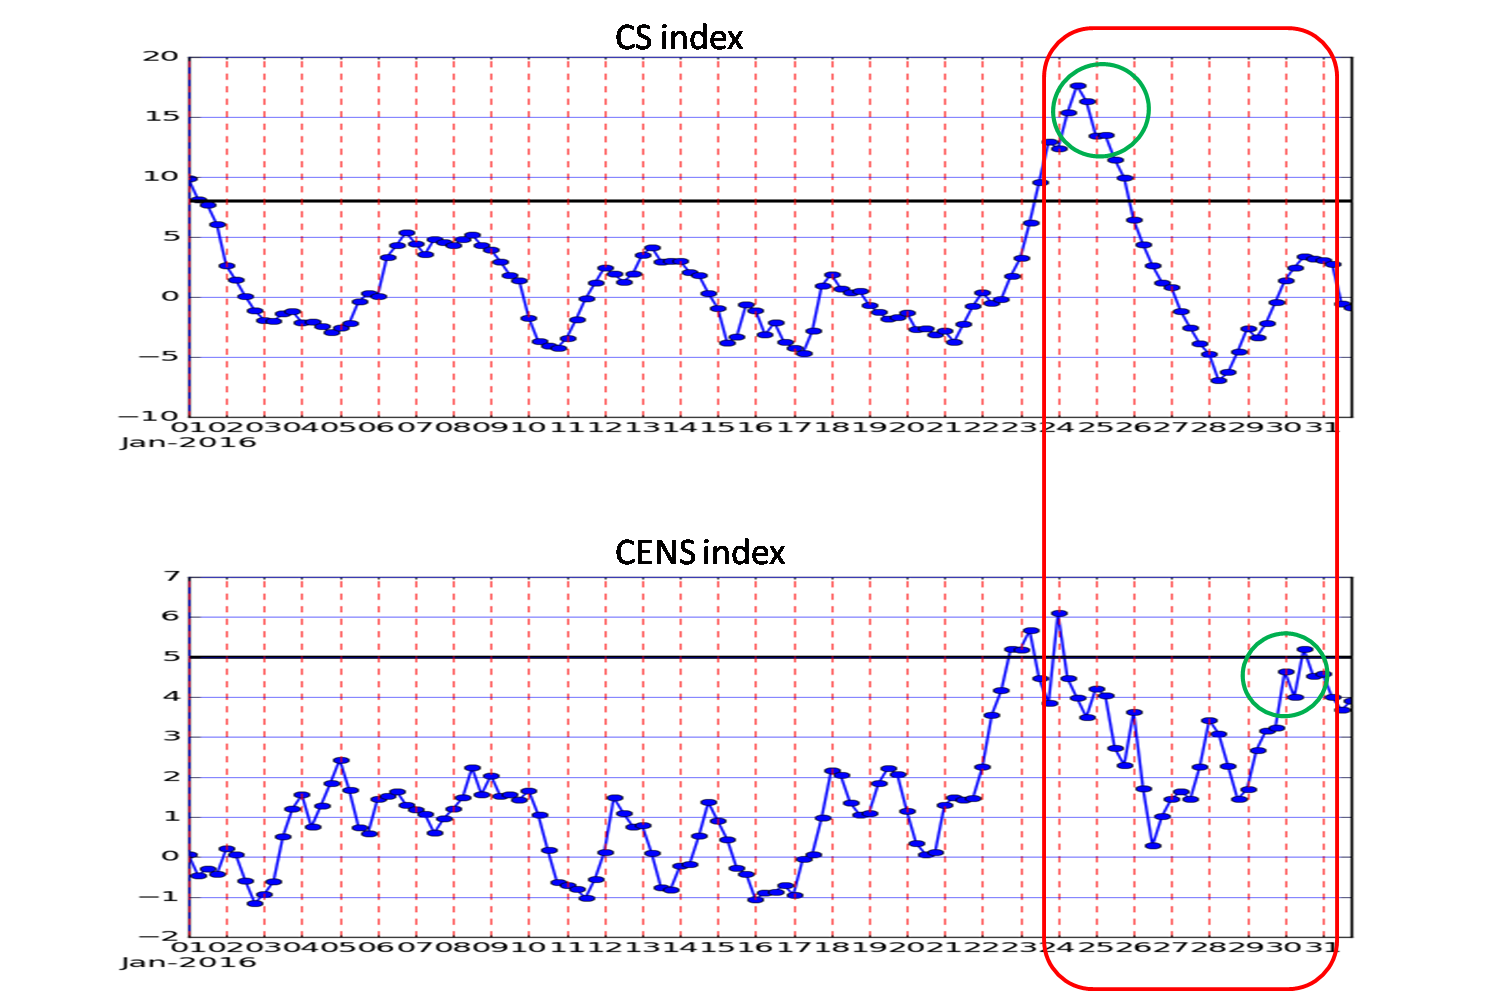 |
||
|
Phase 1
|
Phase 2
|
Phase 3
|
|
|
|
NCS+MJO pattern
 |
||
|
Phase 1
|
Phase 2
|
Phase 3
|
|
|
|
NCS+Vortex+MJO pattern
 |
||
|
Phase 1
|
Phase 2
|
Phase 3
|
|
|
|
Meteorological Physical Background
Introduction
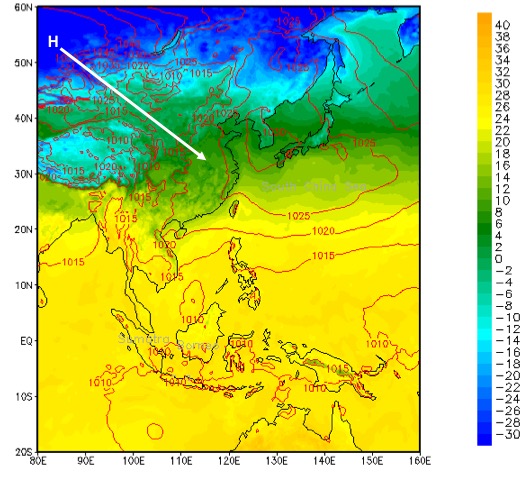
One of the most intriguing aspects of the Asian winter monsoon circulation is the development of Northerly Cold Surge (NCS), which forms when cold air is advected south along the eastern edge of the Siberian-Mongolian High (SMH). The cold surge can reach equatorial latitudes where it manifests as strengthened northerly or northeasterly winds. A corresponding temperature signature may not be present due to the influence warm sea water has on the surge. Depending on the thermodynamic characteristics of the pre-incursion environment, cold surges may also have a substantial impact on convection and rainfall in the tropics.
Broad Overview
The interaction of northeasterly winds with local topography and the dynamic response to the change in latitude contribute to the turning of the winds. In all cases, the surge takes the form of a shallow dome of cold air moving parallel to the contours of terrain elevation. Shallow surges of cold dry air are frequently observed to the east of the major mountain ranges, moving from the mid-latitudes into the tropics.
|
Topography and areas of frequent occurrence of cold surges. The darkest shading indicates terrain elevations above 5000 m above MSL (Modified from Garreaud, 2001).
|
-edit2.jpg)
|
NCS exhibit a transient, gravity wave-like motion caused by a pressure-wind imbalance, which allows a fast propagation of energy from the mid-latitudes to the tropics (Chang, 2005). The NCS has two stages:
- The edge, a pressure surge, travels at a speed of ~ 40 m/s which is much faster than the advective speed and is therefore suggestive of a gravity wave-like propagation;
- The front, a significant drop in dew point that travels at speeds of only ~ 10 m/s
|
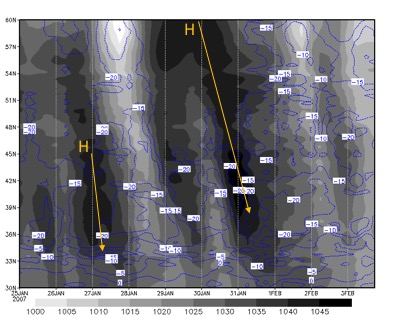
The southward propagation of SMH along 108°E (northern China) from January to February 2007 as a function of latitude. Shaded : mean sea level pressure, contour : dew point temperature
|
|
There is increased moisture transport to the equator during an NCS. This fuels the development of deep convective activity over Indonesia, where moisture convergence strengthens.
Life cycle
An NCS event may last from a few days to a week.
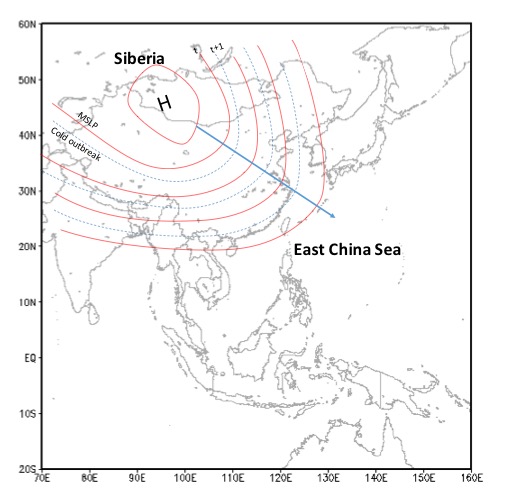
Siberia : Pressure surge outbreaks
The characteristics of cold air outbreaks are closely associated with the formation, intensification, southward movement, transformation and dissipation of the Siberian-Mongolian High. The surge initiates when the Siberian high intensifies above 1045 hPa.
(See: the temperature profile schematic in the chapter on Vertical Cross Sections)
Phase 1: The arrival of the surge
The NCS's arrival at Hong Kong is marked by a dramatic 12 - 24 hour change in synoptic conditions. Wu and Chan (1995) showed that the NCS brings decreased near-surface temperature (around 4-5 °C), decreased humidity (shown by an increase in dew point depression around 1-2 °C), increased surface pressures (approximately +3 hPa), and strong northerly winds of around 5.5 m/s within a period of 12 - 24 hours. Riehl (1968) proposed a large pressure difference between 30°N, 115oE and Hong Kong exceeding 10 mb as the surge forecast criterion of an NCS.
|
Composite variations of surface meteorological parameters measured in Hong Kong during the passage of an NCS. The time frame is from two days before the event to two days after it. Day 0 is the day the NCS arrives at Hong Kong. (a) Deviation of mean sea level pressure from day 0, (b) actual, easterly and northerly components of the surface wind, and (c) surface temperature (solid) and dew point depression (dashed) relative to day 0. The vertical bars in all diagrams indicate the standard errors of the data within the sample. (Adapted from Wu and Chan, 1995)
|
.jpg)
|
Phase 2: NCS propagation through South China Sea
On synoptic time scales, northeasterly cold surges often dominate the low-level circulation patterns over the equatorial South China Sea (SCS). Although cold surge winds are typically dry, they gain moisture while crossing bodies of warm water, thus enhancing the East Asian Hadley Cell together with the strengthening upper-tropospheric flow.
Chang et. al. (2005) devised a cold surge index to define the occurrence of cold surge in this area using the average 925 hPa meridional wind between 110°E and 117.5°E along 15°N. A cold surge event occurs when this index exceeds 8 m/s. Furthermore, based on the magnitude of the meridional wind, the surge is divided into the following categories:
- Weak surge: surge index between 8 and 10 m/s
- Moderate surge: surge index between 10 and 12 m/s
- Strong surge: surge index greater than 12 m/s
Phase 3: Cross-Equatorial Northerly Surge
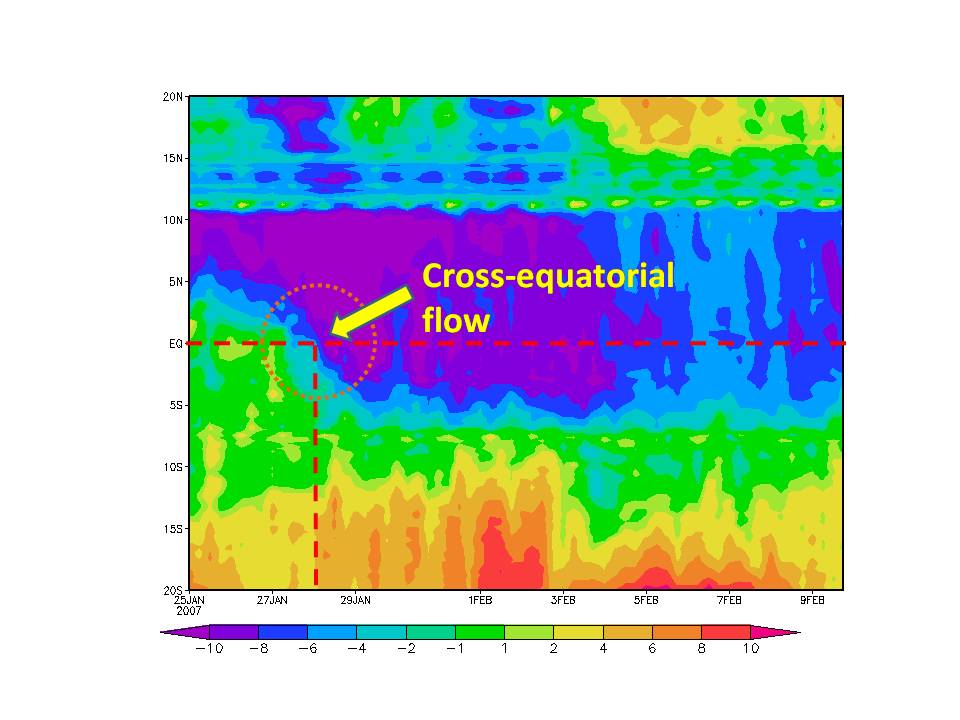
The cold surge can transport a low-level air mass from the mid-latitudes to the equator quite effectively. As this cold and dry air mass (referred to as 'cold tongue') moves into low latitudes, strong surface heat fluxes weaken the cold air anomalies, and the surge may lose its 'cold' character. However, strong meridional winds remain as clear signatures of the surge. This factor is important in for the formation of precipitation over the Maritime Continent. Hattori (2011) defined the Cross-Equatorial Northerly Surge (CENS) index as the speed of the average meridional wind that exceeds 5 m/s in the area (over 105°E - 115°E, 5°S - EQ).
|
The meridional wind along 1085°E as a function of latitude during the 2007 NCS event, 27 January - 1 February 2007. The circled area shows how the strong northerly wind of more than 5 m/s penetrates past the equator and reaches the index of cross-equatorial northerly surge (CENS)
|
|
Soon after the cross-equatorial flow reaches Java, a zonally elongated rain band forms around 5oS - 6oS, 106oE - 119oE. A persistent northwesterly wind near the surface over the Java Sea creates an intensive low-level wind convergence and a strong low-level vertical wind shear over the island, which build up the necessary unstable conditions for organized convection. The diurnal cycle of heavy rainfall in western Java is thus affected by the collision of the NCS with the nocturnal land breeze. A semi-diurnal cycle becomes dominant and the heaviest precipitation develops during the early morning.
Interactions
During its southeastward propagation, the NCS interacts with other synoptic disturbances as follows:
-
Borneo Vortex, which is a closed counterclockwise circulation on the 925 hPa wind field within the area of 2.55°S-7.55°N, 107.55°-117.55°E in the equatorial South China Sea. During surge events, deep convection occurs in association with the blocking of the low-level winds by the terrain in the northern part of Borneo island, which causes a shift of the convection pattern downstream of the converge maximum at 925 hPa. The shift is smaller at 850 hPa because there is less blocking of winds at higher elevations.
Smoothed topography of the area within which the Borneo vortex is identified. The black horizontal bar is the area for the surge index (Adapted from Chang, 2005)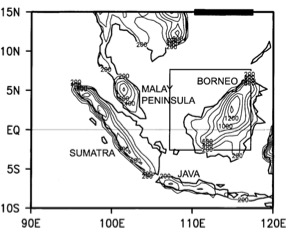
- Madden-Julian Oscillation (MJO) is an eastward movement of large-scale circulation cells oriented in the equatorial (zonal) plane in the troposphere. The MJO is associated with enhanced low-level convergence and ascent in the synoptic scale, while winds in the upper troposphere diverge from the updraft. This circulation is accompanied by enhanced deep convection. Its cycle is split up into eight phases, each of which corresponds to 1/8 of the full cycle. An individual MJO event can last anywhere from 30 and 60 days.
These interactions induce different cloud patterns compared to NCS cases without MJO.
|
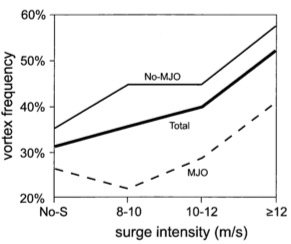
Summary of the percentage of days with no surge (No-S), weak surge (8-10), moderate surge (10-12), and strong surge (>12) that also contain a vortex for all days (total), no MJO days, and MJO days (Adapted from Chang, 2005)
|
|
Interaction with Borneo Vortex (second cloud pattern)
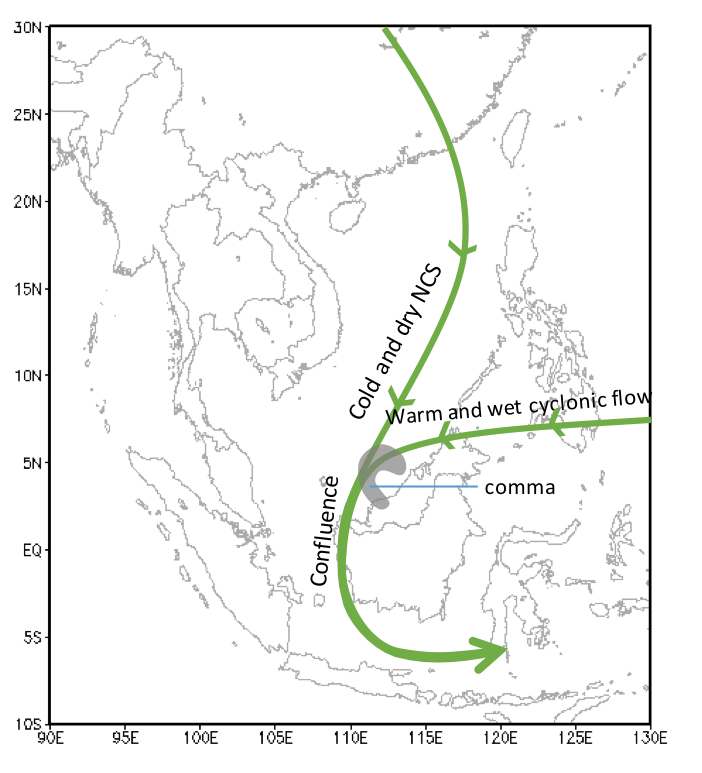
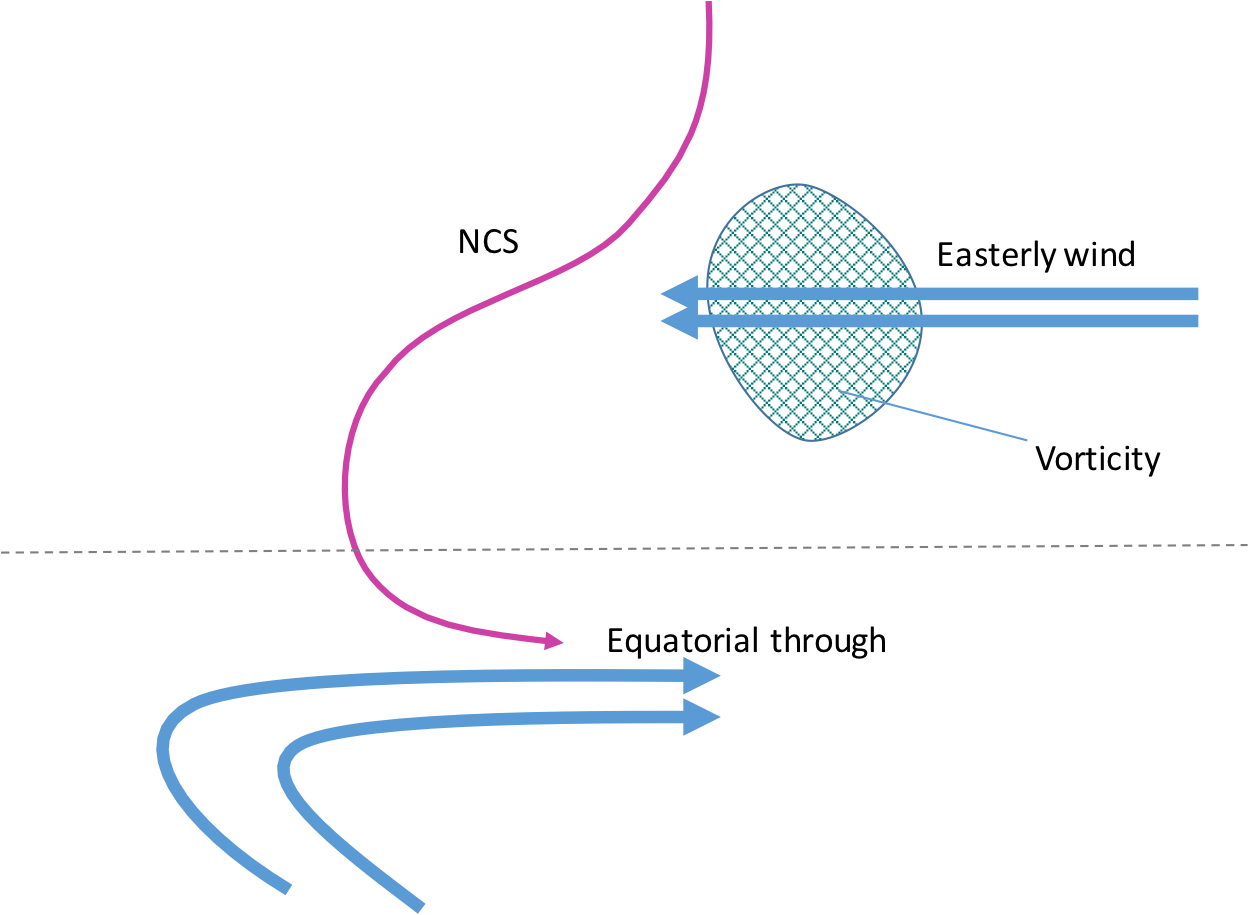
When both surge and vortex are present, the latter deflects the low-level winds. The warm and humid cyclonic southeasterly flow then collides with the NCS (relatively cold and dry) in the northeastern sector of the mesoscale cyclone, generating a comma-shaped cloud structure in the equatorial South China Sea. The frontal confluence generates strong rising motion, which enhances condensation and rain within the comma tail. In the northwestern sector of the vortex, the intense upward motion and rainfall within the comma head are generated by the confluence of the warm, humid easterly flow that occurs ahead of cyclones, as well as the cool and dry northeasterly surge. Thus the strength of deep convection over the equatorial South China Sea becomes much stronger as the presence of the surge increases the strength of the vortex.
|
Schematic showing the formation of the Borneo Vortex at the confluence of NCS and easterly wind.
|
Comma-shaped structure in Borneo Vortex
|
|
|
Interaction with MJO and the Borneo Vortex (third cloud pattern)
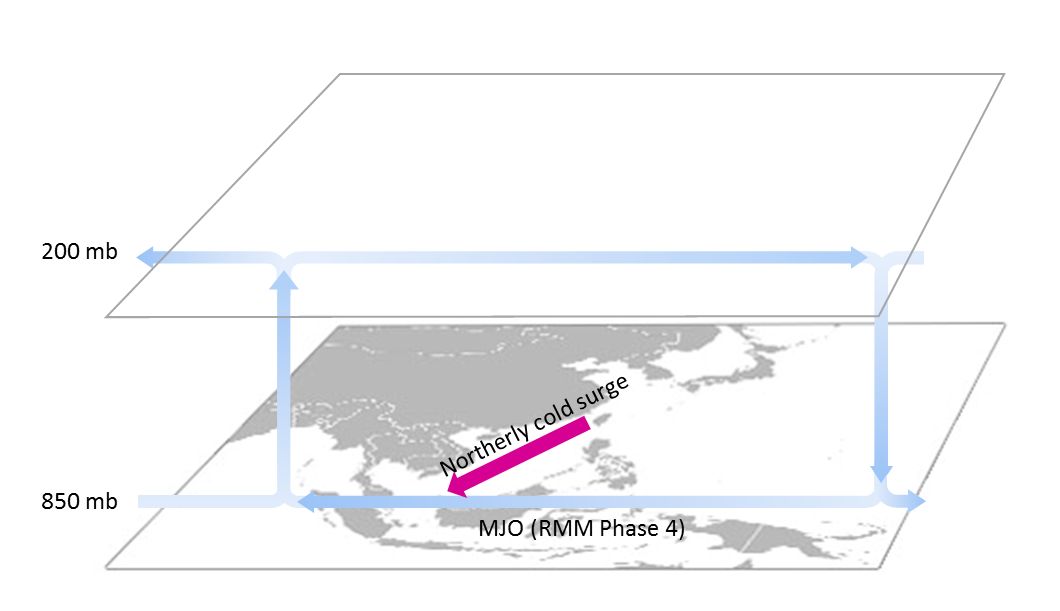
When these three synoptic disturbances occur simultaneously, the MJO circulation pattern inhibits the northerly wind surge's development and southward progression, generating a carrot-shaped cloud structure around the Java Sea. The Borneo vortex keeps the NCS-vortex cloud pattern while enhanced convection develops north of the equator. Further, the MJO circulation reduces the NCS frequency subsequently.
|
Schematic about NCS's interaction with MJO
|
|
Seasonal Variability
Between boreal summer (June to August) and boreal winter (December to February) the maximum heating moves from South Asian region to the Maritime Continent - Northern Australian region. This seasonal variation changes also the thermal circulation. The Winter Asian Monsoon circulation encompasses a large meridional domain causing the tropical region to have a strong interaction with the extratropical region. The extratropical component of this circulation is the NCS. Chang (2005) showed that, typically, about one or two NCS cases occur per month during the boreal winter.
Key Parameters
The key parameters in using NWP to examine the propagation of northerly cold surges (NCS) from mid-latitudes to the maritime continent are:
-
Mean sea level pressure:
The first sign of NCS initiation is rise of the mean sea level pressure to over 1045 hPa in northern China. After that, the pressure continues to rise southeast of it. When a 10 hPa pressure gradient between Hong Kong and 30°N, 115°E is detected, it indicates the arrival of a NCS in Hong Kong.
-
Temperature:
A surface temperature drop around 5°C within 24 hours is considered the other sign of an NCS occurrence in Hong Kong. 4-6 days after this occurs, a severe weather warning can be released and heavy precipitation expected around eastern Sumatra and western Java.
-
Meridional wind at 925 hPa:
The cold surge's progress over the South China Sea and the equator is marked by a strengthening of the meridional wind towards southeast.
-
Relative humidity:
At the mid-levels, around 700 hPa, humidity contours will show the boundary of dry air protruding south almost to the equator.
-
Temperature advection:
Cold advection associated with NCS occurs along the coastline of southern China.
-
Zonal wind:
Strong zonal winds from opposite sides of equator may help in building a vortex. The Borneo vortex exists in 60 % of NCS cases.
-
Vorticity:
Combined with the NCS, the vorticity advection of the easterly winds provides favorable conditions for the formation of the Borneo vortex.
-
Geopotential height:
If there is a sufficient amount of vorticity and a low geopotential height contour in northeast Borneo, the Borneo Vortex is likely to form.
Mean Sea Level Pressure and Surface Temperature in Northern China
|
18 January 2010, 13UTC. contour: MSLP (mb)
|
|
|
|
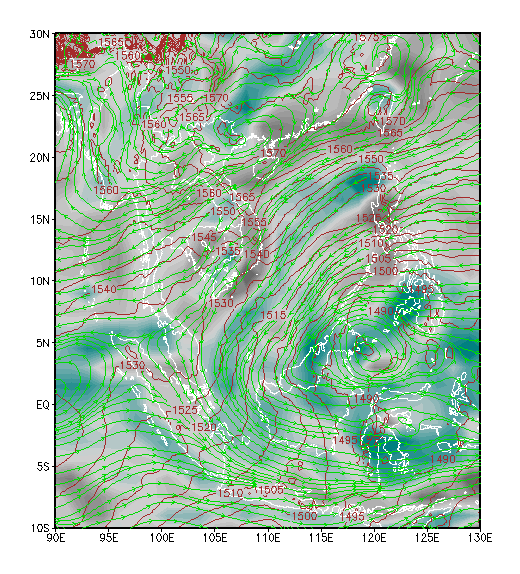
Streamline and Isotach at 925 hPa (classical NCS or meridional case)
|
01 February 2007 06UTC. MTSAT IR1 channel.
Green: Streamline (m/s); magenta: Isotach >=5 m/s at 925 hPa |
|
|
|
Humidity at 700 hPa and Temperature Advection at 925 hPa
|
28 January 2007 06UTC. MTSAT WV channel.
Blue: Humidity at 700 hPa (%); red : cold advection (°C) |
|
|
|
Geopotential height, Streamline and Vorticity at 850 hPa (vortex cases)
|
17 January 2010. MTSAT IR channel.
Brown: Geopotential height (m); teal: Vorticity ; green: Streamlines at 850 hPa |
|
|
|
Typical Appearance In Vertical Cross Sections
The following NWP parameters describe the vertical structure of the NCS.
-
Temperature:
Once the Siberian high intensifies over 1045 hPa, cold air is transported to the southeast.
-
Relative Humidity:
As an NCS propagates towards the equator, it collects moisture from the ocean via enhanced vertical moisture fluxes. Moisture convergence is enhanced in the SCS by the presence of the Borneo Vortex.
-
Meridional Wind (v):
The strengthened and persistent northerly flow near the surface enhances the diurnal cycle in Java Island and the surrounding areas. Due to its topography, Java acts as the southern boundary of this strong cross-equatorial flow.
-
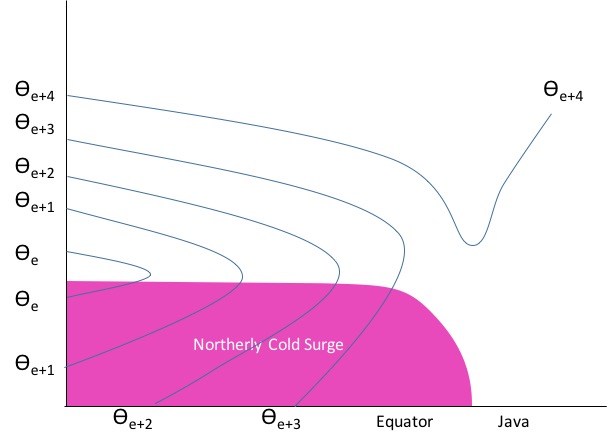
Equivalent Potential Temperature (Θe):
Conditionally unstable atmosphere induced by the strong cross-equatorial flow can be seen in the vertical structure of Θe.
-
Meridional Moisture Transport (qv):
The strengthening of meridional transport of low-level moisture due to cross-equatorial flow during an NCS event enhances convection in the Java Sea. The resulting precipitation amounts are higher than the amount suggested by total precipitable water.
-
Vertical Motion (omega):
NCS affects the diurnal cycle in Java island. Vertical motion occurs at sea in nighttime, and during the day it occurs inland due to local topography.
Two examples are shown here. The one over the Atlantic Ocean with all the typical features of a cold front and the other over is a sub-tropical example typical of fronts over South Africa.
Diagonal Vertical Cross Section
|
Place of cross section
|
|
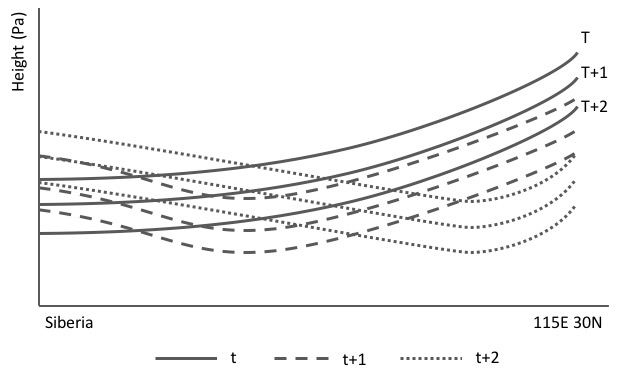
Temperature profile
|
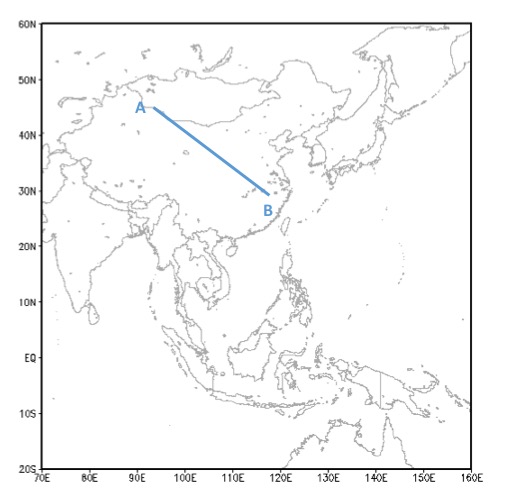
Temperature profile from Siberia (45°N 92°E) to Northeast China (30°N 115°E) after NCS initiation.
color contour: Temperature (°C); grey shading: topography |
|
|
|
Meridional vertical cross section
|
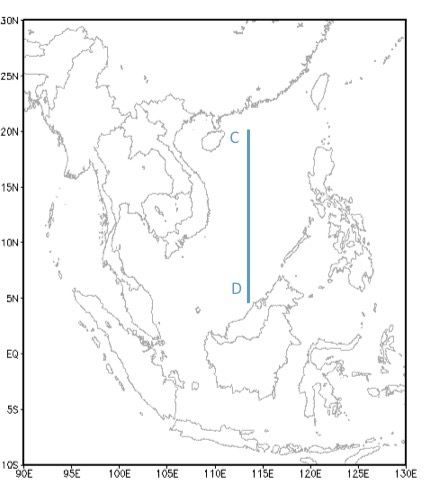
Place of cross section
|
|
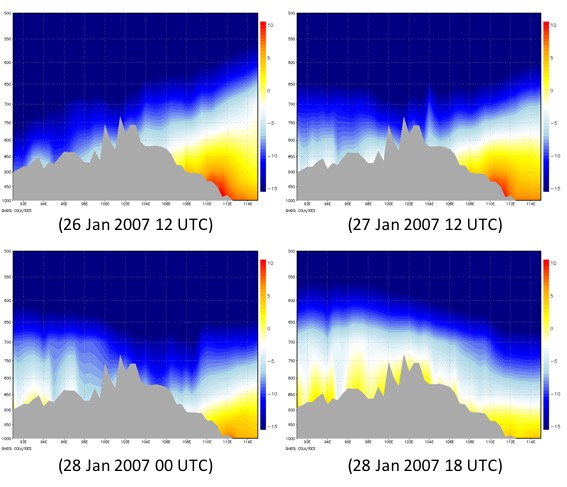
Relative Humidity and Vorticity
|
Comparison of NCS events, 30 January 2007 (left column) and NCS + Vortex, 18 January 2010 (right column). Lon: 113°E.
Shaded :RH; teal: vorticity |
|
|
|
|
|
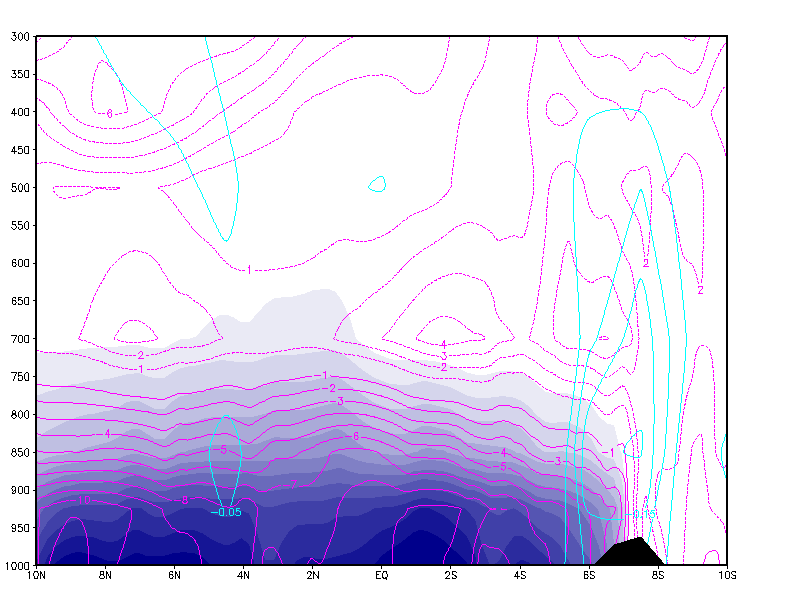
Meridional Wind and Equivalent Potential Temperature
|
Place of cross section
|
|
|
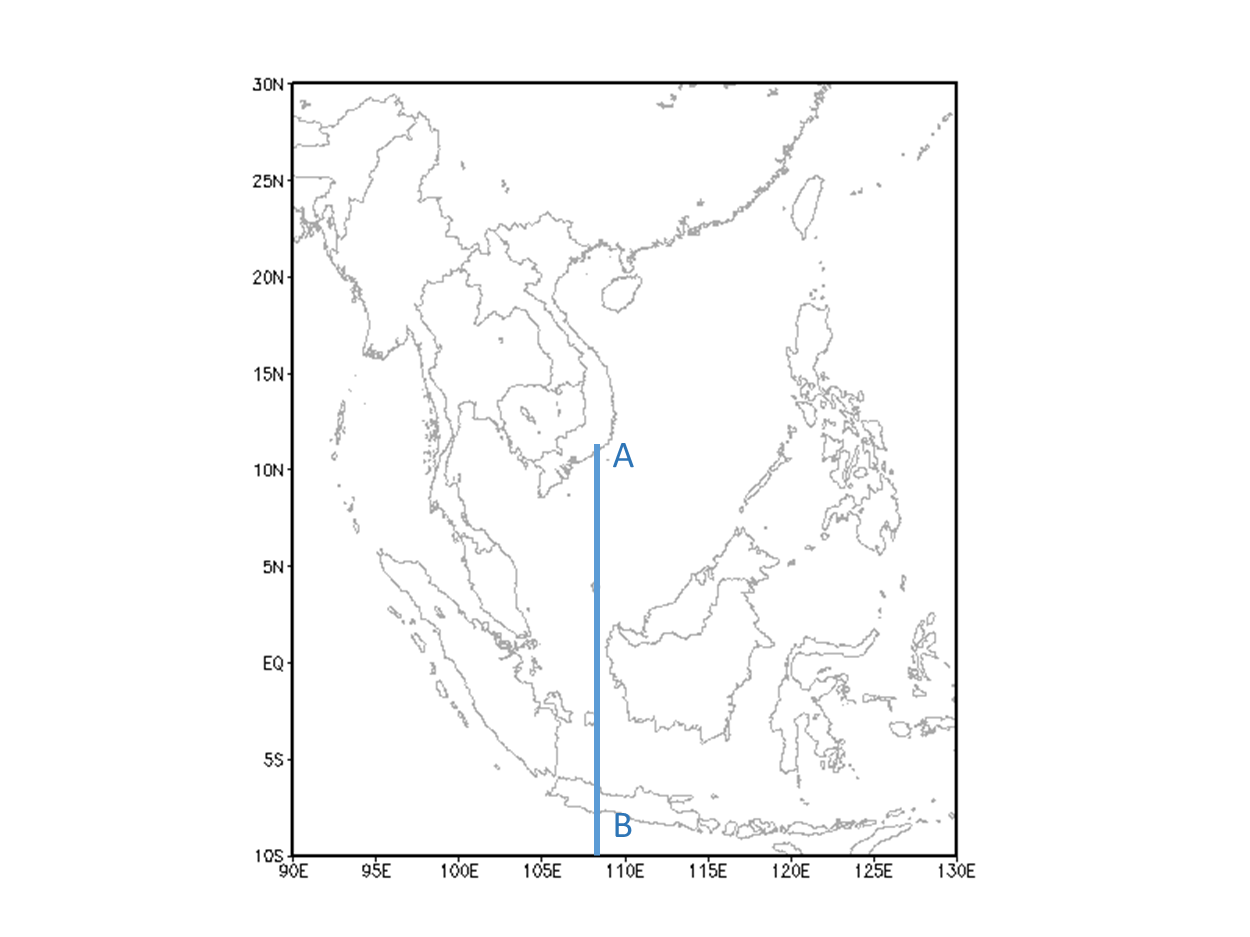
Lon: 108°E. Meridional wind (m/s); black: Equivalent Potential Temperature (Θe, °C)
|
|
|
.gif)
|
Meridional Moisture Transport and Vertical Motion
|
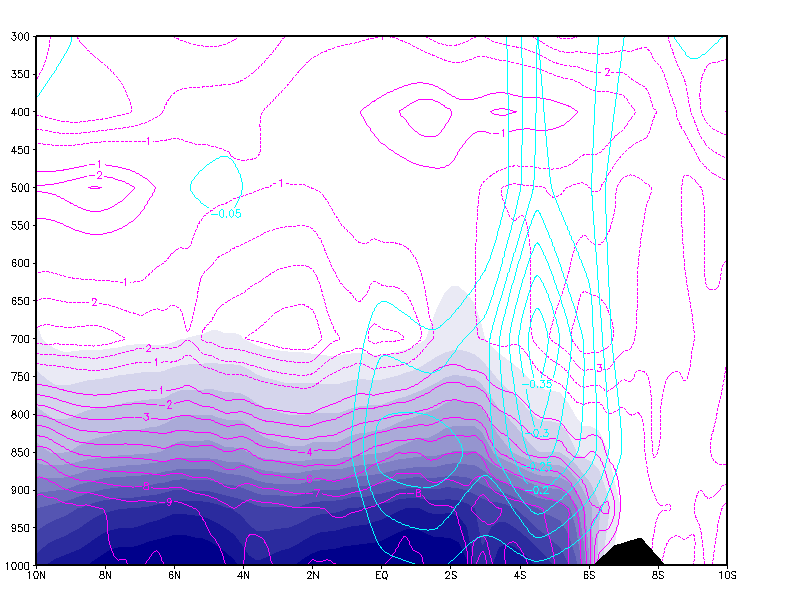
Lon. 108°E.
Cyan: vertical motion (pa/s); shaded: meridional moisture transport (g/kg*m/s), magenta: meridional wind (m/s). 31 Jan 2007, top: night time, bottom: day time |
|
|
|
|
|
|
|
This animation shows a time-latitude cross section of the propagation of meridional track wind and relative humidity during an NCS event.
|
Cross section for the loop.
|
|
|
|
|
|
Press "Play Button" to see the loop; 25 Jan 2007/00 UTC - 09 Feb 2007/18 UTC Vertical Cross Sectio: Top: Along track Wind Speed (m/s); Bottom: Relative Humidity (%). |
Weather Events
Principal weather events following the strong cross-equatorial flow are heavy precipitation and wind gusts. Many areas also experience floods or landslides.
| Parameter | Description |
|---|---|
| Wind | Strong wind gusts occur in west to central Java leading to falling trees and damaged houses. |
| Precipitation |
In the western part of Java, the normal diurnal cycle shows deep convection from late afternoon to evening in mountainous areas and from evening to early morning in flat areas like Jakarta. The NCS changes that normal diurnal cycle behavior and triggers deep convection induction from early morning to early afternoon, which leads to persistent heavy precipitation.
Orographic lifting of the air against the mountain range in West Java, particularly in Jakarta, is caused by the northerly flow. The lifting is responsible for above normal heavy precipitation. |
The presence of this strong cross-equatorial flow in the Maritime Continent is a dominant factor for anomalous weather events in the Java Sea, particularly in the western and central parts of Java and southern part of Sumatra. These early morning to early afternoon rainfall events have been observed in both the classic NCS pattern and the NCS+MJO pattern. Only when the cross-equatorial flow is particularly strong does it affect the southern part of Sulawesi as well.
Weather event on 1 February 2007
|
|
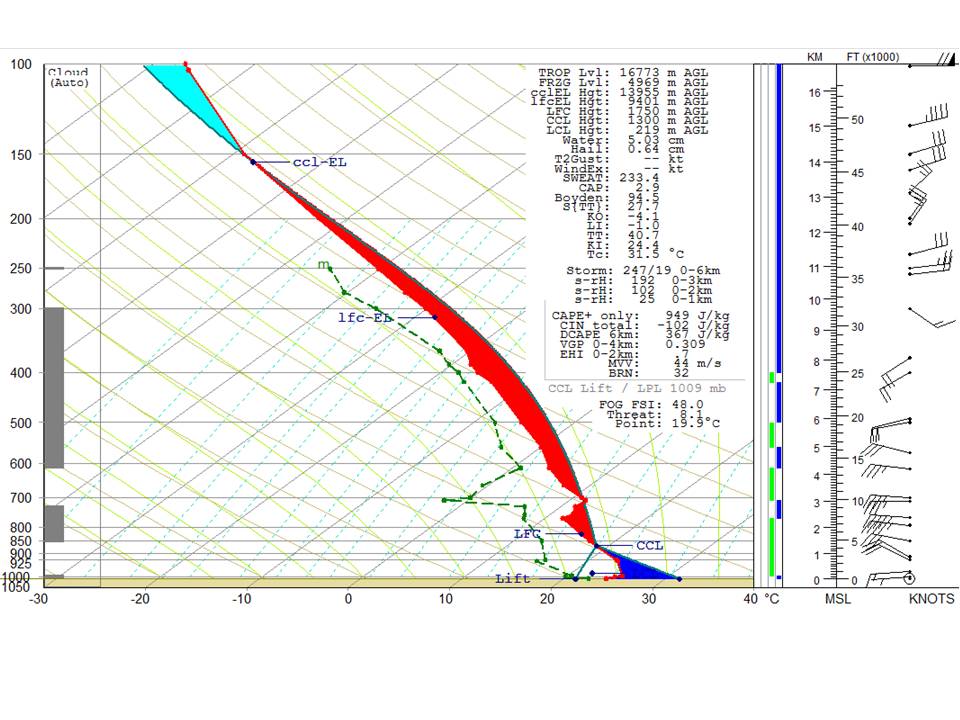
The Skew-t diagram above shows the vertical profile of the troposphere at the Soekarno-Hatta Meteorological Station, Cengkareng, in the northwest of Jakarta. The troposphere is conditionally unstable and indicates a strong convective potential, with the base of Cb clouds at 850 hPa. There is a strong wind shear in the upper troposphere, where the 20-knot southwesterly wind at 400 hPa turns into a 45-knot northeasterly wind at 150 hPa.
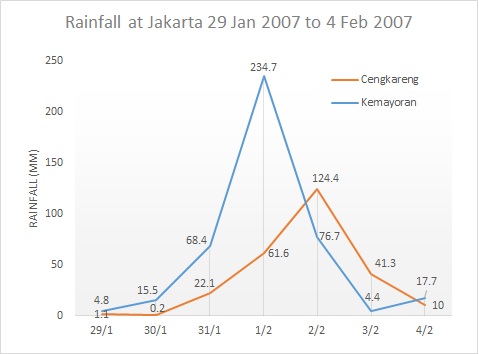
The graph of rainfall at Jakarta shows the plot of daily rainfall data that was observed from 29 January 2007 to 4 February 2007. The heavy rainfall (more than 50 mm/day) was recorded at the Kemayoran station from 31 January to 2 February 2007. On 1 February, it reached the highest point of 234 mm in a day, close to Jakarta's monthly rainfall average of 300 mm. Meanwhile in Cengkareng, heavy rainfall was observed from 1 to 2 February 2007. These persistent torrential rains measured in two stations located in Jakarta verified that the low-level moisture transport brought by the strong cross-equatorial northerly surge affected the diurnal cycle in the western part of Java.
|
Another way to describe the 2007 NCS case is with a meteogram.
|
|
|
|
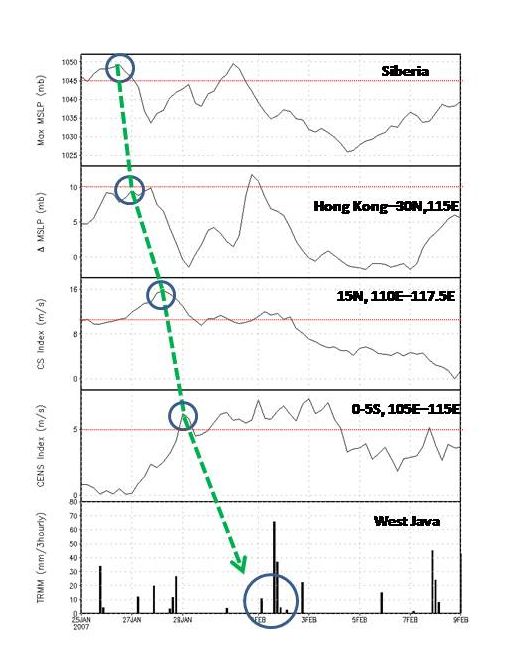
The meteogram displayed above represents the propagation of the early 2007 NCS case, from its outbreak in Siberia, across the South China Sea and far south to West Java. It shows the thresholds of the relevant NWP parameters day by day, making it a useful tool for forecasters in identifying the characteristics of a NCS event, and in keeping track of its southward propagation. A severe weather warning would be issued when the pressure gradient between Hong Kong and 30°N, 115°E reaches the threshold.
As shown here, the surge episode started on 26 January 2007 (blue circle line in panel 1) showed that the MSLP in Siberia reached more than 1045 hPa. Panel 2 shows the pressure gradient between Hong Kong and 30°N, 115°E which reached around 8 mb by 27 January 2007 (blue circle) and confirmed that the center of high pressure had propagated southeastward. The third panel shows that the cold surge index was reached on 28 January 2007 (blue circle), which confirmed the strengthening of northeasterly wind in the South China Sea above 8 m/s. The surge finally crossed the equator on 29 January 2007 with northerly wind exceeding 5 m/s. This led to the heaviest precipitation occurring in West Java on 1 and 2 February 2007.
|
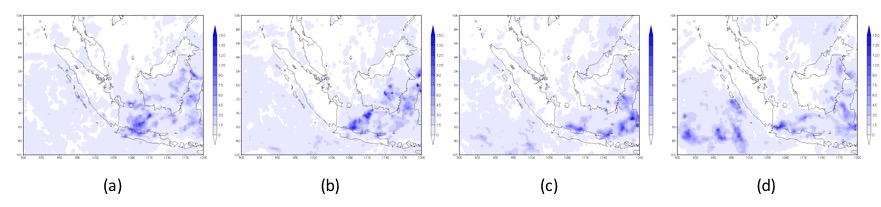
TRMM daily rainfall on 29 January (a), 30 (b), 31 (c) and 1 February, 2007 (d)
|
|
|
|
|
Cloud patterns over Java on 01 February, 2007. Morning (a) and afternoon (b)
|
|
|
|
References
General Meteorology and Basics
- Aldrian, E., 2010: Identifikasi dan Karakteristik Seruak Dingin. Jurnal LAPAN
- Aldrian, E., 2008: Meteorologi Laut Indonesia. Badan Meteorologi dan Geofisika
- Pratama, B.E., 2012: Kajian Karakteristik Parameter Cuaca terhadap Penjalaran Asian Cold Surge, Thesis.
- Chang et al., 1980a: Northerly Cold Surges and Near-Equatorial Disturbances over the Winter MONEX Area during December 1974. Part I: Synoptic Aspects, Monthly Weather Review, 107
- Chang et al., 1980b: Northerly Cold Surges and Near-Equatorial Disturbances over the Winter MONEX Area during December 1974. Part II: Planetary-Scale Aspects, Monthly Weather Review, 108
- Chang et al, 2005: Synoptic Disturbances over the Equatorial South China Sea and Western Maritime Continent during Boreal Winter, Monthly Weather Review, 133
- Chen et al., 2003, Annual cycle of the South China Sea Surface Temperature using the NCEP/NCAR Reanalysis, Journal of Meteorology Society. Japan, 81, 879-884, doi: 10.2151/jmsj.81.879
- Chen et al., 2015: Development and Formation Mechanism of the Southeast Asian Winter Heavy Rainfall Events around the South China Sea. Part I: Formation and Propagation of Cold Surge Vortex, Journal of Climate, 28
- Chin., 1969: Cold Surge over South China. Royal Observatory Hong Kong Technical Note No. 28
- Churchil, D.D and R.A. Houze Jr, 1984: Development and Structure of Winter Monsoon CLoud Clusters on December 1978. Journal of Atmospheric Sciences, 41, 6, 933 - 960
- Compo et.al, 1999: The Horizontal and Vertical Structure of East Asian Winter Monsoon Pressure Surge, Royal Meteorology Society, 125.
- Ding et al., 2009: Characteristic and Changes of Cold Surge Event over China during 1960-2007. Atmospheric and Oceanic Science Letter.
- Garreaud, 2001: Subtropical Cold Surges: Regional Aspect and Global Distribution. International Journal of Climatology, 21
- Hattori, 2011: Cross Equatorial Northerly Surge. Journal of the Meteorological Society of Japan, 89A
- Johnson, R.H and Zimmerman, J.R, 2004: Modification of the Boundary Layer over the South China Sea during a Winter MONEX Cold Surge Event. Monthly Weather Review, 114
- Koseki et al., 2014: Borneo Vortex and Mesoscale Convective Rainfall. Atmospheric Chemistry Physics, 14
- Lau, K. Ming, 1982: Equatorial Response to Northeasterly Cold Surges as Inferred from Satellite Cloud Imagery. Monthly Weather Review, 110
- Madden, R.A, Julian, Paul. R., 1972: Description of Global-Scale Circulation Cells in the Tropics with a 40-50 Days Period. Journal of the Atmospheric Sciences, 29
- Murakami, 1979: Winter Monsoonal Surges over East and Southeast Asia. Journal of the Meteorology Society of Japan, 57, 2
- Ooi et.al, 2011: A Case Study of the Borneo Vortex Genesis and its Interactions with the Global Circulation. Journal of Geophysical Research, 116
- Ramage., 1971: Monsoon Meteorology, Academic Press, New York, London
- Soerjadi, 2012: Tips Melacak Seruak Dingin (Cold Surge) Monsun Dingin Asia, http://pustakacuaca.blogspot.com/2012/10/tips-melacak-seruak-dingin-cold-surge.html#!
- Supari, 2006: Analisa Skala Makro dan Skala Meso terhadap Aktivitas Asian Cold Surge. Jurnal Meteorologi dan Geofisika, 7
- Taryono, 2012: Kajian Aktivitas Cold Surge dan Southeasterly Surge Saat Monsun Asia Musim Dingin di Wilayah Jawa, Thesis.
- Trilaksono, et al., 2012: A Time-lagged Ensemble Simulation on the Modulation of Precipitation over West Java in January-February 2007. Monthly Weather Review, 140
- WMO/TD No. 1266, 2005: The Global Monsoon System: Research and Forecast
- Wu et.al, 2007: The Impact of Trans-equatorial Monsoon Flow on the Formation of Repeated Torrential Rains over Java Island. SOLA, 3
- Zhang et al., 1997: Climatology and Interannual Variation of the East Asian Winter Monsoon: Results from the 1979-95 NCEP/NCAR Reanalysis. Monthly Weather Review, 125