Australian Storm seen through Cloud Phase RGB, 10 February 2020
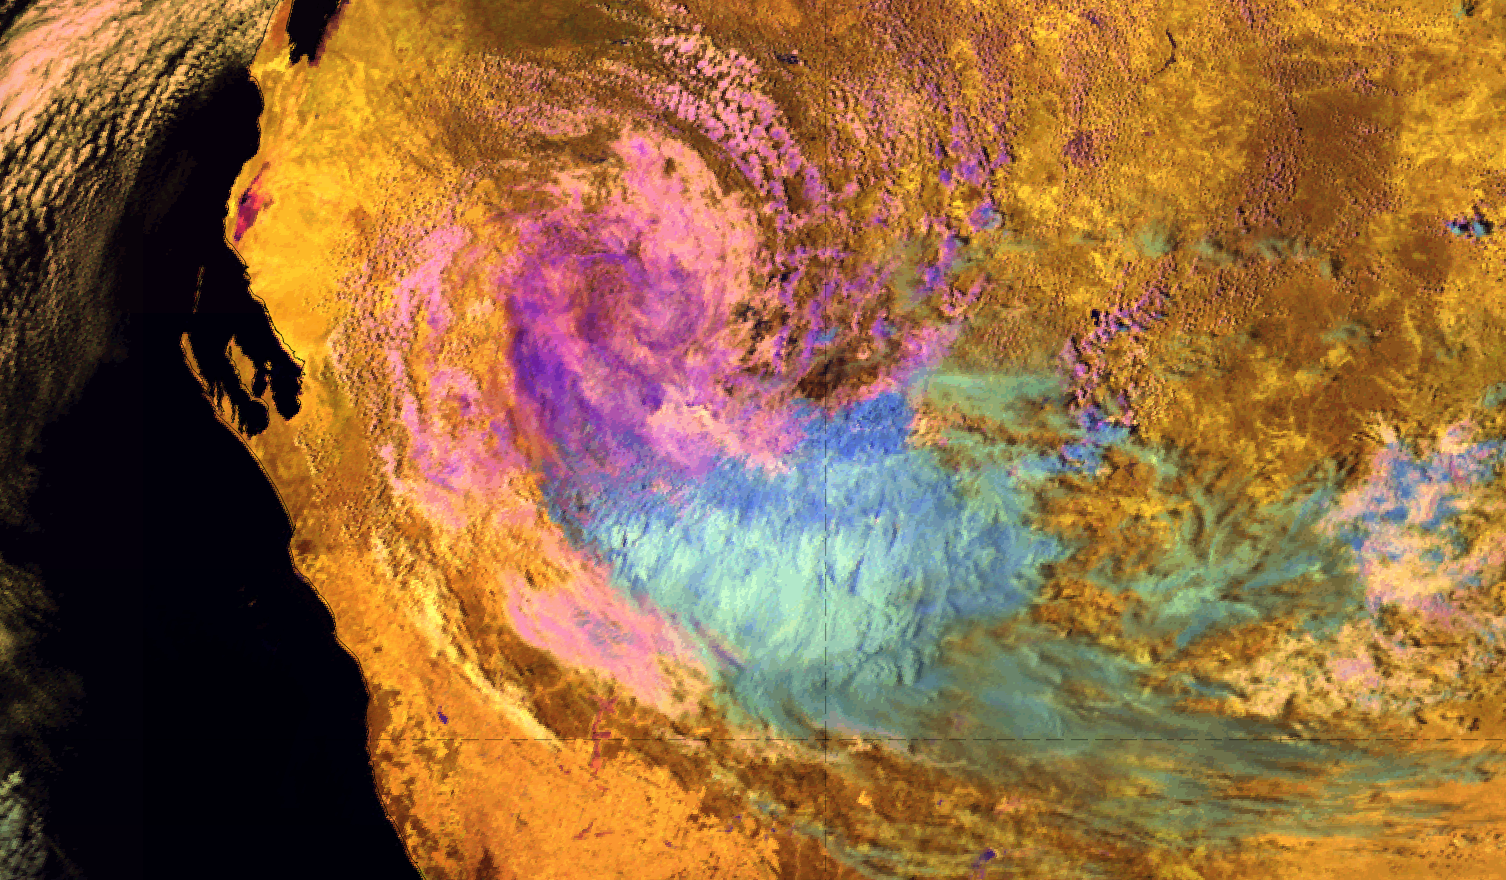
Figure 1: The system which developed over western Australia; Cloud Phase RGB on 10 February 2020 at 06 UTC
In the development of this big storm formed because of a depression over Australia a number of features connected with the Cloud Phase RGB and the convection cloud are nicely seen.
In the spiral of cloudiness one can clearly see the water phase and the particle size change, depending on the gradual change of colours of the associated clouds. Pinkish, purplish, dark and bright blue colors are beautifully divided in the system which enables clear assessment of each part.
In the upper right part of the low pressure system clouds over western Australia there are lower water clouds with mostly smaller particles, depicted in pinkish tones - optically a rather thick cloud (moderate 0.67 μm signal) with very high contribution of the red beam or the 1.6 μm channel, suggesting it is clearly a water cloud. Lastly, the green contribution from 2.25 μm is also in its medium ranges, which suggests a cloud with medium to small particles.
The upper left part of the cloud is of purplish tones or in other words, medium red (1.6 μm), low green (2.25 μm) and medium blue (0.67 μm) contribution. The meaning of that is that the cloud is again rather thick (medium 0.67 μm) with large particles (low 2.25 μm) and still with a high contribution from the 1.6 μm channel meaning thick water cloud.
The fact that the reflection of the NIR1.6 and NIR2.25 spectral bands on ice is completely opposite (NIR1.6 is more absorbed by ice than water, whilst NIR2.25 is more reflected by it) is the reason why ice and water are so nicely distinguished from each other, pointing at the main attribute of this Cloud Phase RGB.
The 0.67 μm channel's signal is only a bit stronger when going from the liquid to the solid water phase, so it doesn't give a lot of additional information. However, the 2.25 μm channel shows high reflection for the brighter blue shades of the cloud (small ice crystals) and low to medium reflection for the darker blue shades (large ice crystals). The 1.6 μm channel is changing differently in the transition from water to ice and it is losing brightness in the process.
Table 1: The approximate changes of brightness in different transitions for a few samples of the observed case study. The numbers in the table represent the amount of a specific colour (red for 1.6 μm, green for 2.25 μm) present at one point of the image. Subjective interpretation only.
| Water: small => big (cca) | Ice: small => big (cca) | Big: water => ice (cca) | Small: water => ice (cca) | |
|---|---|---|---|---|
| 1.6 μm | -120 | -90 | -60 | -90 |
| 2.25 μm | -80 | -110 | +60 | +80 |
Conclusion

Figure 2: Cloud Phase RGB on 10 February 2020 at 06 UTC - Cloud phases
To conclude, the 2.25 μm channel gives a weak signal (big droplets) to moderate signal (small droplets) for water clouds and moderate signal (big crystals) to strong signal (small crystals) for ice clouds. Thus, the 2.25 μm channel is a great new asset, together with the 'old' channels, for observing and analysing phase shifting and different cloud types.