2. Investigate the vertical moisture distribution
The next step consists of identifying the location of the moisture in the vertical profile.
The moisture in ARs is characterized by:
- high water vapour concentrations at layers below 700 hPa.
This characteristic of ARs is best analysed from model humidity fields.
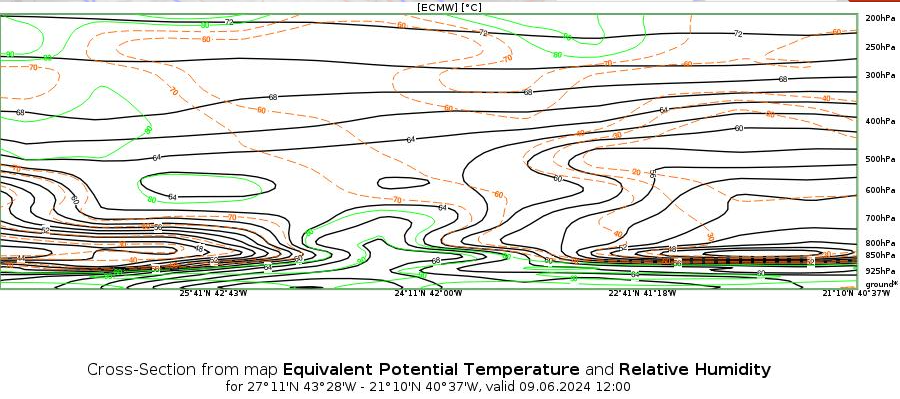
Figure 6: Vertical cross section through an AR. A bulge of high relative humidity values reaching up to 700 hPa
can be seen in the middle of the cross section.
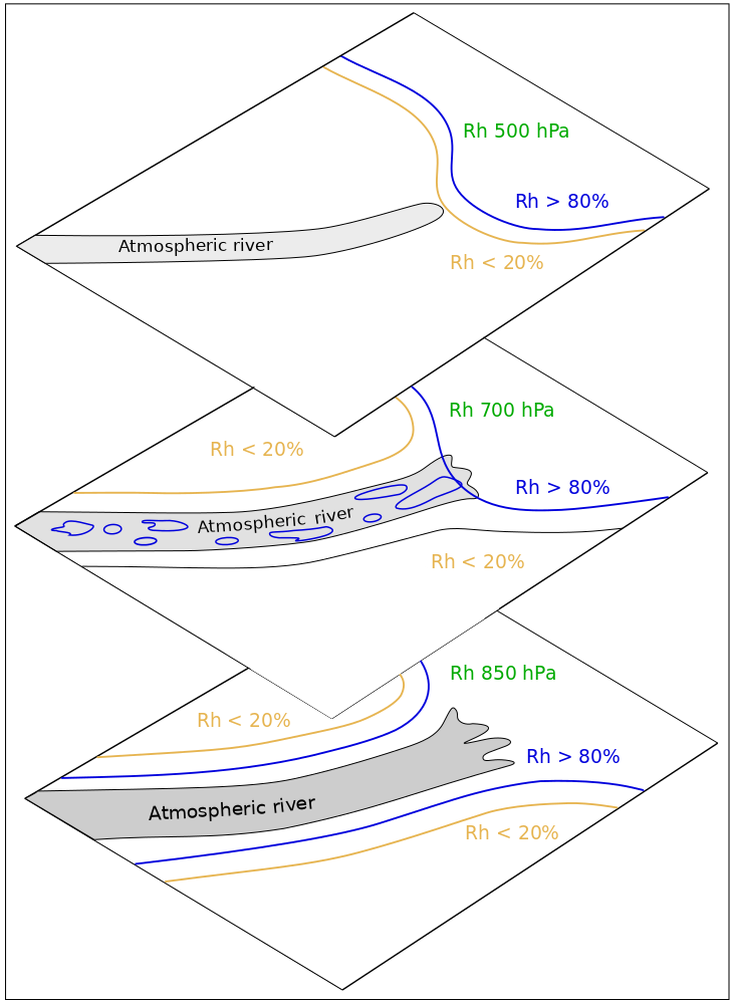
Figure 7: Left: 2-D charts of relative humidity at levels 500, 700 and 850 hPa. Right: Schematic of the relative humidity charts.
Most of all, "rivers in the sky" are characterized by their flow. In the next chapter, we find out how these moisture bands behave like rivers.
Exercise 2
Click on the images and go through the gallery, then answer the question.
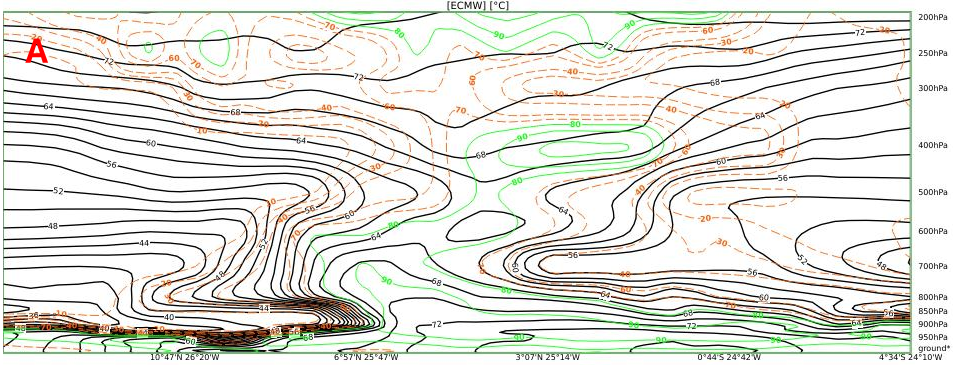
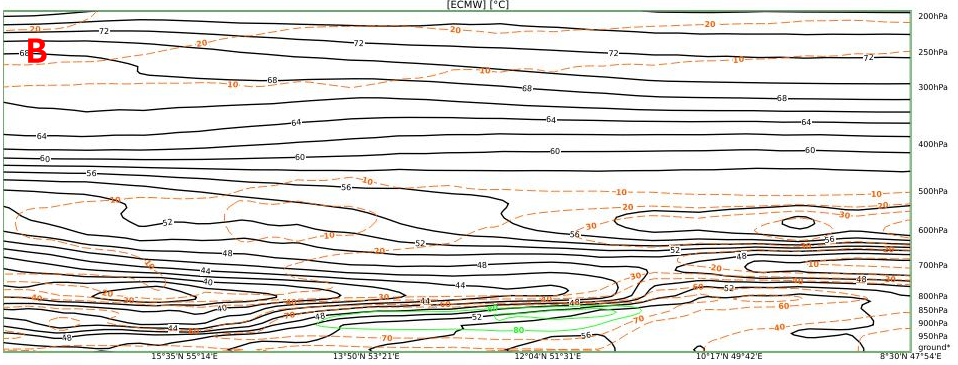
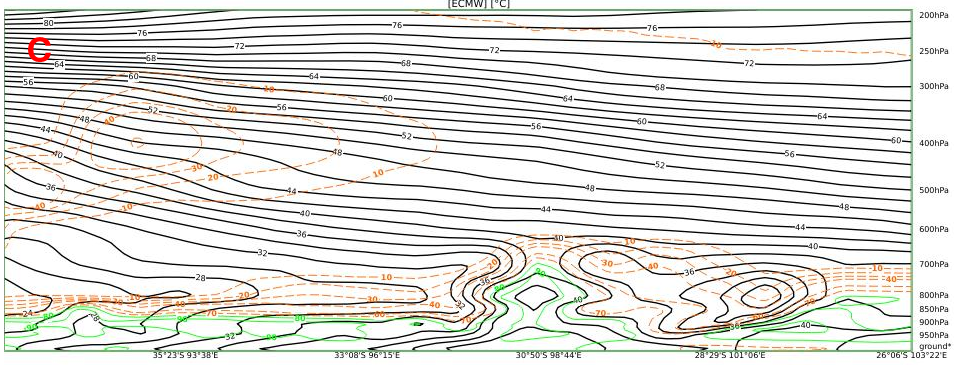
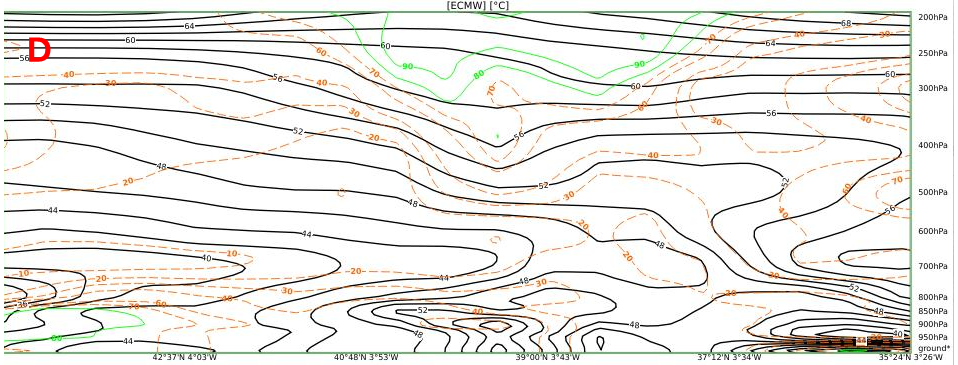
Identify the model cross sections that show signs of an AR.